The Chinese Meteorological Society
Article Information
- Yong CHEN, Junling AN, Xiquan WANG, Yele SUN, Zifa WANG, Jing DUAN . 2017.
- Observation of Wind Shear during Evening Transition and an Estimation of Submicron Aerosol Concentrations in Beijing Using a Doppler Wind Lidar. 2017.
- J. Meteor. Res., 31(2): 350-362
- http://dx.doi.org/10.1007/s13351-017-6036-3
Article History
- Received March 31, 2016
- in final form September 18, 2016
2. Center for Excellence in Urban Atmospheric Environment, Institute of Urban Environment, Chinese Academy of Sciences, Xiamen 361021;
3. Chinese Academy of Meteorological Sciences, Beijing 100081
Beijing is located on the North China Plain (NCP), which is adjacent to the Yan and Taihang Mountains to the north and west, respectively, and is frequently affected by mountain–plain wind circulation. Observations of the mountain–plain wind around Beijing began in earnest in the 1980s, and most of these early studies focused on its formation, horizontal streamline field, and vertical distribution, including depth and related Kelvin–Helmholtz (K–H) waves (Li et al., 1982; Zhu et al., 1982, 1985; Liu et al., 1983; Wang et al., 2008; Dou et al., 2014). Under weak synoptic forcing, the regional mountain–plain wind is the main flow over the Beijing area and is always accompanied by low-visibility weather phenomena, such as fog or haze. The mountain–plain wind system can be influenced by urban heat island circulation (Zhu et al., 1982; Wang et al., 2008) and controlled by a range of mesoscale surface weather systems (Liu et al., 1983). Liu et al. (1983), based on seven years of observations, indicated that 75% of the mesoscale lows over the NCP during the winter half-year (October to the following April) are always accompanied by a regional visibility of less than 4 km; and the formation and development of mesoscale lows are mainly due to the reduced-pressure effect of the topography on the leeward side and the flow pattern of the mountain–plain wind.
Evening transition is defined as the period when the upslope wind changes to downslope wind. Recently, several field experiments were conducted in Phoenix and Dugway, USA (Shaw et al., 2005; Fernando et al., 2013, 2015). Similar to the finding in Beijing (Zhu et al., 1982; Liu et al., 1983), the depth of the mountain–plain wind reached several hundred meters in Phoenix (Shaw et al., 2005), but the average speed of the mountain–plain wind in Dugway was only 0.5 m s–1 (Fernando et al., 2015).
The transport and diffusion of air pollutants during evening transition has received an increasing level of attention in recent years. For instance, it has been reported that turbulent mixing/entrainment can increase the 2-m coarse dust concentration during this transition period (Fernando et al., 2015), whereas the ground-level particulate matter (PM) concentration decreases after the shift in wind direction (Alexandrova et al., 2003; Pardyjak et al., 2009). In addition, an increase in ozone near the ground can be caused by the regional transport of ozone and its precursors due to low-level jets at night (Lee et al., 2003). Possible conceptual models of the effect of mountain–plain wind on the concentration of air pollutants over complex terrain during evening transition were proposed by Lee et al. (2003) and Fernando et al. (2013); and lake breezes and their effects on air pollutant dispersion were studied by Moroz (1967) and Lyons and Olsson (1973).
As mentioned above, some interesting features pertinent to evening transition have been found in recent observations. However, few studies have paid attention to the detailed characteristics of wind and pollutants at low levels of the planetary boundary layer during evening transition in Beijing. Doppler wind lidar is one of the most important Doppler-effect-based remote sensing tools for measuring the variations of both winds and particles, and thus the relationship of the carrier-to-noise ratio (CNR) and the concentration of PM can be obtained (Aitken et al., 2012). However, comparisons of CNRs and in-situ PM measurements from meteorological towers using an extended period of data are lacking. Therefore, in this study, the long-term in-situ data measured by wind sensors mounted on the 325-m meteorological tower in Beijing were used to quantify the accuracy of Doppler wind lidar data. Then, the characteristics of the low-level wind and PM during evening transition were investigated, followed by testing of the relationship between the CNRs and PM1 (aerodynamic diameter ≤ 1 μm) concentrations.
2 Measurement site, instrument, and datasetThe measurement site [(39°58′N, 116°22′E); 49 m above sea level] is located in north–central Beijing, 40 km south of the Yanshan Mountains and 20 km west of the Taihang Mountains. This site is a typical urban site, and home to the 325-m Beijing meteorological tower (BMT) operated by the Institute of Atmospheric Physics (IAP), Chinese Academy of Sciences. The field in which the tower is situated is flat and mainly covered by residential houses with varying heights of 3–13 m, and some high buildings with heights of 70–90 m, scattered in nearly all directions (Al-Jiboori and Hu, 2005). The nearest tall buildings are approximately 150–200 m south and southwest from the BMT (Al-Jiboori and Hu, 2005).
The BMT measures the wind (010C cup anemometers and 020C wind vanes, Metone, USA), air temperature (IAP-T-B, IAP, China), and humidity (IAP-RH-A, IAP, China) at 15 levels (8, 15, 32, 47, 65, 80, 100, 120, 140, 160, 180, 200, 240, 280, and 320 m). The cup anemometers are placed on two 4-m arms extending northwest and southeast from the pole, whereas the wind vanes are only placed in the southeast direction of the pole. These wind sensors are especially useful when a low starting threshold (0.22 m s–1) is required.
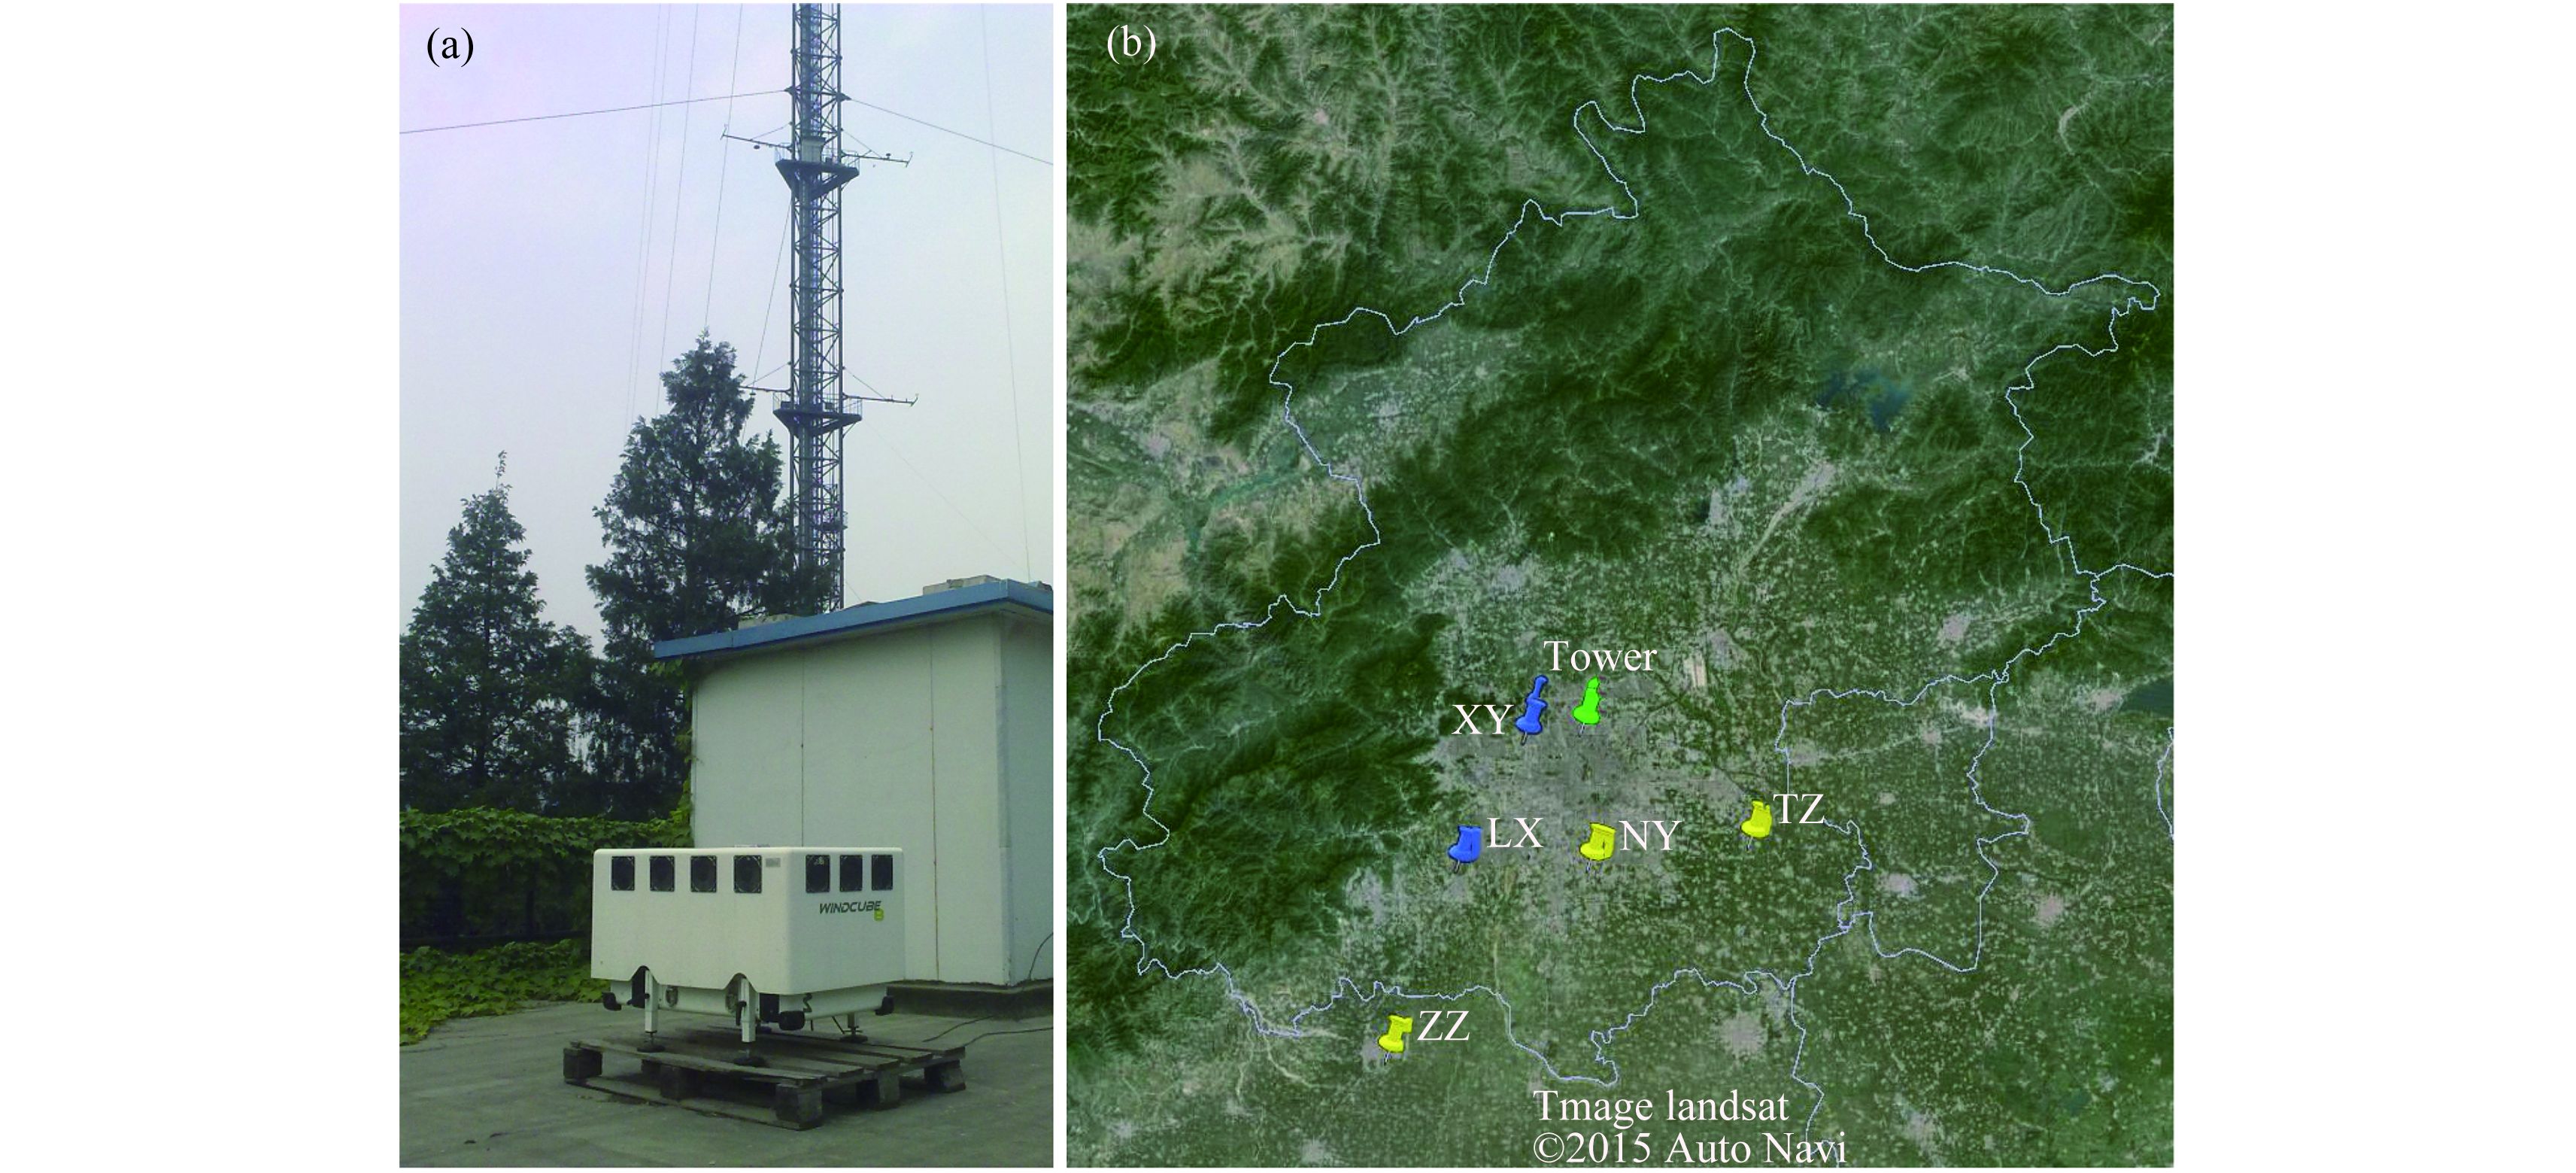
A Doppler beam swinging wind lidar called “Windcube-8, ” which was developed by Leosphere Company (Orsay, France), was installed near the BMT to obtain high-resolution wind profiles from 40 to 300 m. The radial wind speed along four cardinal geographical directions separated by 90° was measured sequentially, and the wind sector was then reconstructed. The instrument can perform measurements of wind speed and direction at up to 10 heights depending on the environmental and weather conditions, such as aerosol backscatter, turbulence, humidity, and precipitation, and produce time series at each height with an average time of 1.1 s (using one new beam and three relatively old beams) and an independent sampling rate of 4 s (using four new beams). More technical details of the lidar can be found in Table 1 and in Aitken et al. (2012). The Windcube-8 was mainly operated on the roof of the two-story office building every autumn and winter, and has been 50 m southwest of the BMT since autumn 2010 (Fig. 1a). Three height ranges were used: the height range of 40–220 m (40, 60, 80, 100, 120, 140, 160, 180, 200, and 220 m) was set mainly for evaluating the accuracy of the horizontal wind and the wind shear during evening transition; whereas, the height ranges of 80–300 m (80, 110, 140, 170, 200, 220, 240, 260, 280, and 300 m) and 40–320 m (40, 80, 110, 140, 170, 200, 220, 240, 280, and 320 m) were set to explore the relationship between CNRs and PM1 concentrations.
| Laser wavelength | 1.54 μm |
| Vertical range | 40–220, 80–300, and 40–320 m |
| Range resolution | 20, 30, and 40 m |
| No. of range gates | 10 |
| Accumulation time | 1.1 s |
| Scanning cone angle | 27.72° |
| Accuracy of wind speed | 0.20 m s–1 |
| Accuracy of wind direction | 1.5° |
| Environmental temperature range | –35 to 40°C |
|
| Figure 1 (a) Photo of the Windcube-8 at the IAP. (b) Locations of the 325-m meteorological tower and five meteorological stations, among which XY (Xiyuan) and LX (Liangxiang) are located in northwestern Beijing, and ZZ (Zhuozhou), NY (Nanyuan), and TZ (Tongzhou) in southeastern Beijing. |
An aerosol chemical speciation monitor (ACSM, Aerodyne Research Inc., Billerica, USA) was used to measure PM1 concentrations and was deployed at 260 m above the ground in the BMT. The ACSM has a temporal resolution of approximately 5 min, and Sun et al. (2012) showed that the ACSM’s ground measurements agreed well with PM2.5 (aerodynamic diameter ≤ 2.5 μm) concentrations measured by a co-located (approximately 30 m away) tapered element oscillating microbalance. Two periods of the 5-min PM1 concentration measured by the ACSM at 260 m was used in this study: one from 18 December 2013 to 2 January 2014 (Sun et al., 2015), and the other during 11–21 October 2014 (Chen et al., 2015; Sun et al., 2016).
The mesoscale surface weather charts of 2011 over the NCP (Li, 1991) and radiosonde measurements from launches at Beijing meteorological station () were used for analysis in this study. All of the data are reported in Beijing Standard Time (BST, UTC+0800).
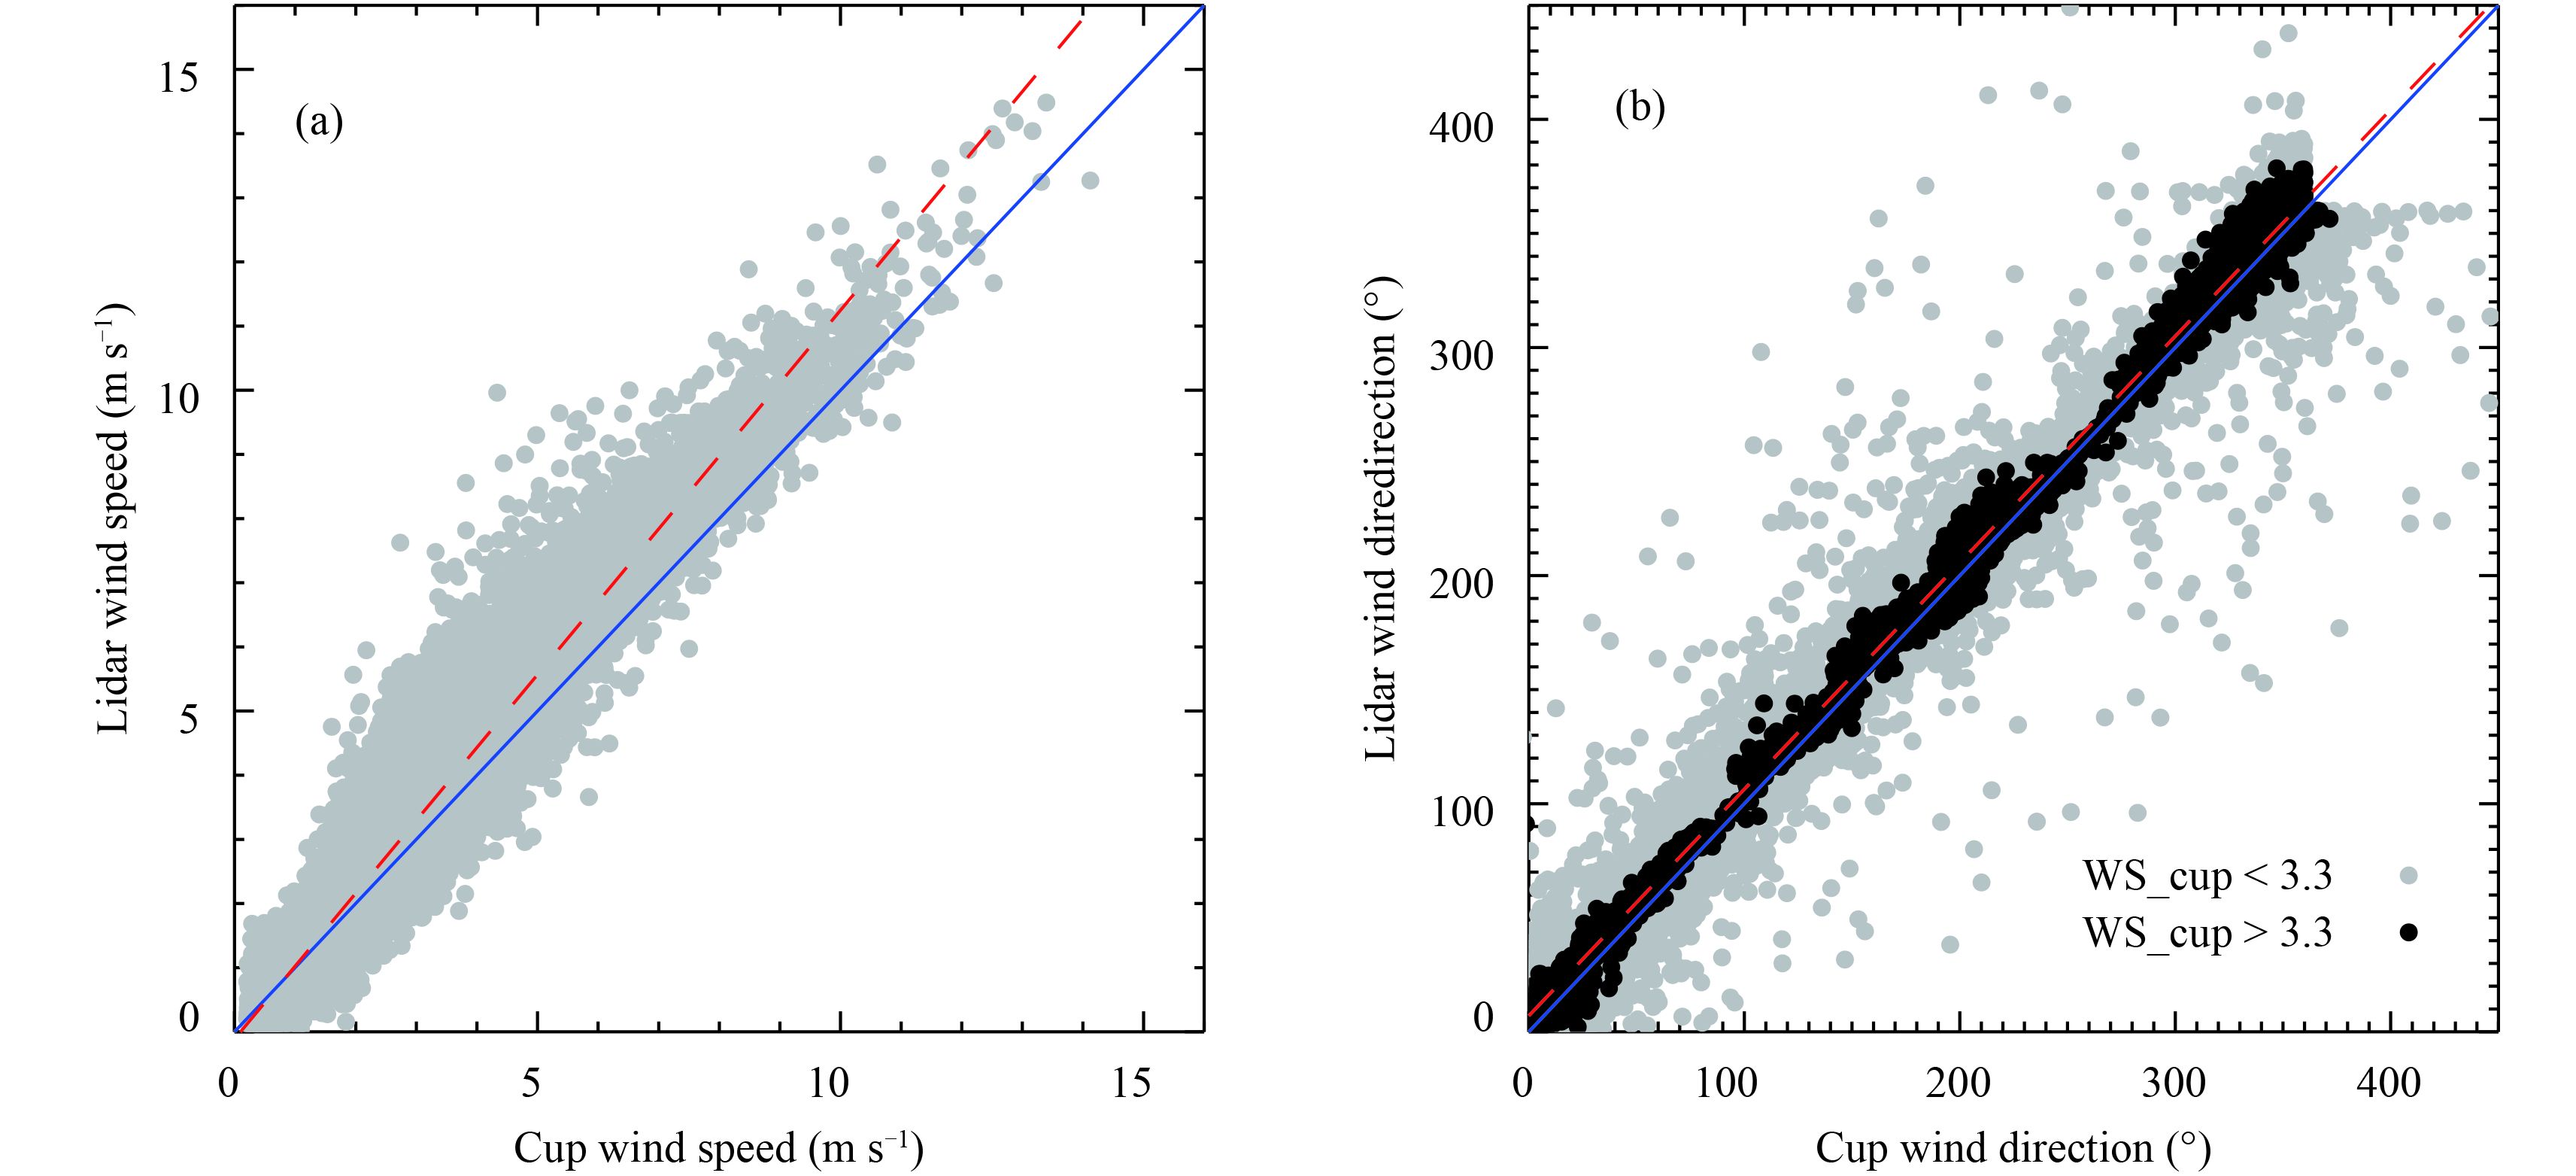
3 Comparisons of the Windcube-8 and 325-m meteorological tower wind measurementsComparisons of the horizontal wind speeds and directions measured by the Wincube-8 and the BMT were made at three height levels. The heights of 80, 140, and 200 m were selected as representative heights that have less impact on wind measurements from adjacent buildings. We averaged the wind data from the Windcube-8 and the BMT at 10-min intervals to obtain the same temporal resolution for both datasets and reduce the impact of the time synchronization of both measurements. The comparison period lasted almost 6 months, from 18 October 2013 to 22 April 2014. When using equipment mounted on a meteorological tower to measure wind speeds, the body of the tower will affect the local flow, which leads to measurement flow distortion relative to the true wind flow; therefore, the wind speed equipment mounted on the tower on the upwind arm is more accurate than that on the downwind arm (Dabberdt, 1968; Cheng et al., 2014). Therefore, the wind speed measurements from the northwest arm were chosen if the wind direction was 247.5°–360° or 0°–67.5°, whereas the wind speed measurements from the southeast arm were taken if the wind direction was 67.5°–247.5°. Both of the 10-min wind datasets, from the cup/vane and Windcube-8, used the vector average method. In addition, the wind direction was also averaged by the highest frequency method, which was chosen as the highest probability distribution for the 16-bin directions from 0° to 360°.
Table 2 compares the wind measurements between the Windcube-8 and the tower at 80, 140, and 200 m. By considering the starting threshold (0.22 m s–1) of the cup anemometers and wind vanes, only the data with a wind speed above 0.22 m s–1 were used in the comparison.
| Height (m) | Fitting function (y = a x + b) | R | N | AD | RMSE | |
| Wind speed | 80 | y = 1.136x – 0.113 | 0.96 | 26159 | 0.25 m s–1 | 0.63 m s–1 |
| 140 | y = 1.090x – 0.114 | 0.98 | 26170 | 0.22 m s–1 | 0.62 m s–1 | |
| 200 | y = 1.093x – 0.121 | 0.98 | 26138 | 0.28 m s–1 | 0.75 m s–1 | |
| Wind direction | 80 | y = 0.993x + 7.016 | 0.99 | 26193 | 6° | 15° |
| 140 | y = 0.998x + 4.099 | 0.99 | 26170 | 5° | 14° | |
| 200 | y = 0.998x – 3.127 | 0.99 | 26138 | –4° | 15° | |
| Note: Only the data with 10-min wind speed measured by the cup anemometers > 0.22 m s–1 were used from 18 October 2013 to 22 April 2014. AD indicates average deviation and RMSE indicates root-mean-square error. | ||||||
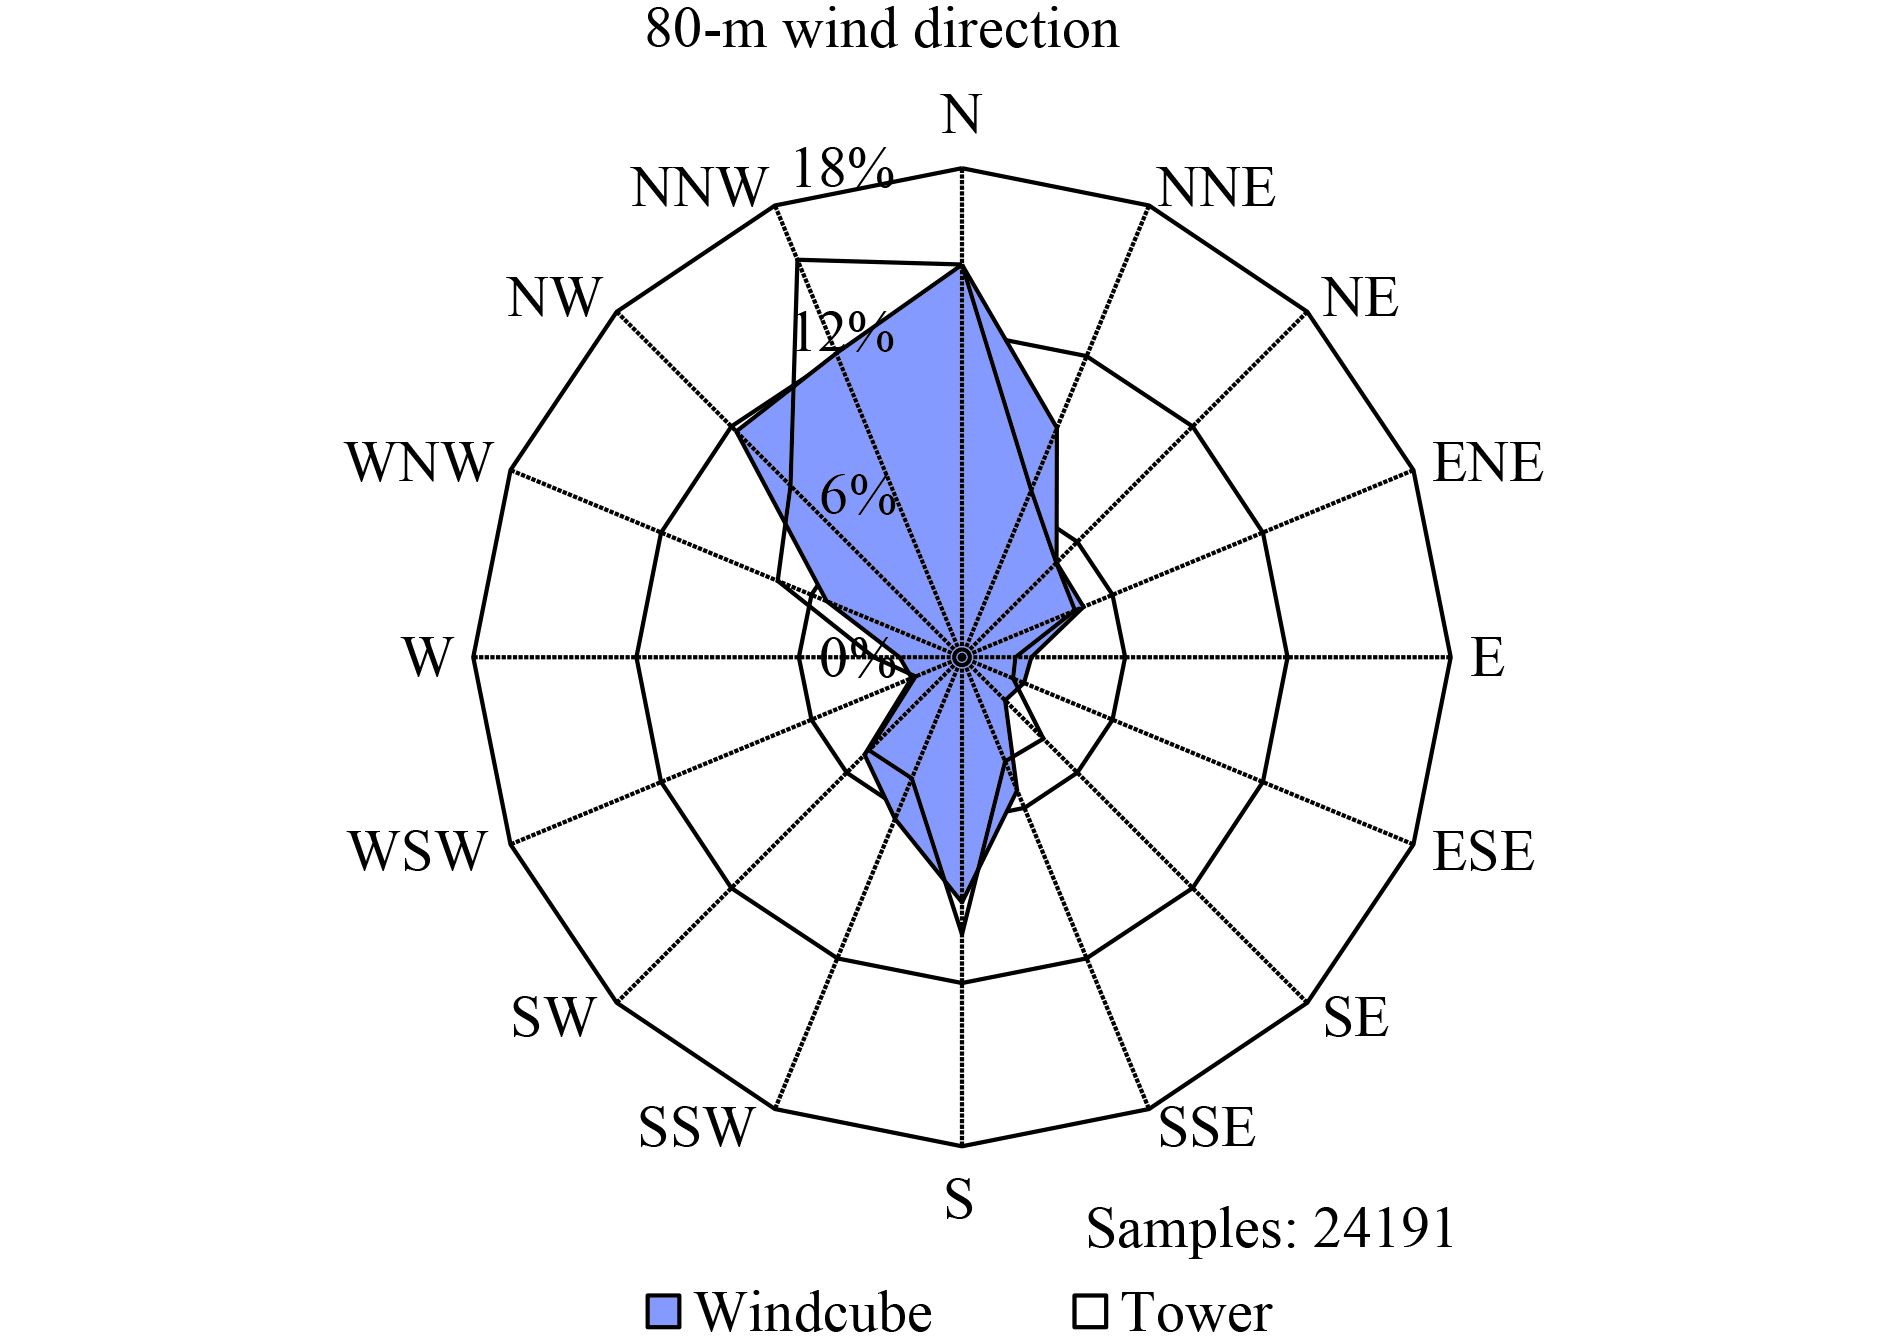
The wind speed data from the Windcube-8 correlated very well with the tower measurements at 80, 140, and 200 m, with correlation coefficients of 0.96–0.98 (Fig. 2a and Table 2). The average bias was 0.22–0.28 m s–1, which suggests that wind speeds measured by the Windcube-8 tend to be larger than those by the tower (Table 2). Wind directions from the Windcube-8 also agreed well with the tower measurements at 80, 140, and 200 m, with high correlation coefficients of 0.99 and low average biases within ±6° (Table 2), which is consistent with the result of Xia et al. (2011). A scatter diagram of the wind direction measured by the Windcube-8 and the BMT shows that the points of wind speeds being less than 3.3 m s–1 were more dispersed than those above 3.3 m s–1, which suggests that strong winds lead to more homogenous flows (Fig. 2b). In addition, the wind roses by using the highest frequency method from the Windcube-8 and the tower measurements showed a similar pattern, with the wind mainly coming from the northwest and south during the observation period (Fig. 3).
|
| Figure 2 Comparisons of the 10-min averaged wind (a) speed and (b) direction measured by the Windcube-8 and cup anemometers/wind vanes at 80-m height (18 October 2013 to 22 April 2014). For an improved comparison of the wind direction measured by the BMT or the Windcube-8, the measured value in the range of 0°–90° was added to 360° for both measurements within 0°–90° and 270°–360°, respectively, meaning that some values of the wind direction were higher than 360°. |
|
| Figure 3 Wind rose showing the 10-min highest frequency of wind direction measured by the Windcube-8 and the wind vane at a height of 80 m (18 October 2013 to 22 April 2014). |
The consistent measurements between the Windcube-8 and the tower demonstrate that the Windcube-8 is a reliable system for measuring the profile of horizontal wind speed and direction below 200 m. Also noteworthy is that the wind difference between the Windcube-8 and the tower was mainly from the sampling volumes and measuring principles (Chintawongvanich et al., 1989). The Windcube-8 measures winds by sampling an annular volume of the atmosphere as its laser beam sweeps the space conically, whereas the tower sensors record wind data from a stationary position as the wind passes the tower (Chintawongvanich et al., 1989).
4 Evening transition events with wind shear and their characteristics 4.1 OverviewWind profiles measured by the Windcube-8 at the IAP in Beijing during autumn (September, October, and November) and winter (December, January, and February) from 2010 and 2014 were used to determine mountain–plain wind events characterized by a vertical wind direction shear (Table 3). Based on the Windcube-8 wind profiles, each day was grouped into a day characterized by wind direction shear caused by the mountain–plain wind if (1) the wind pattern had a diurnal wind direction change (e.g., southerly wind during the day and northerly wind at night), (2) the wind speed at 80 m during evening transition was less than 2 m s–1, and (3) the wind direction shear during evening transition between 40 and 220 m lasted at least 10 min.
| Period | Dws in autumn | Dws in autumn and winter | Total number of days |
| 11 Oct 2010–28 Feb 2011 | 13 | 23 | 133 |
| 8 Sep 2011–1 Jan 2012 | 28 | 28 | 90 |
| 9 Oct 2012–6 Feb 2013 | 16 | 21 | 116 |
| 17 Oct 2013–6 Feb 2014 | 14 | 28 | 134 |
As shown, the number of days of wind direction shear caused by the mountain–plain wind for the four periods ranged from 21 to 28, with at least half of the events (14 out of 28 days during 17 October 2013 and 6 February 2014) occurring in autumn (Table 3) and accounting for 17%–30% (23 out of 133 days and 28 out of 90 days) of the total days used in the statistics (Table 3), approaching the occurrence frequency (33.3%) of mesoscale lows (Liu et al., 1983). Therefore, the mountain–plain wind characterized by wind shear during evening transition occurs frequently in Beijing, at least in autumn if strong synoptic wind events are excluded.
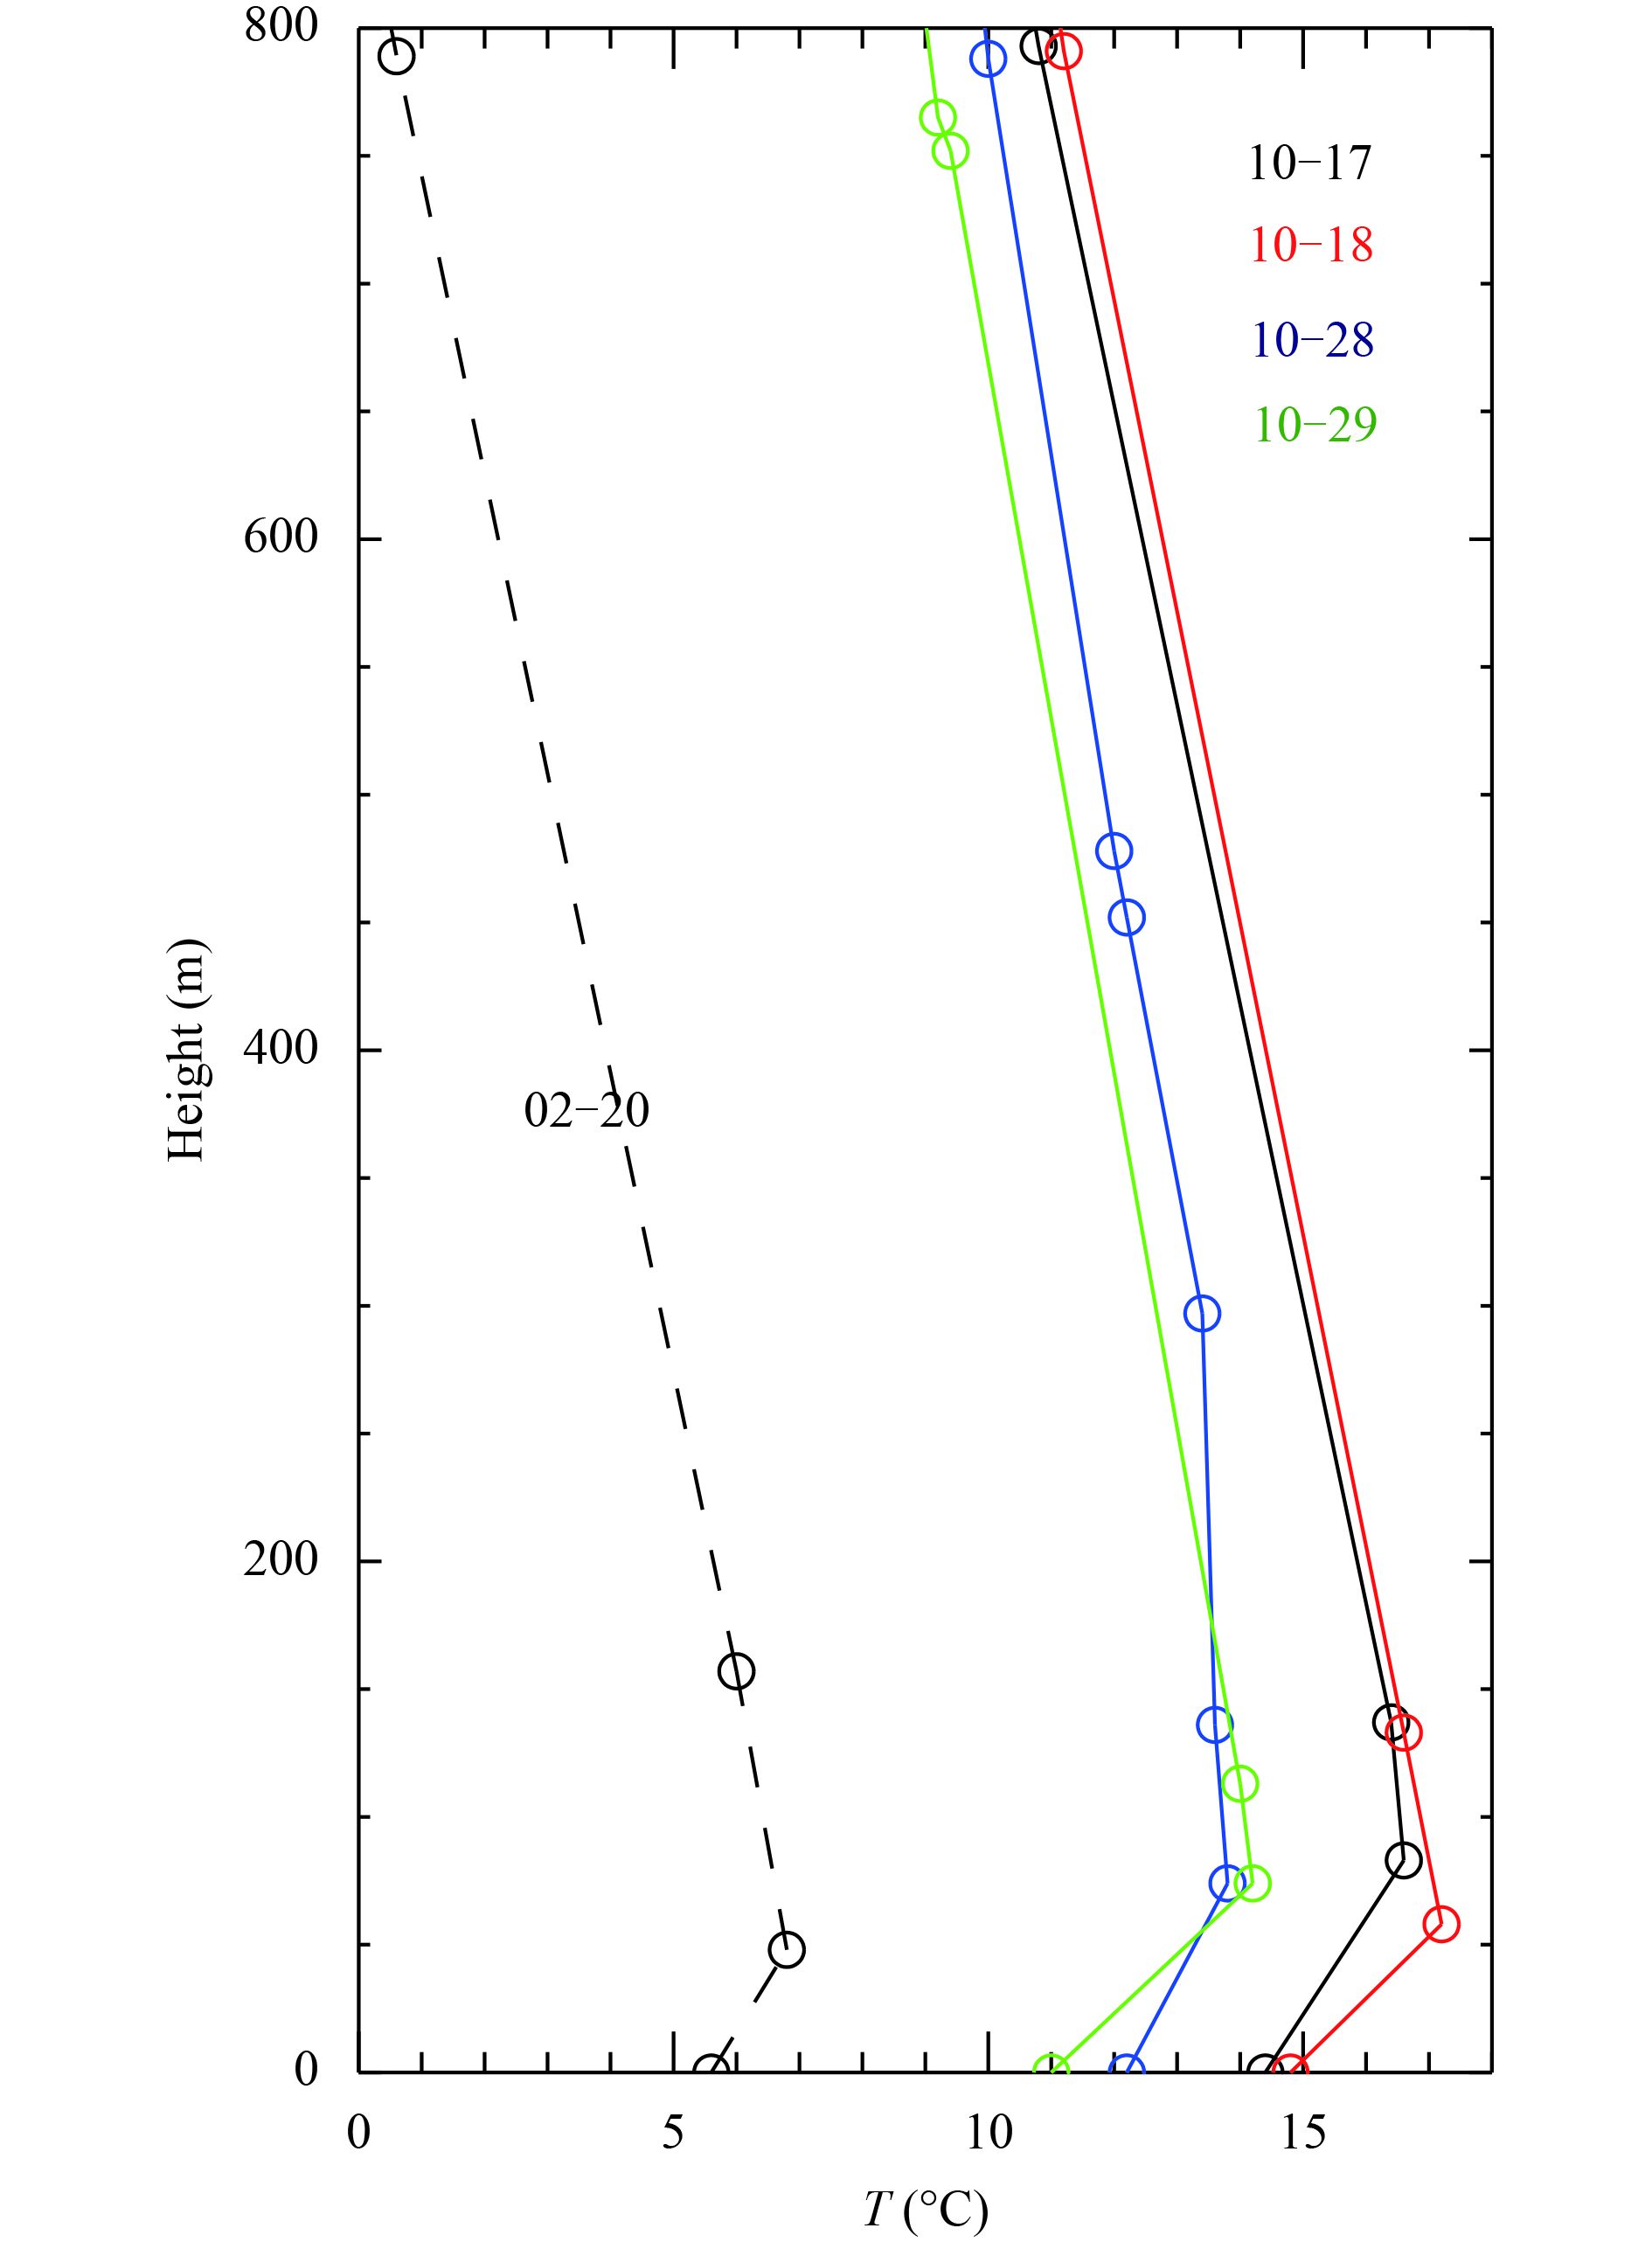
To facilitate an in-depth analysis of the evening transition with wind shear, five mountain–plain wind events characterized by approximately 180° wind direction shear between two adjacent vertical layers, and the corresponding duration being greater by approximately 1 h in low winds (< 2 m s–1 at 80 m), were selected (Table 4). Four of the events occurred in autumn and one in winter. The mountain winds at 80 m in the evening transitions were mainly from the northwest and north, and their mean wind speed was approximately 1 m s–1. Additionally, some thermal inversion layers at lower heights (< 100 m above ground level) at Beijing meteorological station (approximately 20 km SE of BMT) could be found at approximately 2000 BST before or during the evening transition events (Fig. 4).
|
| Figure 4 Temperature profiles of five events (Table 4) at 2000 BST, as measured by radiosonde at Beijing meteorological station. |
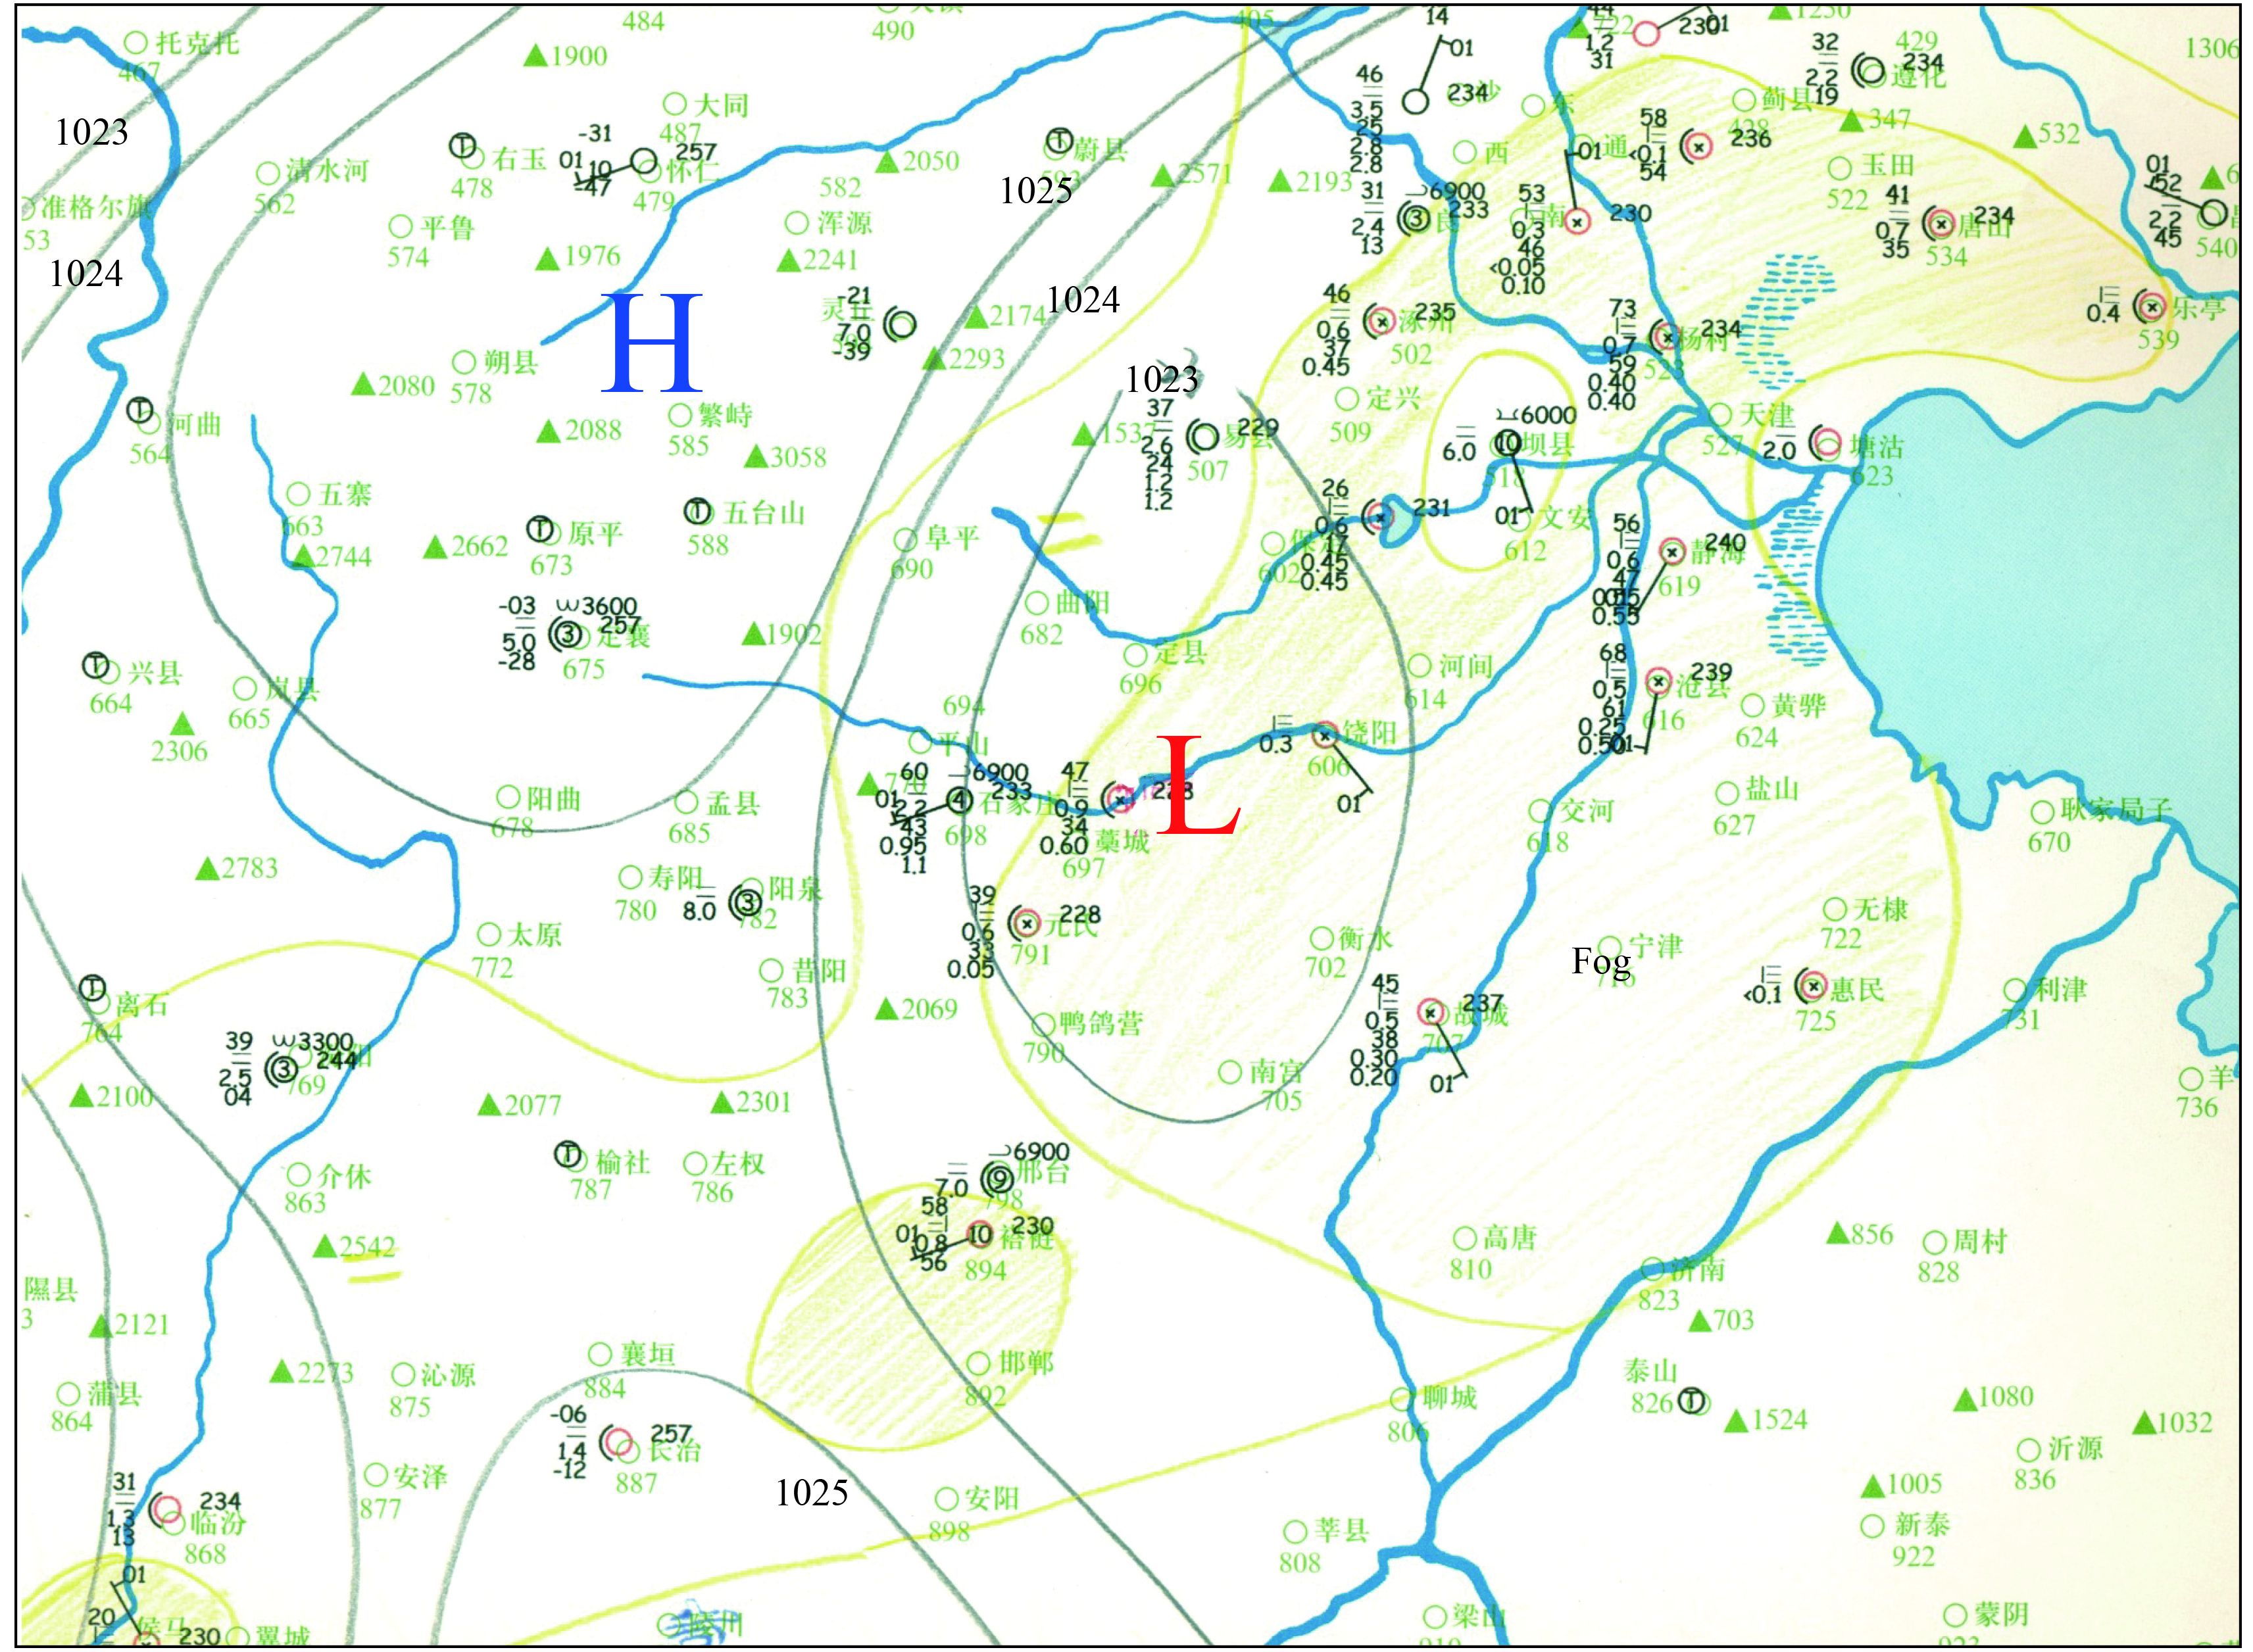
In these events, southwest–northeast-oriented widespread fog or hazy areas existed to eastern Taihang Moun-tains over the NCP, according to the 1-h mesoscale surface weather charts of 2011 (e.g., Fig. 5). The regional visibility decreased from north to south, e.g., the visibility in northeastern Beijing (Zhuozhou, Nanyuan, and Tongzhou stations–locations marked in Fig. 1b) was less than 1 km (fog), whereas in southwestern Beijing (Xiyuan and Liangxiang stations) it was 2.5 km (mist), on 28 October 2011 (Fig. 5). The visibility at Liangxiang station on 17 and 18 October 2011 was higher than that for the other events (Table 4).
| Night | Transition period | Duration (h) | WS-80 m (m s–1) | Mountain WD | Closed ML | V-LX20 (km) | Regional fog |
| 20 Feb | 0130 BST 21 Feb–0400 BST 21 Feb | ~2.5 | 0.97 | NW | No | 1.5 | Fog |
| 17 Oct | 0210 BST 18 Oct–0300 BST 18 Oct | ~1.0 | 1.18 | NW | Yes | 20.0 | Mist |
| 18 Oct | 2220 BST 18 Oct–0120 BST 19 Oct | ~3.0 | 1.08 | NW | No | 5.0 | Fog |
| 28 Oct | 2210 BST 28 Oct–0100 BST 29 Oct | ~3.0 | 0.87 | N | Yes | 3.5 | Fog |
| 29 Oct | 2330 BST 29 Oct–0100 BST 30 Oct | ~1.5 | 0.94 | NW | No | 2.5 | Fog |
| Notes: WS-80 m indicates the average wind speed during the transition period; V-LX20 indicates the visibility at Liangxiang station at 2000 BST; and closed ML indicates a closed mesoscale low pressure system over the NCP. | |||||||
As mentioned in the introduction, the mesoscale low is always accompanied by widespread air pollution in the NCP under weak synoptic forcing in the winter half-year (Liu et al., 1983). Generally, the mesoscale low emerges around midnight, strengthens in the morning, and then disappears around noon, because it depends on the diurnal flow pattern of the mountain–plain wind caused by the thermal effect/structure between the mountains and plains (Liu et al., 1983). Therefore, it is important to know whether the mesoscale weather system controls the evening transition with wind shear. If a closed low-pressure event with an interval of 1 hPa exists within 0600–0800 BST over the NCP the next day, the main mesoscale weather system in the NCP is the mesoscale low (Liu et al., 1983). A closed low-pressure event occurred on 17 and 28 October 2011, whereas circulation occurred for each of the other three events. The longest persistent mesoscale low of those events occurred on 28 October 2011, and maintained for nearly 5 h during the next morning (Fig. 5).
|
| Figure 5 The 0700 BST mesoscale surface weather chart on 29 October 2011 (adapted from a hand-drawn plot). The solid black lines denote the sea level pressure; blue lines denote the rivers and coastline of the region; the “L” and “H” indicate the locations of low and high pressure; and the yellow lines denote the fog areas. |
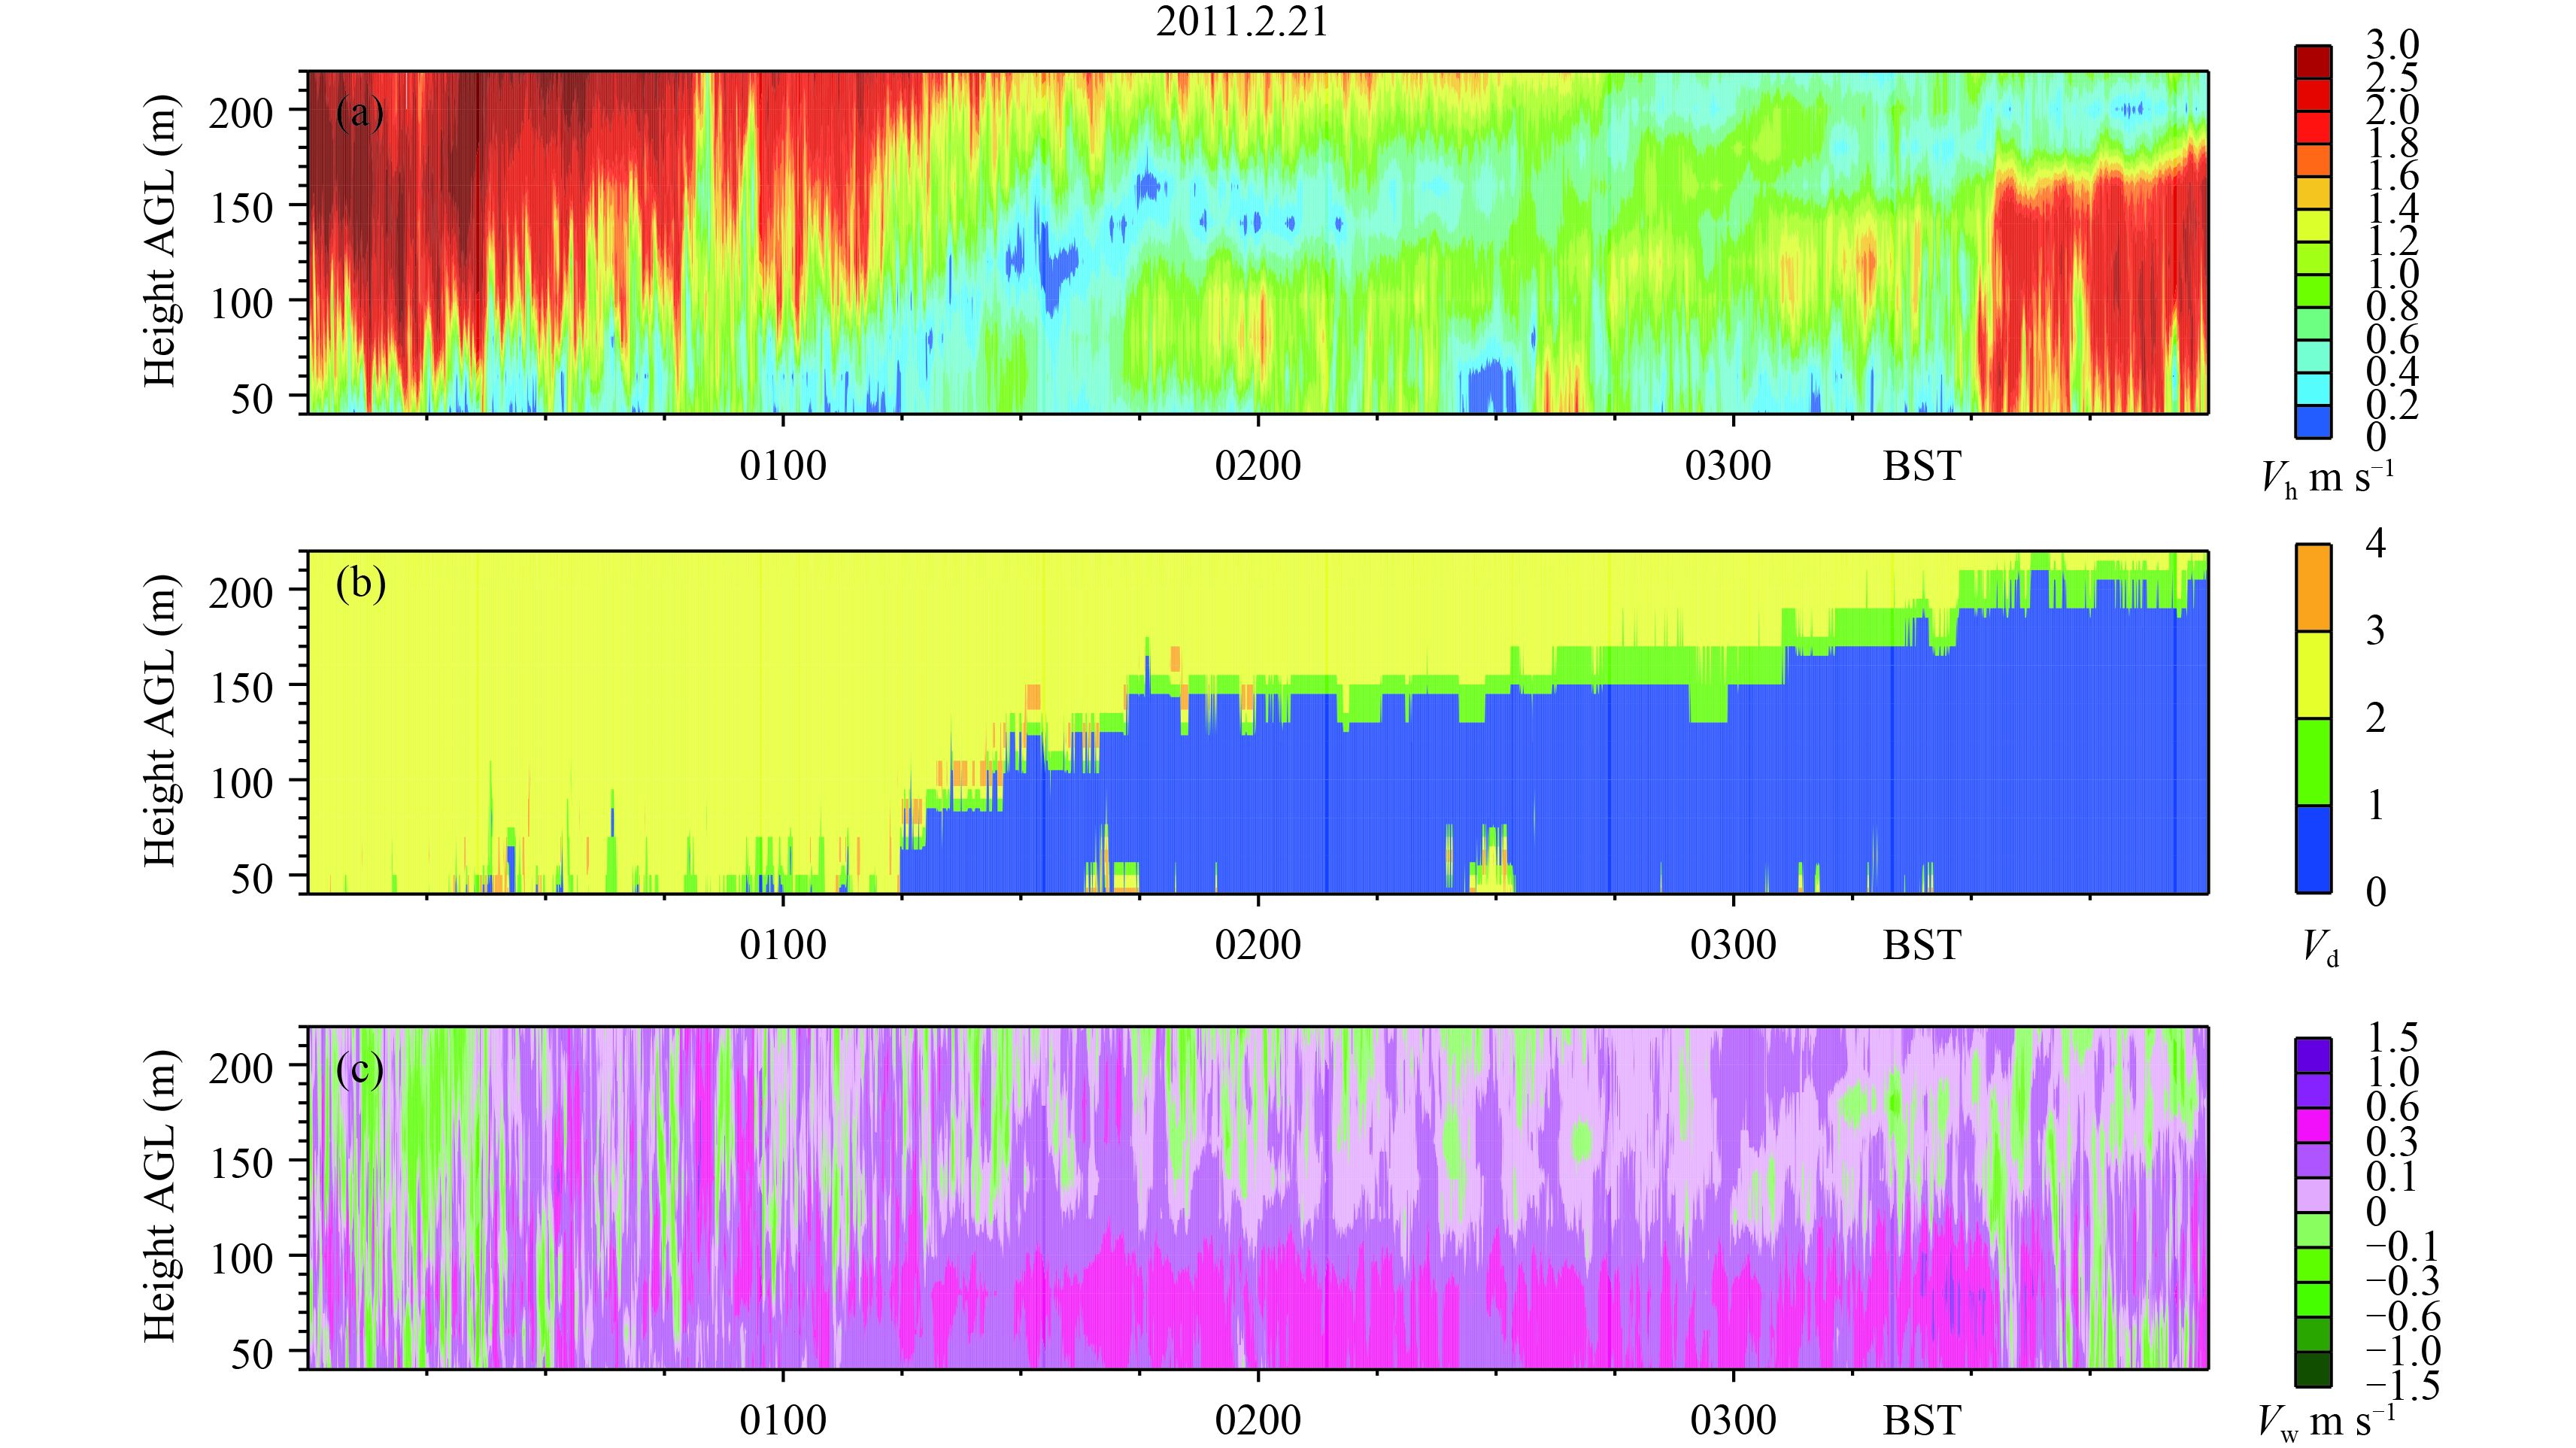
High-frequency wind profile data (4 s) were used to represent the spatiotemporal characteristics of the winds during evening transition (Figs. 6, 7). To better highlight the structure of the shear layer, we plotted four types of horizontal wind direction. The blue color denotes the wind direction within 292.5°–360° and 0°–67.5° (northerly wind), whereas the yellow color denotes 112.5°–247.5° (southerly wind), and the two other colors denote the transition between the northerly and southerly winds.
|
| Figure 6 Winds measured by the Windcube-8 on the night of 20 February 2011 (Vh is the horizontal wind speed; Vd is the wind direction, with that of 292.5°–360° and 0°–67.5° being 0–1 (northerly wind), and that of 112.5°–247.5° being 2–3 (southerly wind); and Vw is vertical wind, with negative values meaning downdraft). |
|
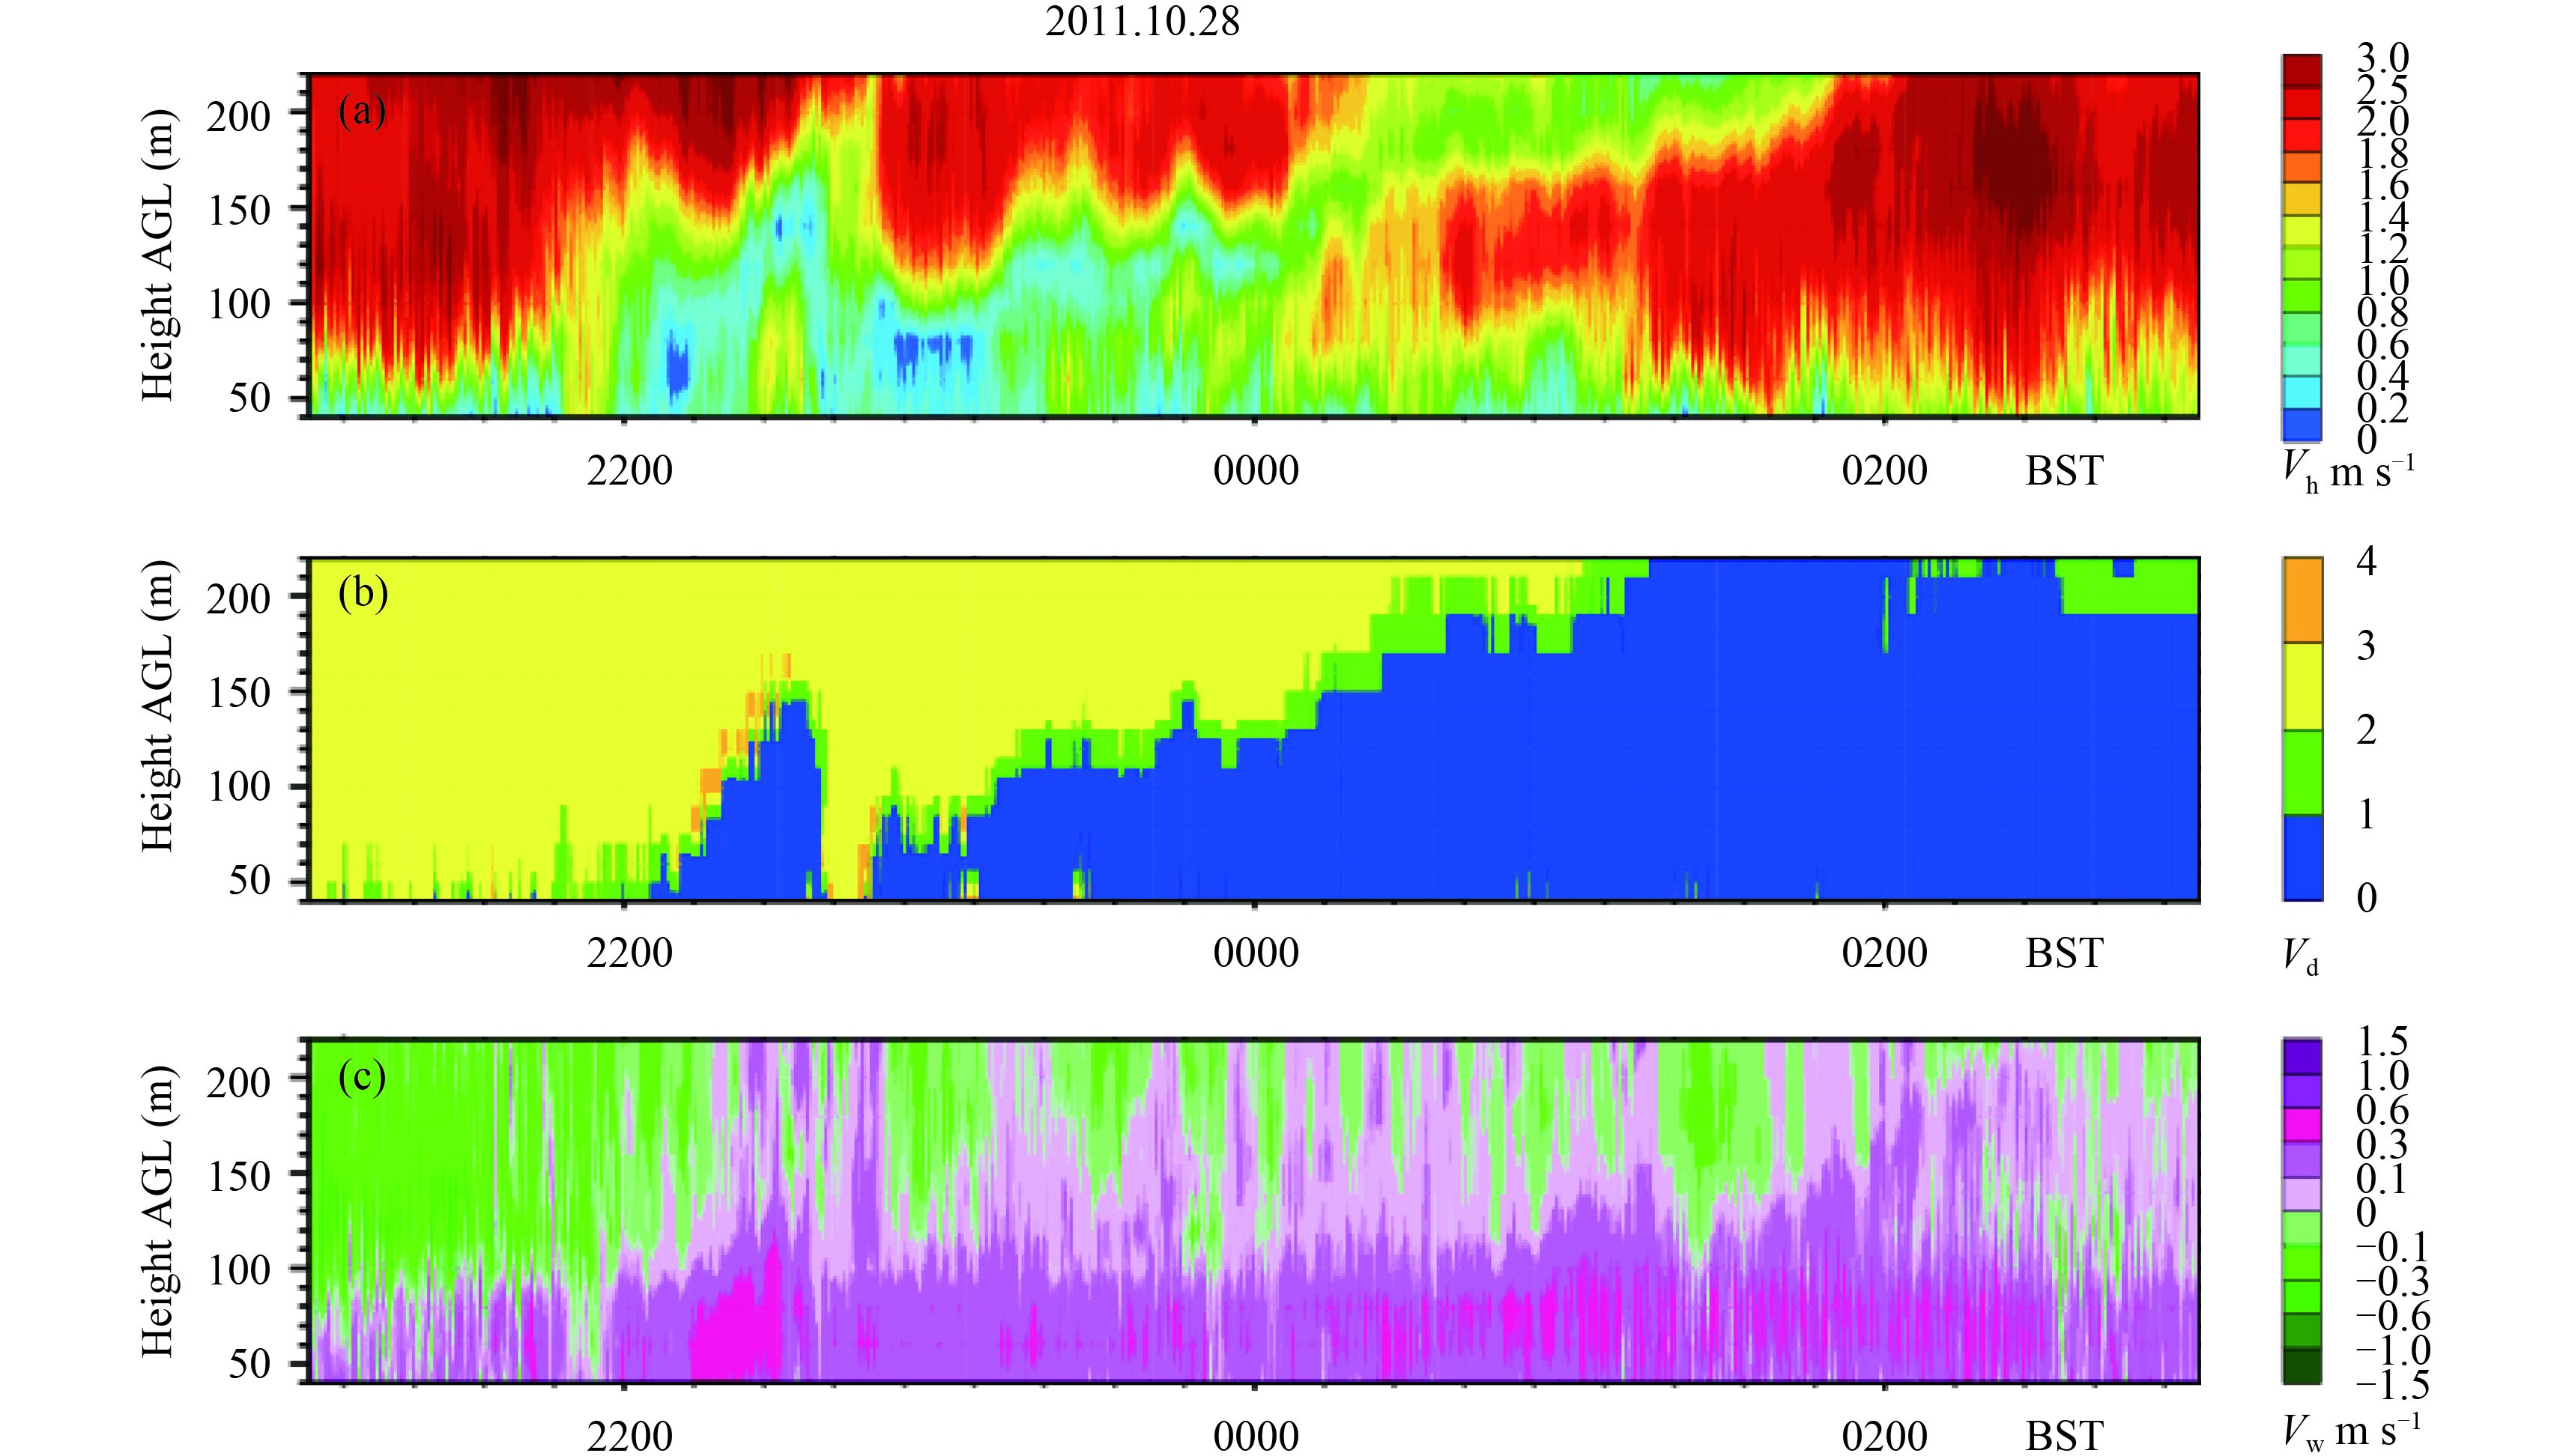
| Figure 7 As in Fig. 6, but for the night of 28 October 2011. |
In the night of 20 February, there was considerable directional shear in the wind profile. Beginning at approximately 0130 BST, winds at the lowest levels shifted to the northwest (down-valley), and the directional shear height gradually increased to 220 m within 2.5 h (Fig. 6b). The mean wind speed at 80 m was low (0.97 m s–1), and a zero horizontal-wind-speed zone could be found in the time–height cross-section along the wind shear line, with a zigzagged horizontal wind speed in a southern flow at a high level (Fig. 6a). After the transition, the wind speed at 40–220 m increased from 1 to 2 m s–1. Moreover, an updraft was observed during the transition period (Fig. 6c). For the other four events listed in Table 4, the wind characteristics (e.g., wind direction shear and mean wind speed) were similar to those of the events in the night of 20 February (Table 4).
The strong shear associated with the strengthening down-valley flow and the large difference in the densities between the surface-based inversion layer and the residual-layer air aloft, resulted in ideal conditions for the formation and propagation of K–H waves (Pinto et al., 2006). In the transition of the night of 28 October, K–H wave activity was observed in the time–height cross-section of the horizontal wind speed between 2200 and 0000 BST for a period of approximately 30 min (Fig. 7a); and the vertical wind speed between 100 and 220 m also showed a periodic change (Fig. 7c). In addition, the down-valley (northwesterly) wind seemed to be discontinuous as the southerly flow took over the entire layer in approximately 10 min (Fig. 7b). The horizontal and vertical wind speeds at 160 and 80 m were chosen to represent the within- and below-K–H-wave zone, respectively.
The horizontal wind speed at 160 m presented a periodic change with a period of 30 min, and nearly every maximum of the horizontal wind speed lagged behind the maximum of the downdraft (Fig. 8a). However, the correlation between the horizontal and vertical wind speeds at 80 m was low (Fig. 8b). The K–H gravity wave caused by the mountain–plain wind was also observed in Beijing in the summer and featured a maximum updraft, which always occurs earlier at a high level before the maximum of the horizontal wind speed exists (Zhu et al., 1985). Our observation (Figs. 7a, c) also shows the same pattern as the result of Zhu et al. (1985), which suggests that the evening transition wave on 28 October was the K–H gravity wave.

|
| Figure 8 The vertical (Vw) and horizontal (Vh) wind speeds measured by the Windcube-8 at 80 and 160 m during the evening transition on 28 October 2011 (using a 10-min moving average for 4-s raw data). |
K–H waves can be generated by the wind shear at night: the laminar flows become unstable under the action of the wind shear leading the formation of the K–H wave at the levels where the bulk Richardson number, Rib, becomes smaller than a certain critical value, Rc. The Rib is defined as
| ${\rm{R}}{{\rm{i}}_{\rm{b}}} = \frac{{g\Delta {\theta _{\rm v} }\Delta z}}{{{{\overline \theta }_{\rm v} }}}[{(\Delta u)^2} + {(\Delta v)^2}],$ | (1) |
where g is the acceleration due to gravity and △z is the height difference;

|
| Figure 9 The temporal evolution of the 10-min averaged bulk Richardson number (Rib) measured by the tower sensor between 180 and 140 m during the evening transition on 28 October 2011. The dashed lines correspond to Rib = 0 and Rib = 0.25. |
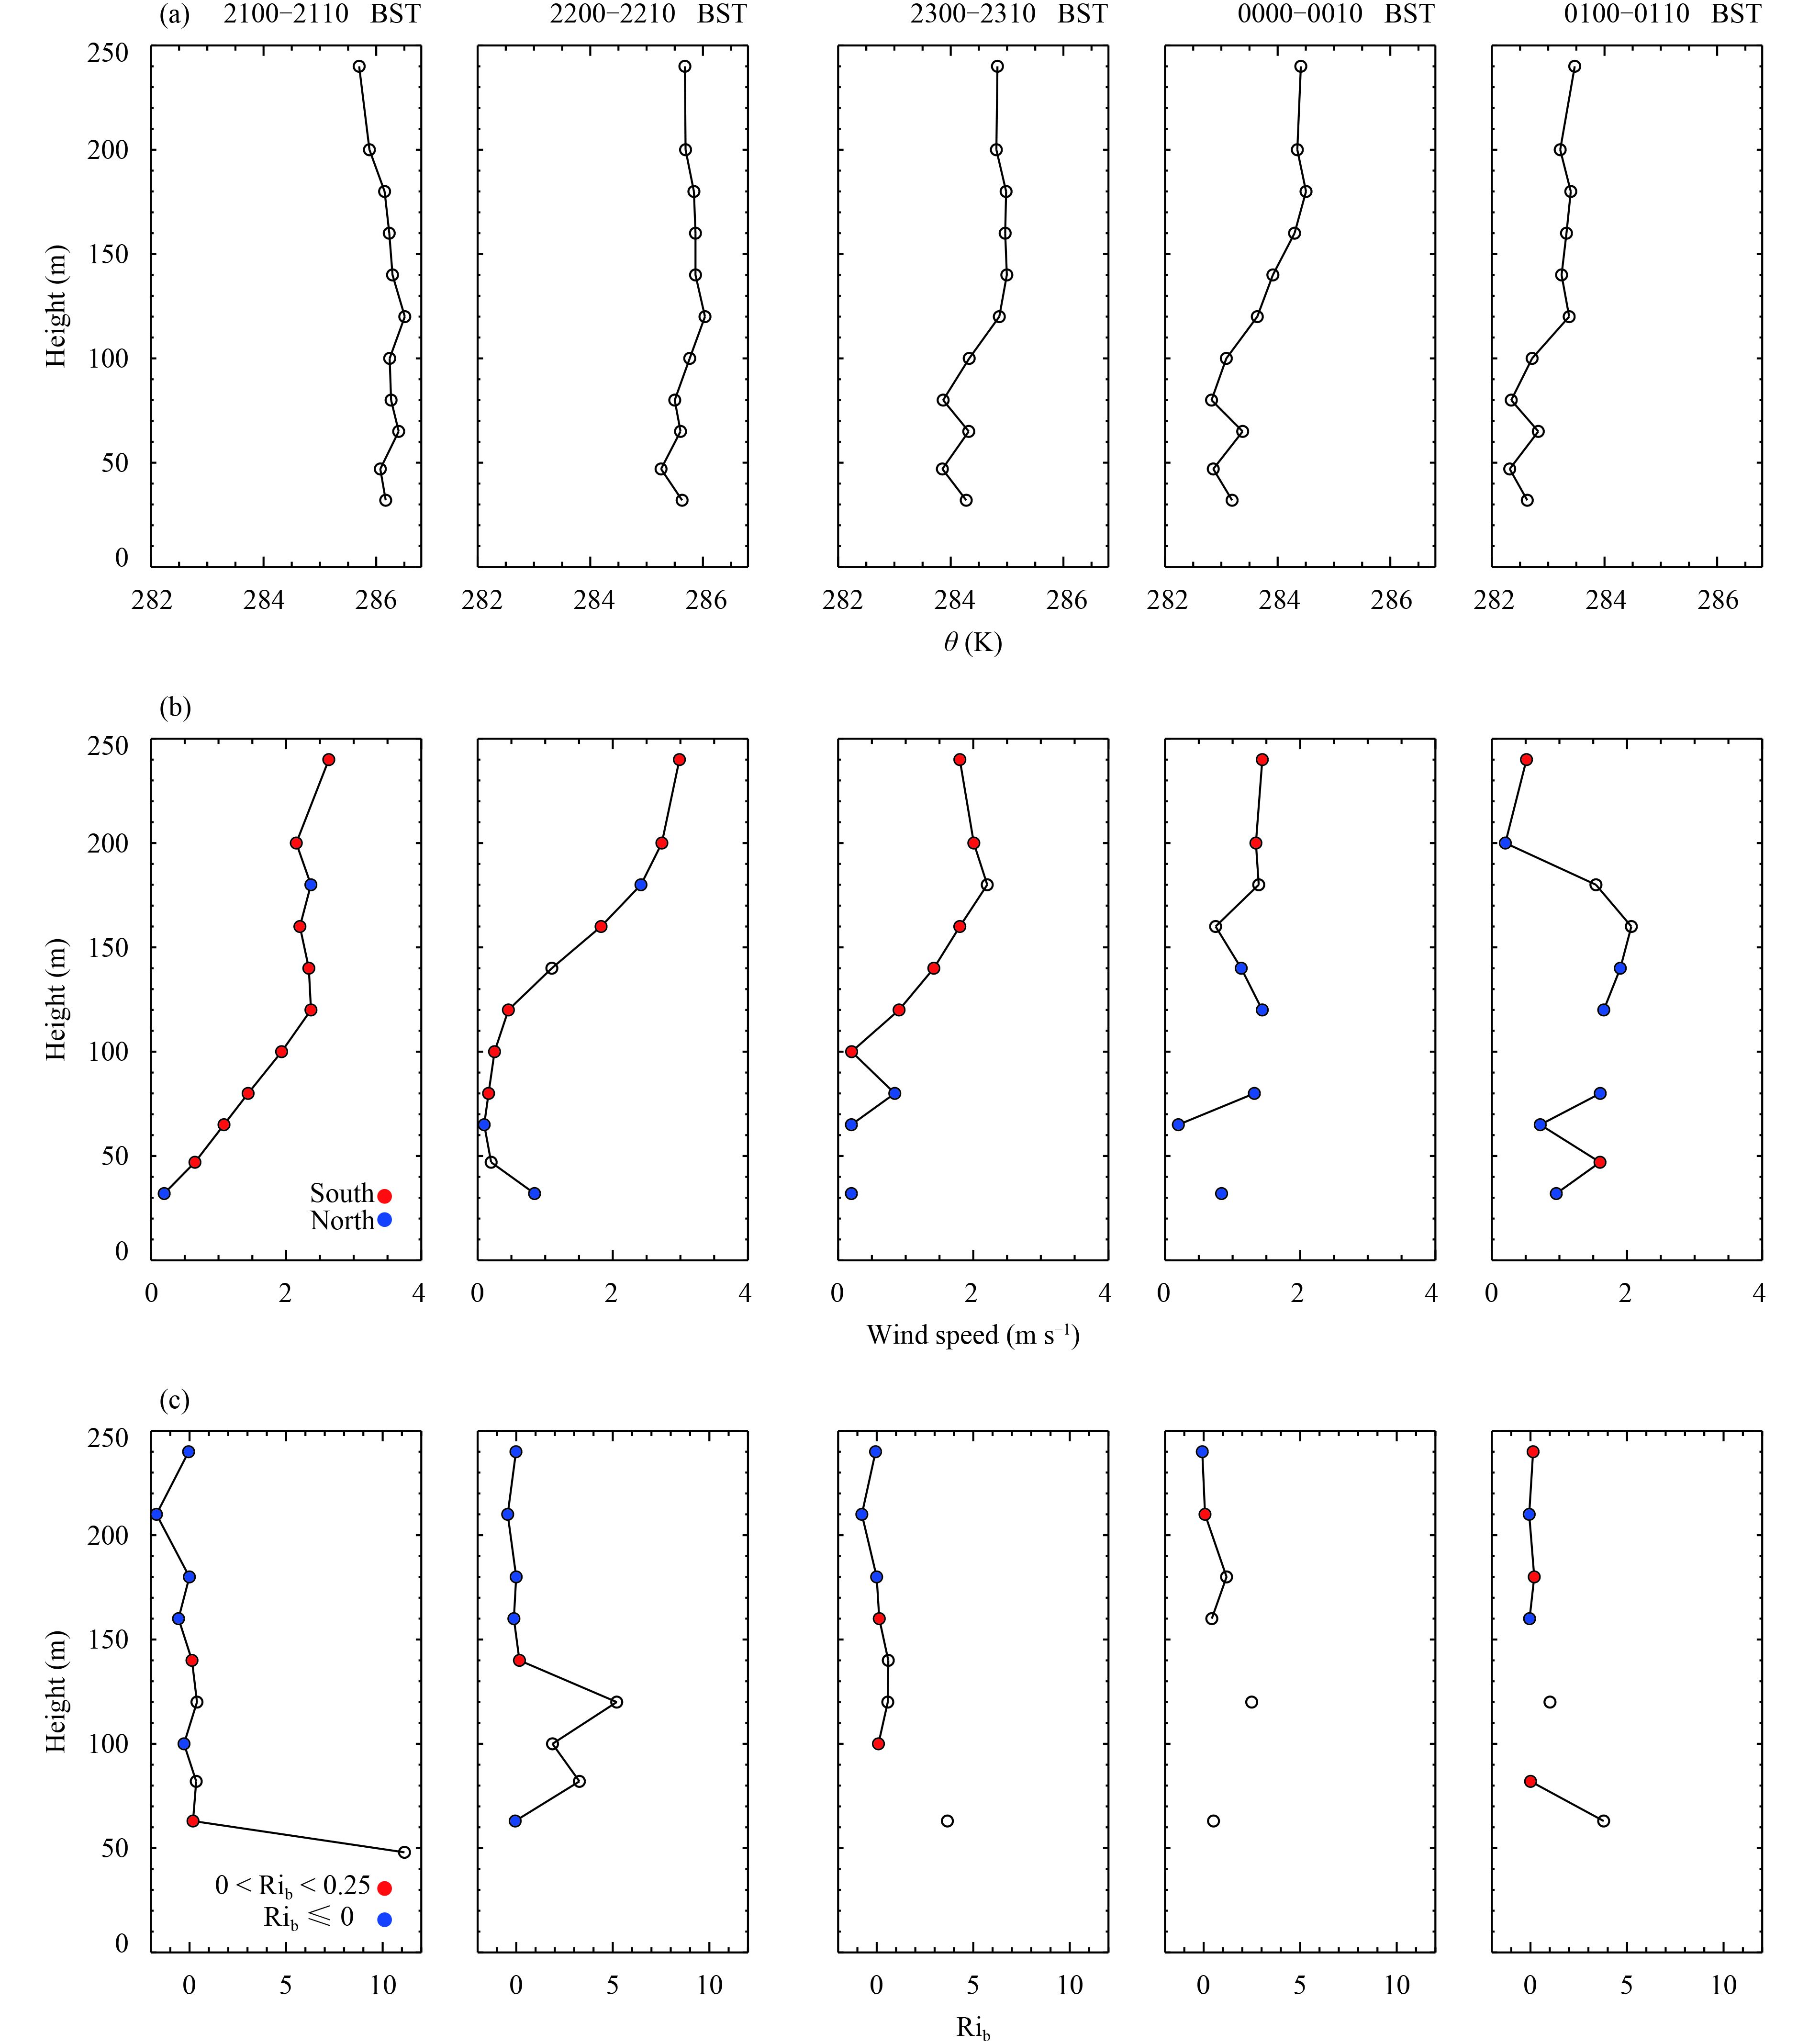
Figure 10 shows the 10-min mean profiles of θv, wind, and
|
|
Figure 10 The 10-min averaged profile of the (a) virtual potential temperature (θv), (b) wind speed, and (c) bulk Richardson number (
|
Aerosol particles near the mountains can change rapidly during evening transition due to a shift in wind direction. The CNR measured by the Windcube-8 could be a good index for the tendency of aerosol particles. Figure 11 presents a time series of the CNRs and wind direction at 80 and 200 m for the events on the nights of 20 February, and 18 and 19 October. The CNRs at both heights rose as the corresponding wind direction shifted to the north, whereas the start time at 200 m was relatively later than that at 80 m. The CNRs at both heights decreased gradually to a low level when the mountain wind began, whereas the decreasing magnitude at 200 m was different in different events, which is in agreement with the 2-m observations reported in Fernando et al. (2013). This may be caused by the vertical entrainment or the horizontal advection of the aerosols transported to the foot of the mountain in daytime (Ren et al., 2004; Fernando et al., 2013).
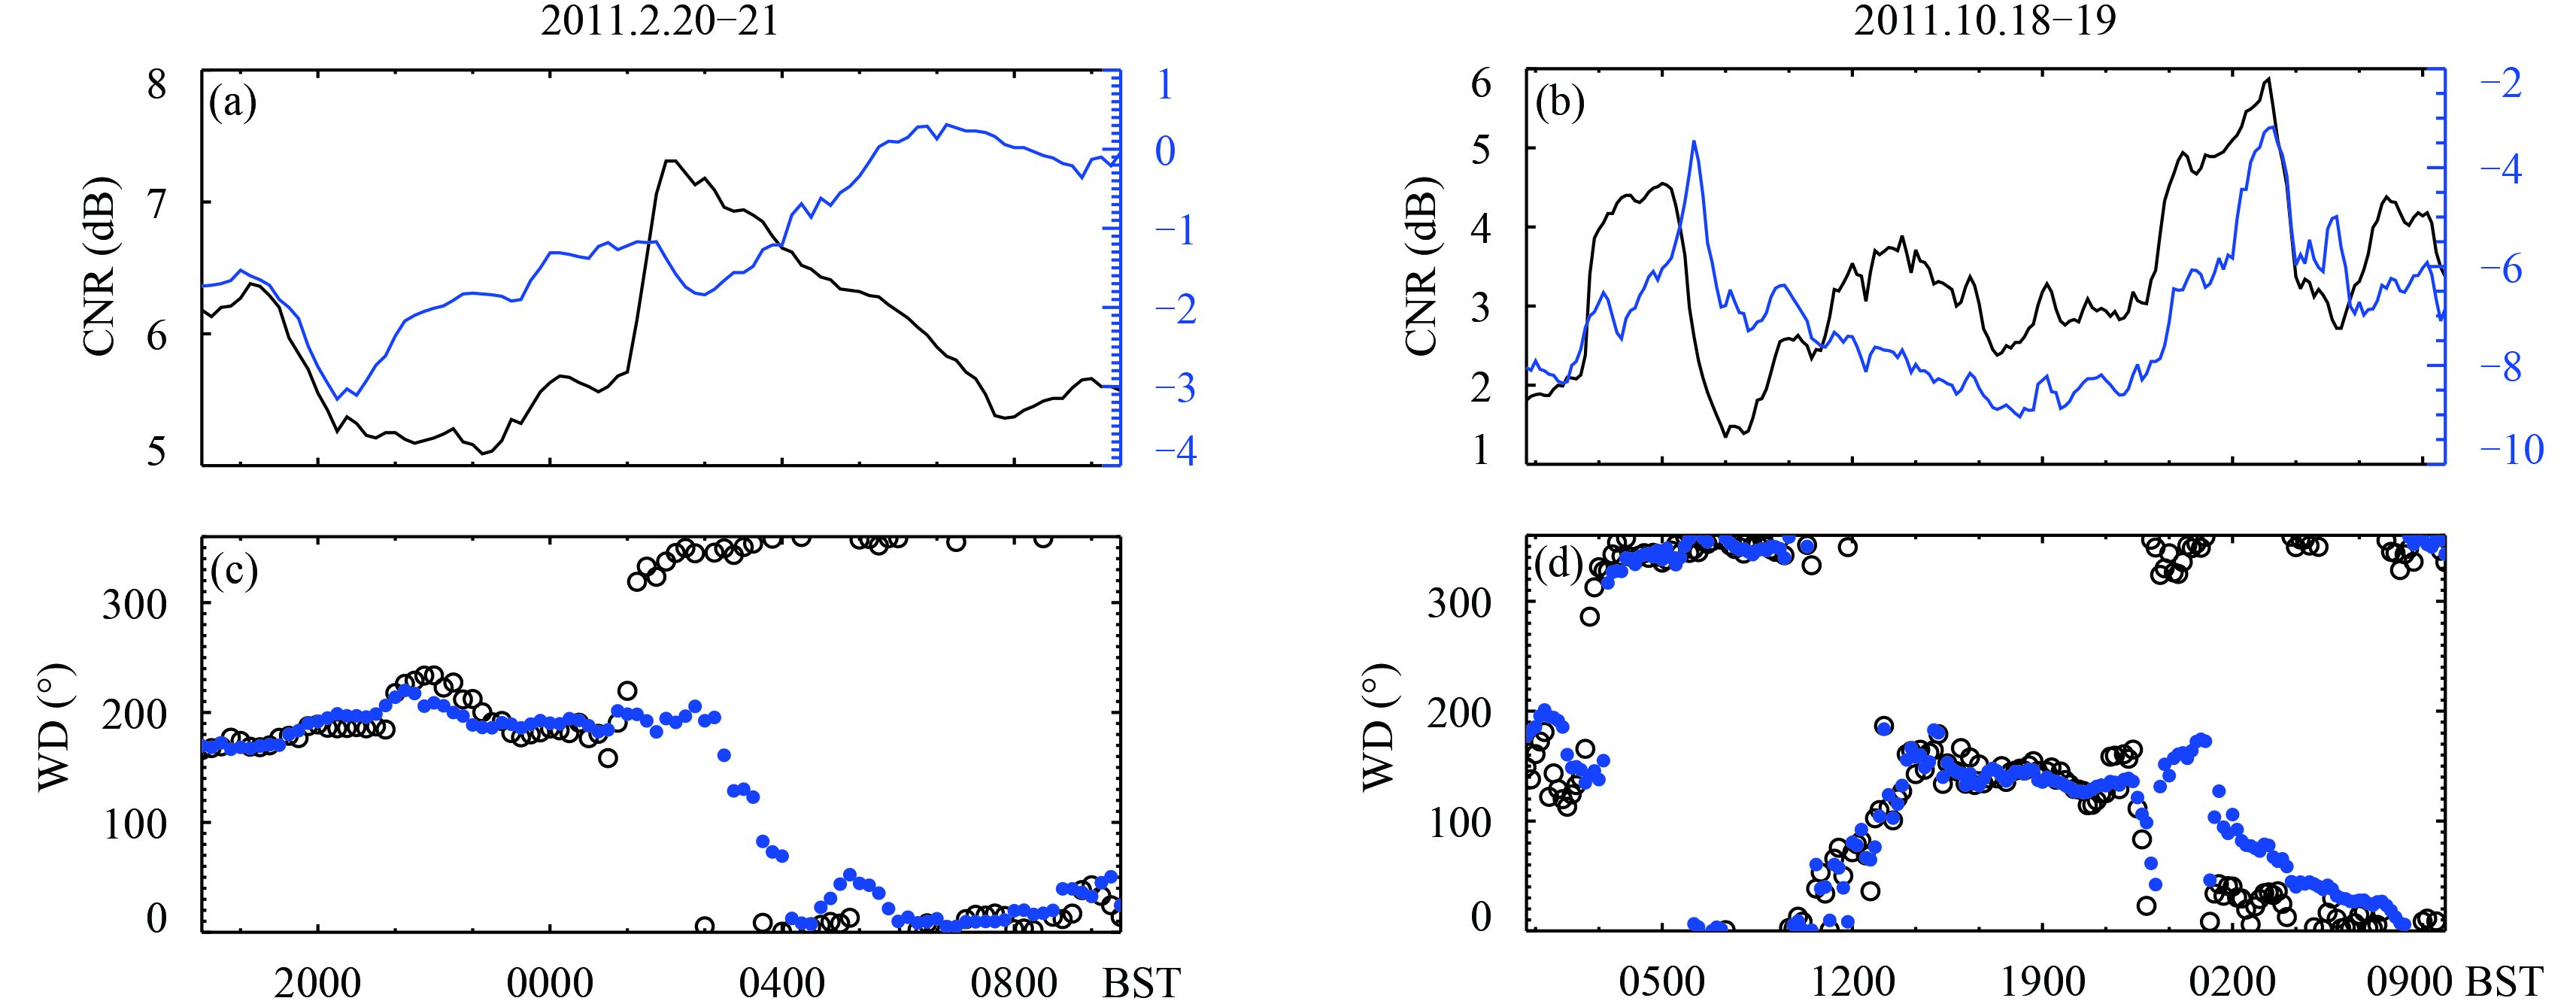
|
| Figure 11 The CNRs (carrier-to-noise ratios) and wind direction measured by the Windcube-8 at 80 (black) and 200 m (blue). |
The CNRs of a lidar are expected to be influenced by aerosol backscatter, atmospheric refractive turbulence, humidity, and precipitation. During weak turbulence and dry conditions (RH < 80 %), the CNRs of a lidar are highly correlated to particle concentrations in the lowest part of the atmospheric boundary layer (Aitken et al., 2012). A long time series (29 h) of in-situ PM1 measured by the ACSM and the CNRs of the Windcube-8 at 260 m is shown in Fig. 12. The CNRs indicate an overall similar trend with PM1 mass concentrations (Fig. 12) and show an R2 value of 0.93 and a polynomial curve fitting equation of

|
| Figure 12 Time series of in-situ PM1 measured by the ACSM (aerosol chemical speciation monitor) and the CNR (carrier-to-noise ratio) measured by the Windcube-8 (0300–0800 BST 21–22 December 2013). |

|
| Figure 13 Scatter plots of the in–situ PM1 measured by the ACSM (aerosol chemical speciation monitor) and the CNRs (carrier-to-noise ratios) measured by the Windcube-8 at (a) 260 and (b) 240 m, without dust events, and (c) the estimated PM1 mass concentrations at 260 m [using the fitting function in (b) and the CNRs measured by the Windcube-8] and in-situ PM1 measured by the ACSM. |
It is important to note that the CNRs at each level are related to the range-dependent collection efficiency of the Windcube-8; therefore, a direct comparison of the CNRs at each level is infeasible (Aitken et al., 2012).
To test whether PM1 concentrations can be estimated by the Windcube-8 CNRs, the fitting relationship of
The wind speed and direction measured over six months by a Doppler wind lidar (Windcube-8), compared with that measured by tower sensors, indicated that the 10-min averaged wind speed and direction were highly consistent from 80 to 200 m above the ground. Five evening transitions characterized by wind direction shear were chosen based on the Windcube-8 wind profiles and analyzed together with the 1-h mesoscale surface weather chart and PM1 concentrations measured by an ACSM. The results showed that: (1) the main mesoscale weather system over the NCP characterized by low-level wind direction shear is a closed mesoscale low pressure system, and each of two cases from the selected five cases featured similar low pressure; (2) the duration of evening transition was 1–3 h, and the corresponding averaged wind speed at 80 m was maintained at 1 m s–1; (3) there was a zero horizontal-wind-speed zone along the wind direction shear line, and the wind speed was characterized by a K–H gravity wave in one case; and (4) the variability of PM1 concentrations at a certain height above the ground could be captured by the Windcube-8 CNRs.
This study provides insights into the wind direction shear during evening transition and the potential to capture the variability of low-level PM/smog by wind lidar. However, a certain amount of uncertainty exists in the observational results, possibly due to the frictional and rounding effect on flows caused by the 70–90–m tall buildings located to the south of the site, especially for the southerly wind below 80 m. Nevertheless, considering that the wind direction shear line gradually evolves from 40 to 220 m, the observations above 80 m can still be representative of the transition mountain–plain wind shear in Beijing. Future work based on urban and suburban observations will help obtain further understanding of the low-level wind shear for mountain–plain wind. Future studies should also analyze the variability of low-level PM during heavy pollution events, using the Windcube-8 CNRs.
Acknowledgments . We are sincerely thankful to senior engineer Aiguo Li from the Institute of Atmospheric Physics and senior engineer Mingsheng Sun from the Air Force Meteorological Center of Beijng Military Command for providing the data of the 325-m Beijing meteorological tower and mesoscale surface weather charts. We thank Professor Zhongxiang Hong from the Institute of Atmospheric Physics for his valuable suggestions relating to the wind direction comparisons. We would also like to thank the two anonymous reviewers for key suggestions that helped improve the original manuscript.
| Aitken L., Rhodes M. E., Lundquist M. J. K., 2012: Performance of a wind-profiling lidar in the region of wind turbine rotor disks. J. Atmos. Oceanic Technol., 29, 347–355. DOI:10.1175/JTECH-D-11-00033.1 |
| Alexrova O. A., Boyer D. L., Anderson J. R., et al., 2003: The influence of thermally driven circulation on PM10 concentration in the Salt Lake valley . Atmos. Environ., 37, 421–437. DOI:10.1016/S1352-2310(02)00803-8 |
| Al-Jiboori M. H., Fei H., 2005: Surface roughness around a 325-m meteorological tower and its effect on urban turbulence. Adv. Atmos. Sci., 22, 595–605. DOI:10.1007/BF02918491 |
| Charles, L. A., S. Chaw, V. Vladutescu, et al., 2007: Application of CCNY lidar and ceilometers to the study of aerosol transport and PM2.5 monitoring. Extended Abstracts, Third Symp. on Lidar Atmospheric Applications. San Antonio, TX, Amer. Meteor. Soc., P1.14. |
| Chen C., Sun Y. L., Xu W. Q., et al., 2015: Characteristics and sources of submicron aerosols above the urban canopy (260 m) in Beijing, China, during the 2014 APEC summit. Atmos. Chem. Phys., 15, 12879–12895. DOI:10.5194/acp-15-12879-2015 |
| Cheng X. L., Hu F., Zeng Q. C., et al., 2014: Numerical simulation of effect of 325-m meteorological tower on wind speed measurements in Beijing. Meteor. Sci. & Tech., 42, 545–549. |
| Chintawongvanich P., Olsen R., Biltoft C. A., 1989: Intercomparison of wind measurements from two acoustic doppler sodars, a laser doppler lidar, and in situ sensors. J. Atmos. Oceanic Technol., 6, 785–797. DOI:10.1175/1520-0426(1989)006<0785:IOWMFT>2.0.CO;2 |
| Dabberdt W. F., 1968: Tower-induced errors in wind profile measurements. J. Appl. Meteor., 7, 359–366. DOI:10.1175/1520-0450(1968)007<0359:TIEIWP>2.0.CO;2 |
| Dou J. J., Wang Y. C., Miao S. G., 2014: Fine spatial and temporal characteristics of humidity and wind in Beijing urban area. J. Appl. Meteor. Sci., 25, 559–569. |
| Fernando S., Verhoef H., Di Sabatino B., et al., 2013: The Phoenix Evening Transition Flow Experiment (TRANSFLEX). Bound.-Layer Meteor., 147, 443–468. DOI:10.1007/s10546-012-9795-5 |
| Fernando H. J. S., Pardyjak E. R., Di Sabatino S., et al., 2015: The MATERHORN: Unraveling the intricacies of mountain weather. Bull. Amer. Meteor. Soc., 96, 1945–1967. DOI:10.1175/BAMS-D-13-00131.1 |
| Lee S.-M., Ferno H. S., Princevac M., et al., 2003: Transport and diffusion of ozone in the nocturnal and morning planetary boundary layer of the Phoenix valley. Environmental Fluid Mechanics, 3, 331–362. DOI:10.1023/A:1023680216173 |
| Li H. Z., 1991: The main mesoscale system over the North China Plain. Meteor. Mon., 17, 40–44. |
| Li Y. Y., Qu S. H., Zhou M. Y., 1982: Analysis of flow fields in Beijing area. Acta Scientiae Circumstantiae, 2, 351–357. |
| Liu R. C., Li H. Z., Li R. H., 1983: Certain facts about the mesoscale low over the North China Plains. Chinese J. Atmos. Sci., 7, 78–87. |
| Lyons W. A., Olsson L. E., 1973: Detailed mesometeorological studies of air pollution dispersion in the Chicago Lake breeze. Mon. Wea. Rev., 101, 387–403. DOI:10.1175/1520-0493(1973)101<0387:DMSOAP>2.3.CO;2 |
| Moroz W. J., 1967: A lake breeze on the eastern shore of Lake Michigan: Observations and model. J. Atmos. Sci., 24, 337–355. DOI:10.1175/1520-0469(1967)024<0337:ALBOTE>2.0.CO;2 |
| Münkel C., Eresmaa N., Räsänen J., et al., 2007: Retrieval of mixing height and dust concentration with lidar ceilometer. Bound.-Layer Meteor., 124, 117–128. DOI:10.1007/s10546-006-9103-3 |
| Pardyjak E. R., Ferno H. J. S., Hunt J. C. R., et al., 2009: A case study of the development of nocturnal slope flows in a wide open valley and associated air quality implications. Meteorologische Zeitschrift, 18, 85–100. DOI:10.1127/0941-2948/2009/362 |
| Pinto J. O., Parsons D. B., Brown W. O. J., et al., 2006: Coevolution of down-valley flow and the nocturnal boundary layer in complex terrain. J. Appl. Meteor. Climatol., 45, 1429–1449. DOI:10.1175/JAM2412.1 |
| Ren Z. H., Wan B. T., Yu T., et al., 2004: Influence of weather system of different scales on pollution boundary layer and the transport in horizontal current field. Research of Environmental Sciences, 17, 7–13. |
| Shaw W. J., Christopher Doran J., Coulter R. L., 2005: Boundary-layer evolution over Phoenix, Arizona and the premature mixing of pollutants in the early morning. Atmos. Environ., 39, 773–786. DOI:10.1016/j.atmosenv.2004.08.055 |
| Stull, R. B., 1988:An Introduction to Boundary Layer Meteorologly. Kluwer Academic Publishers, Dordrecht, 670 pp. |
| Sun Y., Wang Z., Dong H., et al., 2012: Characterization of summer organic and inorganic aerosols in Beijing, China with an Aerosol Chemical Speciation Monitor. Atmos. Environ., 51, 250–259. DOI:10.1016/j.atmosenv.2012.01.013 |
| Sun Y., Du W., Wang Q., et al., 2015: Real-time characterization of aerosol particle composition above the urban canopy in Beijing: Insights into the interactions between the atmospheric boundary layer and aerosol chemistry. Environ. Sci. Technol., 49, 11340–11347. DOI:10.1021/acs.est.5b02373 |
| Sun Y., Wang Z., Wild O., et al., 2016: " APEC Blue”: Secondary aerosol reductions from emission controls in Beijing. Scientific Reports, 6, 20668. DOI:10.1038/srep20668 |
| Wang X. Q., Wang Z. F., Gong Y. B., et al., 2008: Modulation of urban heat island circulation on mountain–plain wind in the Beijing area. Climatic Environ. Res., 13, 639–644. |
| Xia J. R., Wang P. C., Min M., 2011: Observation and validation of wind parameters measured by Doppler wind lidar Windcube. Climatic Environ. Res., 16, 733–741. |
| Zhu C. J., Ye Z. J., Duan B. Z., et al., 1982: Characteristics of local circulation and aerosol distribution over Beijing–Tianjin area during autumn and winter. Acta Scientiae Circumstantiae, 2, 342–350. |
| Zhu C. J., Li X. S., Ye Z. J., 1985: The effect of the Kelvin–Helmholtz wave on precipitation in the atmospheric boundary layer. Chinese J. Atmos. Sci., 9, 156–162. |
 2017, Vol. 31


