The Chinese Meteorological Society
Article Information
- Hui LI, Panmao ZHAI, Er LU, Wei ZHAO, Yang CHEN, Huan WANG . 2017.
- Changes in Temporal Concentration Property of Summer Precipitation in China during 1961–2010 Based on a New Index. 2017.
- J. Meteor. Res., 31(2): 336-349
- http://dx.doi.org/10.1007/s13351-017-6020-y
Article History
- Received February 26, 2016
- in final form October 27, 2016
2. Chinese Academy of Meteorological Sciences, Beijing 100081
Global climate warming is closely related to changes in the hydrologic cycle (Bates et al., 2008), which is critical for both the biosphere and human societies. As a specific representative of the changing hydrologic cycle, precipitation extremes have been more frequently observed and recorded (Roy et al., 2004; Zolina et al., 2010). Precipitation extremes, in turn, may result in more uneven spatial and temporal distributions of precipitation (Groisman et al., 1999; Ziegler et al., 2003; Zhang et al., 2010). Due to the important influences of precipitation extremes on the hydrologic cycle, many studies focused on changes in precipitation extremes in various regions, such as America (Kunkel, 2003; Vincent et al., 2005; Aguilar et al., 2009), Canada (Zhang et al., 2001), Europe (Hundecha and Bárdossy, 2005; Schmidli and Frei, 2005), and Asia (Zhai et al., 2005; Tank et al., 2006; Deni et al., 2008; Zin and Jemain, 2010).
In addition to precipitation extremes, a number of existing studies have focused on changes in precipitation totals, wet days, and wet spells (Peterson et al., 2002; Brown et al., 2010; Gemmer et al., 2011). In Europe, a meridional pattern of precipitation totals was detected with a positive trend in the north and a negative trend in the south (Forland et al., 1996; Schonwiese and Rapp, 1997). In the United States, precipitation has increased by about 10% across the contiguous United States. The increase in precipitation is reflected primarily in heavy and extreme daily precipitation events (Karl, 1998; Karl and Knight, 1998). In China, changes in precipitation totals are featured by significant decrease in North China and a sharp increase in the lower reaches of the Yangtze River basin and western China (Zhai et al., 1999). Bai et al. (2006) revealed significant decreases in wet spells over North, Central, and Southwest China. Recently, changes in the precipitation duration were also examined. For example, Zolina et al. (2010) reported that the duration of wet spells have lengthened significantly in Europe. Differently, Chen and Zhai (2013) found that a shortening trend in wet spells was obvious in Southwest China, where prolonged drought occurred more frequently in recent years.
Much attention has also been paid to changes in the intensity of precipitation (Groisman et al., 1999; Yin et al., 2009). For example, it has been reported that precipitation intensity increased in a spatially coherent fashion in northeastern USA and generally decreased in the central portion of western USA (Balling and Goodrich, 2011). For China as a whole, significant trends in annual precipitation totals were hardly detected, but distinctive trends may be found in different seasons over different regions (Zhai et al., 2005). Specifically, precipitation totals have increased in the northwest, and along the southern edge of the northeast and southern regions of China, but decreased in northeastern, northern, and southeastern parts of China (Endo et al., 2005; Zhai et al., 2005).
With the enhancement of the hydrological cycle, rainy days become more concentrated in some regions and precipitation amount during some concentrated periods of rainy days accounts for a larger portion of the annual total. Such periods usually consist of several days with intense precipitation. For example, a record-breaking heavy rainfall hit Beijing on 21 July 2012 with 460-mm precipitation pouring down within 18 h. This heavy rainfall event resulted in 79 casualties and a direct economic loss of 2 billion RMB (Zhang et al., 2013). Precipitation during this 18-h period accounted for 39.8% of the annual total in Beijing in 2012. Concentrated extreme precipitation has a great potential to cause severe disasters, especially in densely populated urban areas.
Compared with studies of precipitation frequency and intensity, whether the temporal distribution of precipitation in some areas has become more concentrated or dispersed has rarely been investigated. Statistically, the variance measures how far a set of (random) numbers are spread out from their mean, but it is usually applied to the normal distribution. However, time series of total precipitation always does not have a normal distribution (Groisman et al., 1999). To reveal the temporal property of precipitation concentration, Zhang and Qian (2003) defined an index called precipitation concentration degree (PCD). In recent years, some studies have used PCD to analyze the precipitation heterogeneity in climate (e.g., Liu et al., 2016). PCD ranges from 0 to 1 and can well reflect the annual non-uniform distribution of the total precipitation. A PCD closer to 1 indicates a more concentrated precipitation period. A PCD closer to 0 indicates a more uniform distribution of precipitation during the study period.
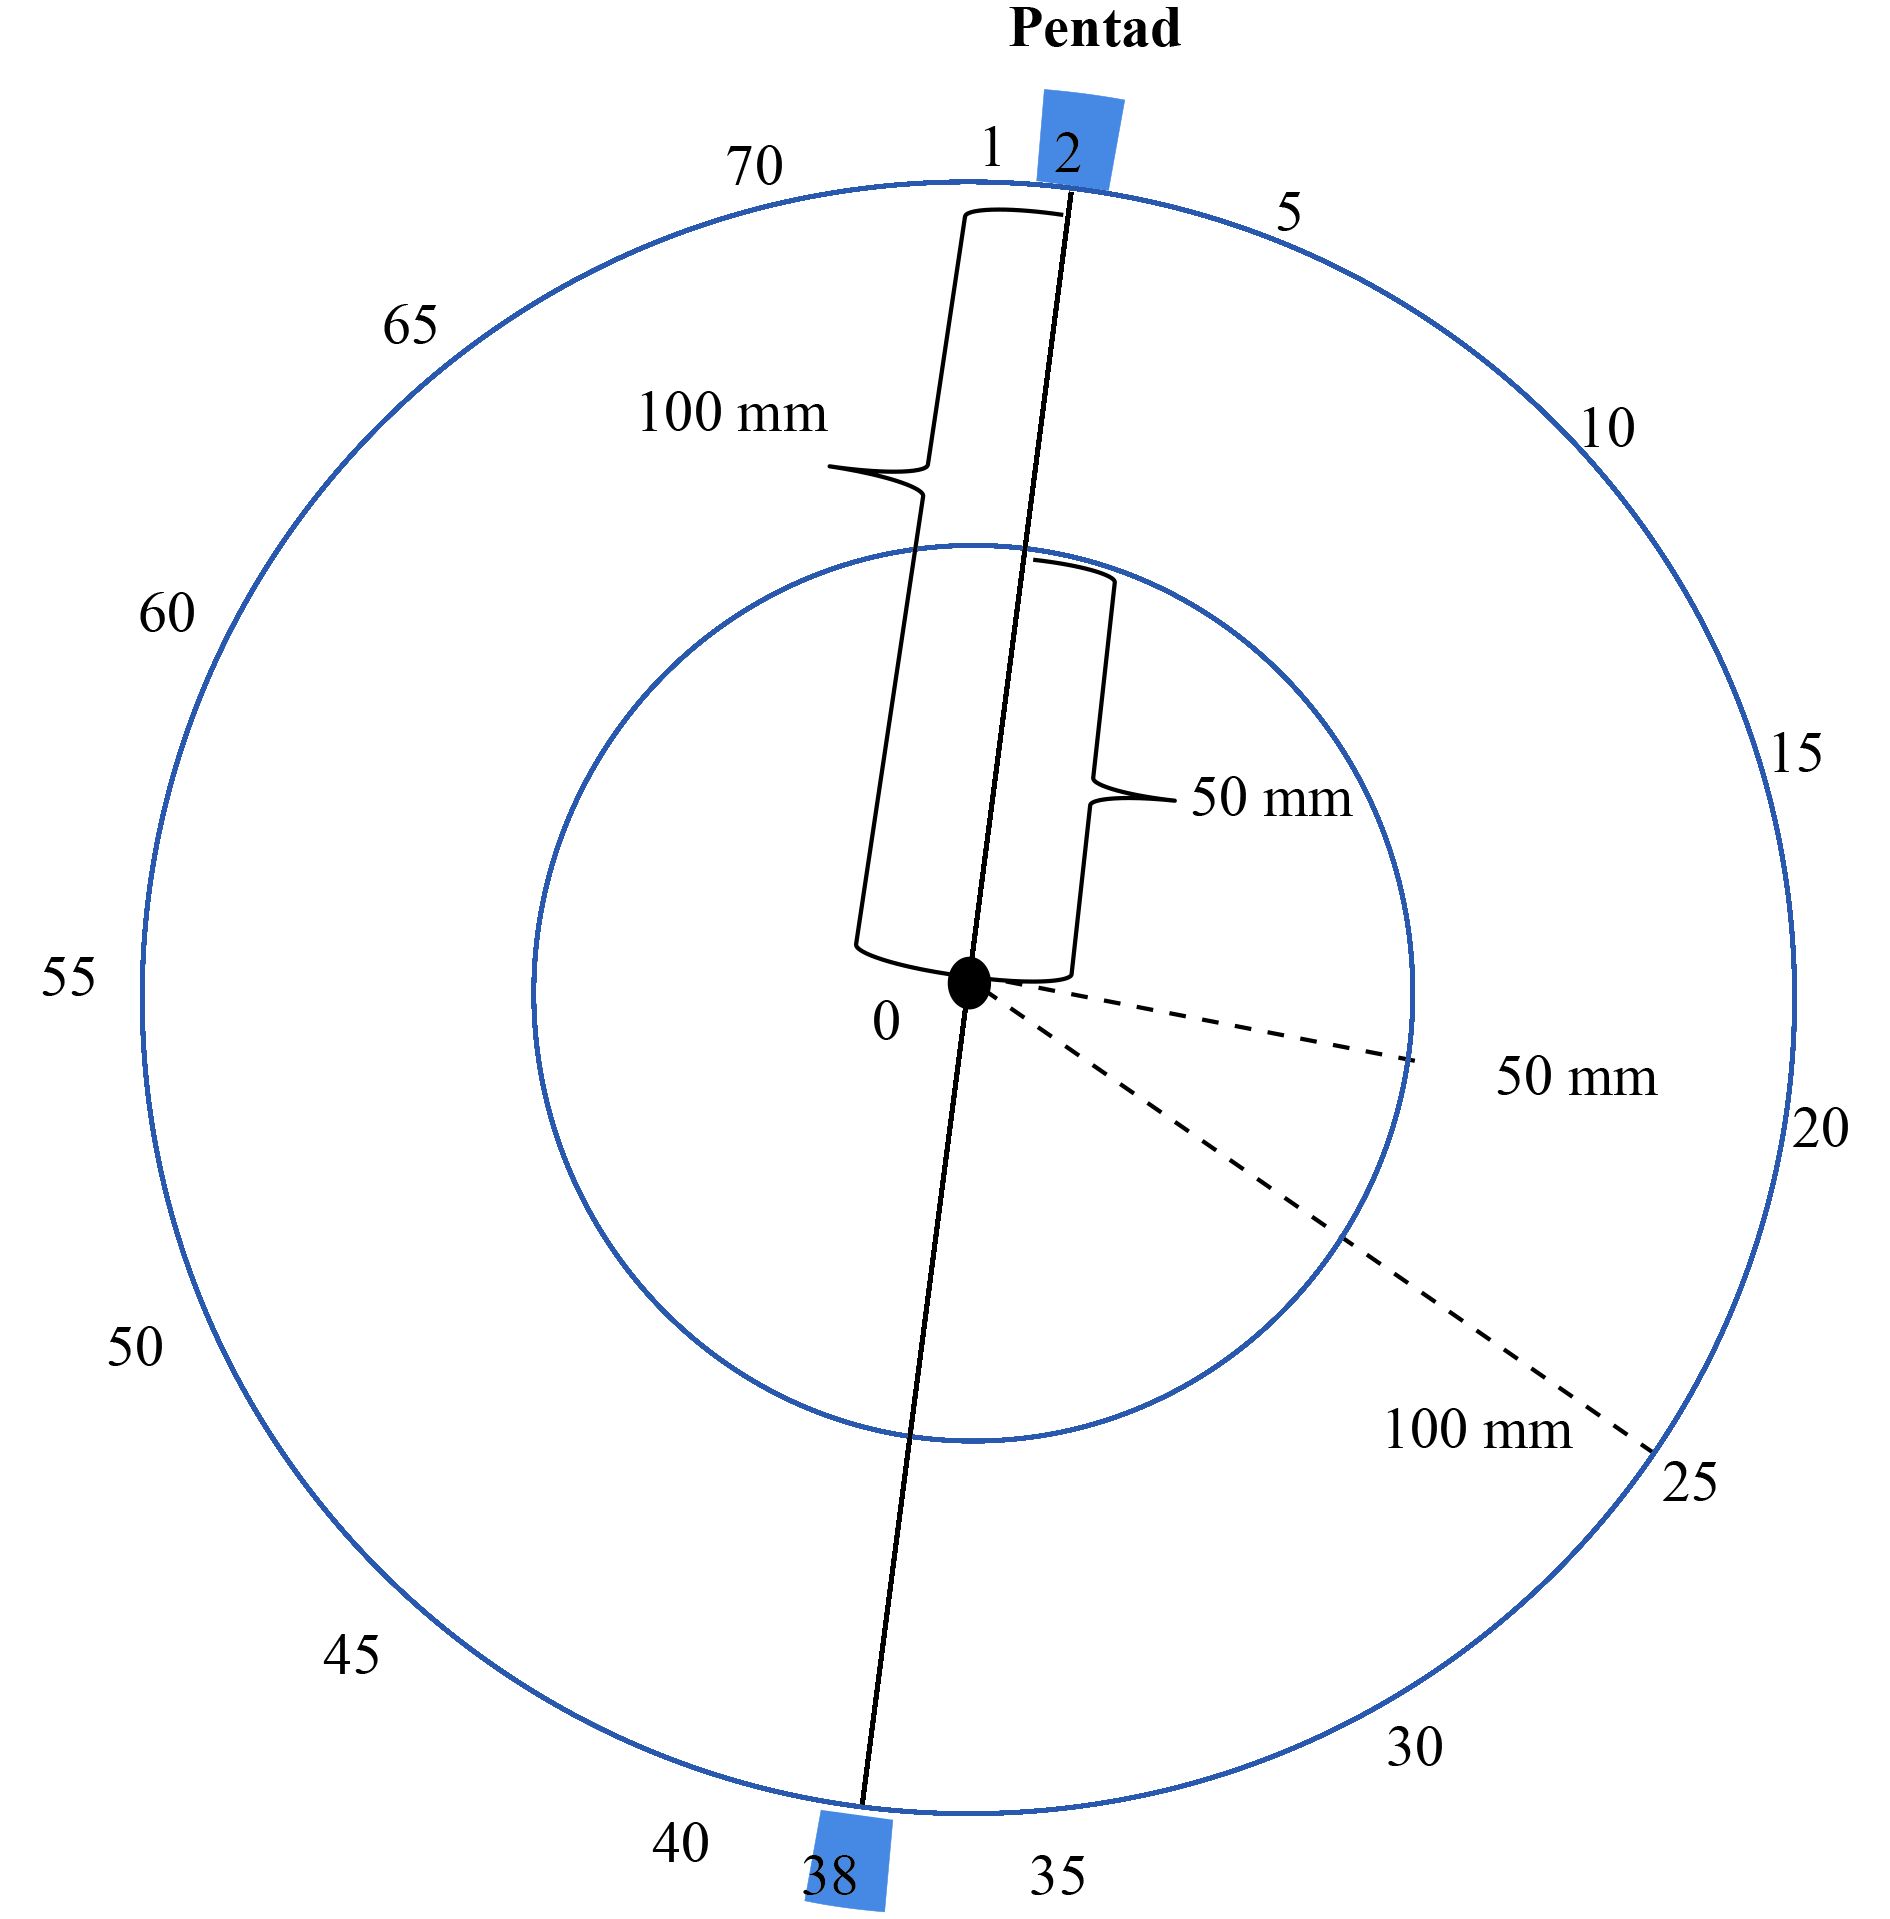
PCD is computed based on the vector analysis. Specifically, a circle (360°) represents a whole year, a pentad accounts for 5° of the circle, and the precipitation amount in a certain pentad can be measured by the length of the radius vector, and the corresponding pentad is denoted by the vector direction. The PCD (C) is defined as
|
| Figure 1 The distribution of the angle range of each pentad in a year (blue circles represent the precipitation amount; black lines represent the distribution of 100-mm precipitation in the 2nd and 38th pentads, respectively; the black dotted lines represent the distribution of 50- and 100-mm precipitation in the 20th and 25th pentads, respectively). |
To understand the precipitation process at a specific station (or region), we may use the annual or seasonal rainfall total as a measure to describe the precipitation property; we may also need to know whether the temporal distribution of rainfall is concentrated. In this study, a new refined index called the Q index, which is based on the property of entropy, is proposed to improve the delineation of precipitation concentration. Furthermore, the Q index is used to examine the change in the concentration of summer precipitation in China.
2 Theoretical framework for the Q indexAs indicated above, this study aims to establish a new method to describe the temporal concentration of daily precipitation. We use the concept of entropy (e.g., Shannon, 1948) to deduce a new index that is concerned of the precipitation concentration property. Entropy is a measure of unpredictability of information content and one of several ways to measure diversity. Actually, the concept of entropy has been widely employed in physics in evaluating uncertainties or variability in a random variable, while it is not necessary to consider the distribution pattern of the variable. Shannon (1948) defined the entropy H of a discrete random variable X with possible values x1, x2, …, xi
and probability mass function P(X) as:
The variable H(X) can be transformed as
| $H\!\left( X \right) = - \sum\limits_{i = 1}^n {\frac{1}{{\ln\! b}}\left[ {P\!\left( {{x_i}} \right) \cdot \ln\! P\left( {{x_i}} \right)} \right]} .$ |
Based on the concept of the Shannon entropy, the precipitation concentration property can be defined as
| $Q = 1 - H\!\left( X \right) = 1 + \sum\limits_{i = 1}^N {\frac{1}{{\ln \!{{N}}}}\left[ {P\!\left( {{x_i}} \right) \cdot \ln\! P\!\left( {{x_i}} \right)} \right]} ,$ | (1) |
where i and N is the order of the day. In this study, this definition is introduced to measure the temporal variabi-lity of daily precipitation during a year (summer, month, or pentad). In the following, we only consider the summer case instead of the case for the entire year, month, or pentad. Therefore, N = 92. A larger variability may imply that intense precipitation occurs in some isolated days or is concentrated within some specific periods. In contrast, a smaller variability suggests that the precipitation probably is more evenly distributed. Note that, different from the traditional definition of entropy, P(xi ) in Eq. (1) refers to the fractional contribution of daily precipitation to the summer total of a specific year, which is expressed as:
| $P\!\left( {{x_i}} \right) = \frac{{{R_i}}}{R},$ | (2) |
where Ri
is the amount of the daily precipitation.
Based on the property of entropy, the Q index is defined to reflect the degree of daily precipitation concentration for a certain amount of total precipitation during a specific period of time. This can be understood as follows (Table 1). When the Q index is low (close to 0), it implies that precipitation is dispersed into more rainy days. If total precipitation is large (small), a low value of Q indicates more wet spells (dry spells). When the Q index is high (close to 1), it indicates that precipitation is concentrated in a few rainy days. If total precipitation is large (small), a high value of Q implies more heavy rain days (dry spells).
| Precipitation structure | Wet or dry spell | |
| High Q + large R | Concentrated | More heavy rain days |
| High Q + small R | Concentrated | More dry spells |
| Low Q + large R | Dispersed | More wet spells |
| Low Q + small R | Dispersed | More dry spells |
The observed daily precipitation data from 553 stations over the Mainland China during the period 1961–2010 were used in this study. Observations collected at reference stations and basic stations were included in this dataset. The dataset is provided by the Climate Data Center (CDC) of the National Meteorological Information Center, China Meteorological Administration (CMA). The dataset has been subject to quality control conducted in the CDC (Zhai et al., 2005).
According to geographic divisions of meteorological conditions in China (Liu et al., 2015), the entire country is divided into 9 meteorological regions (see the map in Fig. 8), corresponding to basic administrative units of provinces. Considering the fact that precipitation in China is under strong influences of the summer monsoon, in this study we focused on precipitation in summer, including June, July, and August.
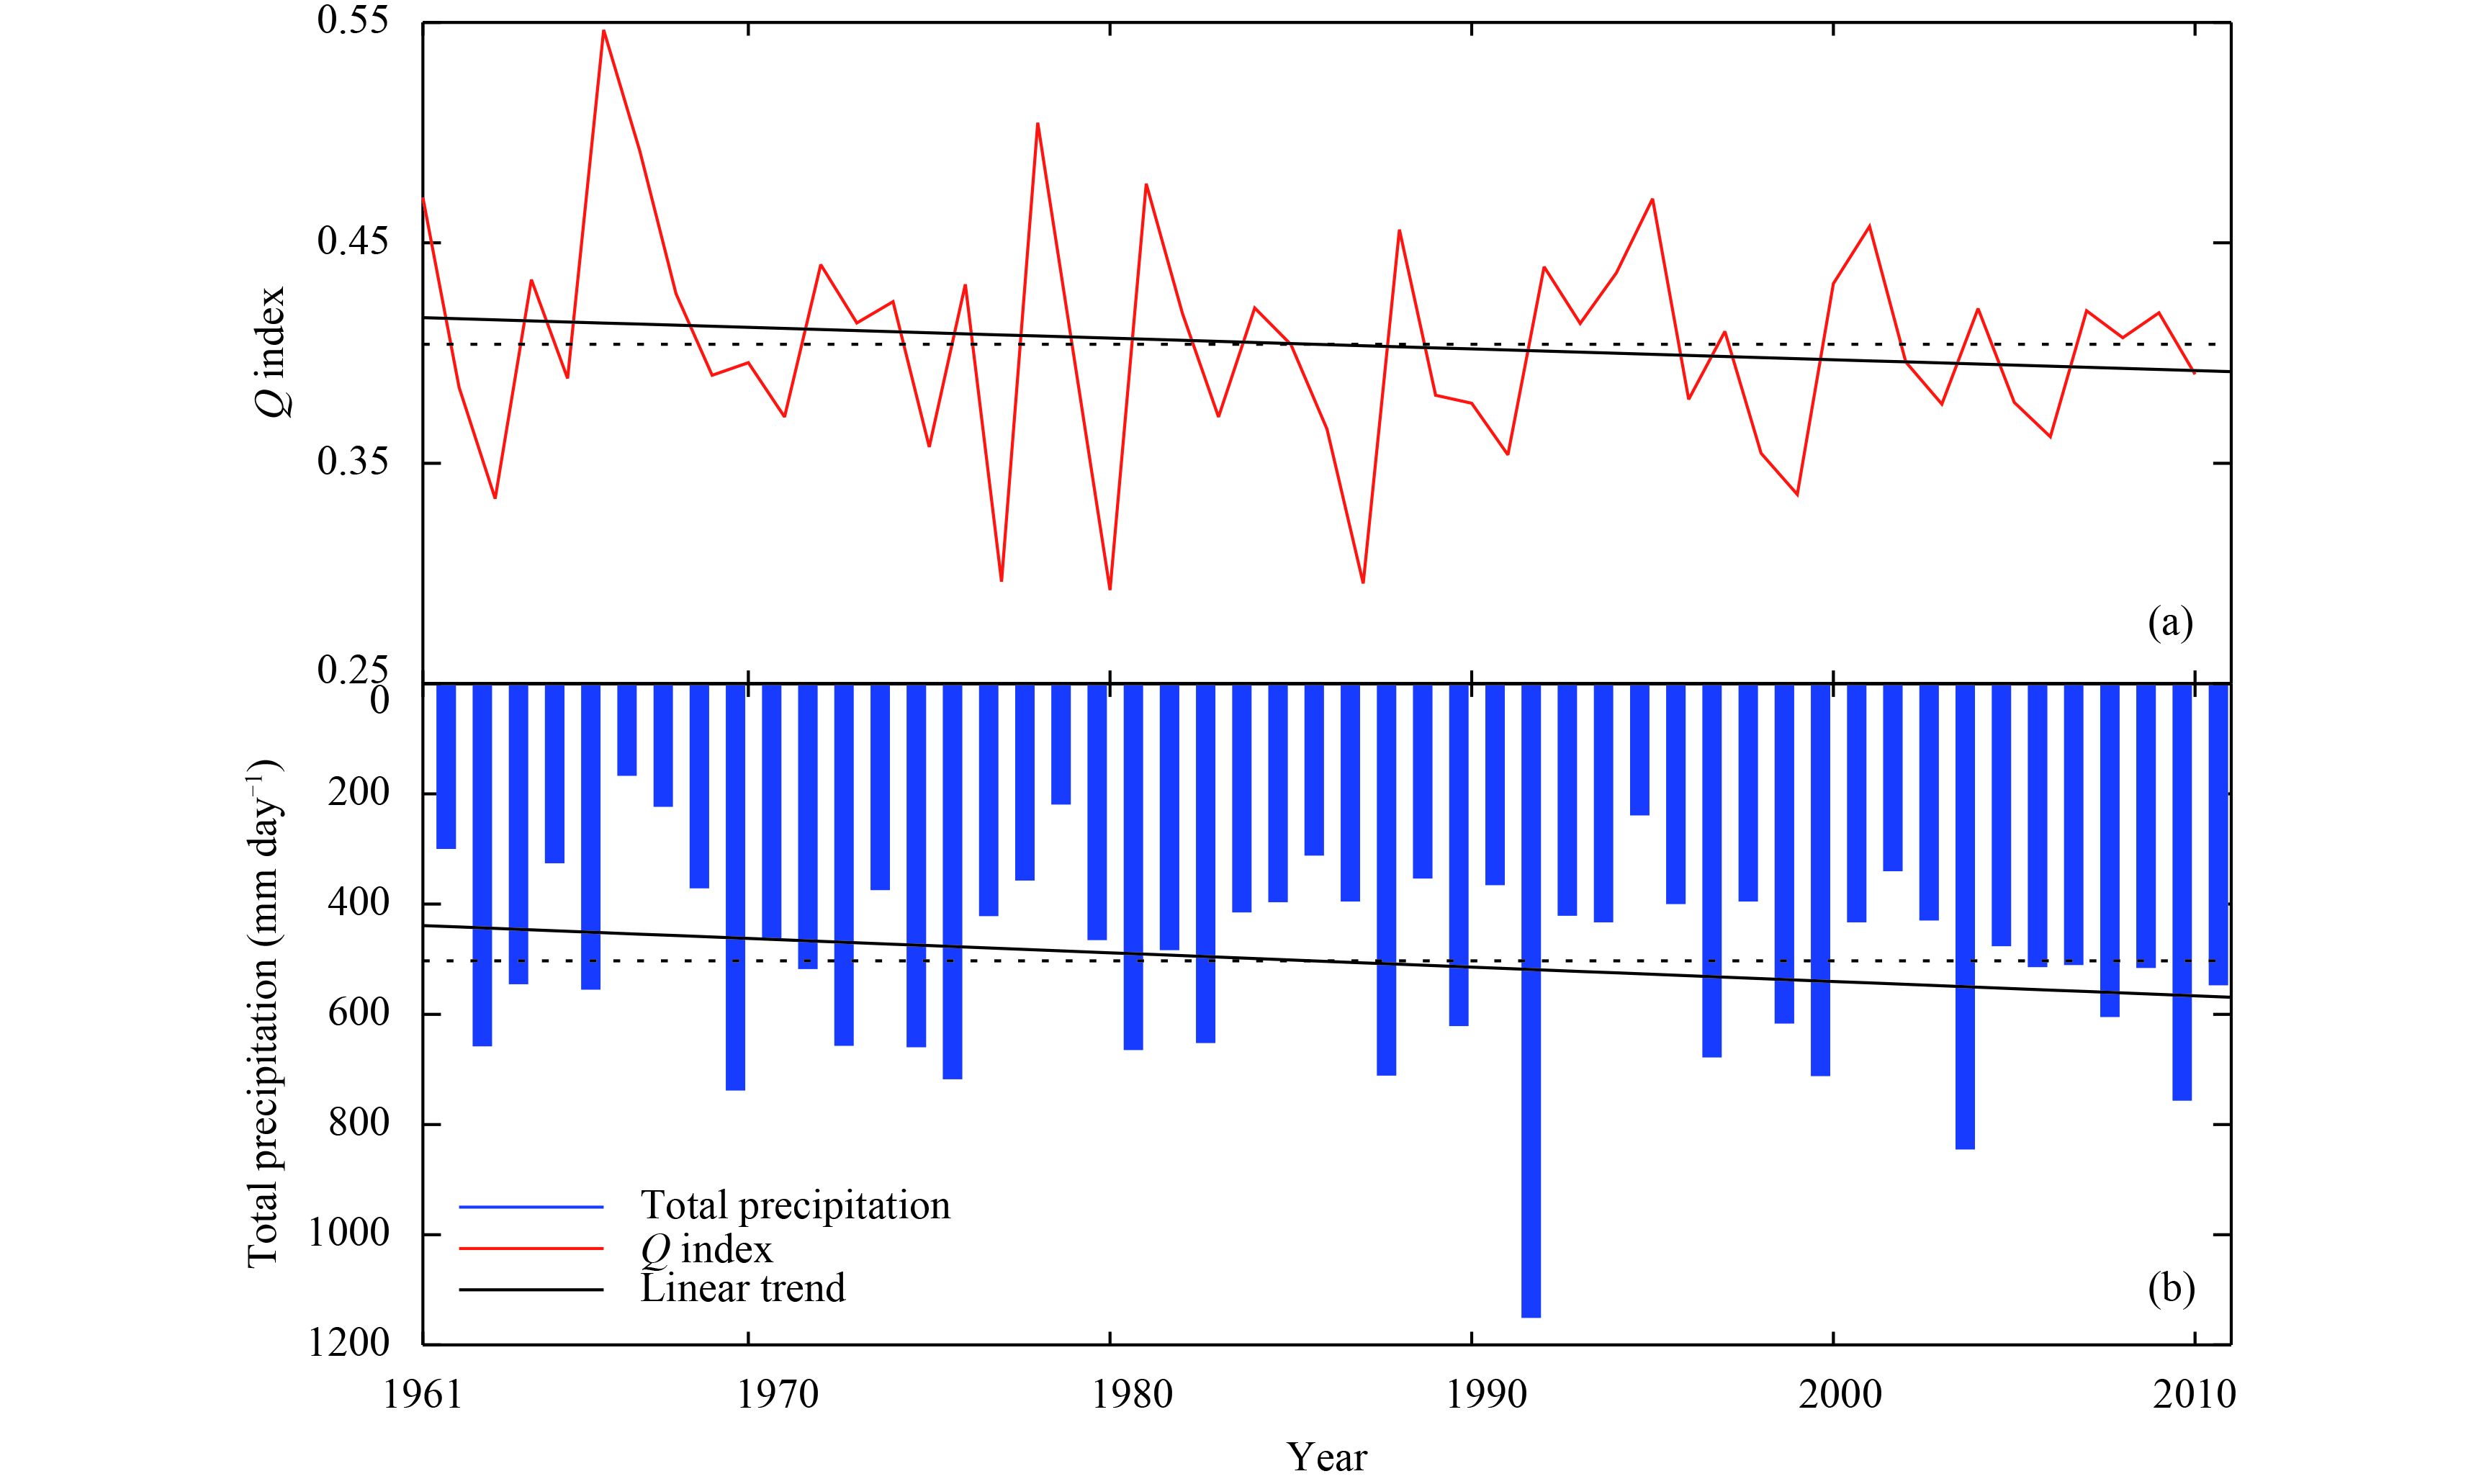
4 Selected cases for understanding the application of Q indexIn the following section, we will take precipitation at stations of Nanjing in Jiangsu Province and Yibin in Sichuan Province as examples to further explain the meaning of Q index. Figures 2 and 3 show the time series of summertime Q index in Nanjing and Yibin from 1961 to 2010. Figure 2 shows that the Q index of Nanjing ranges from 0.29 to 0.55, with the minimum value (0.29) detected in 1980 and the maximum value (0.55) detected in 1966. We also found that during 1961–2010, Q index decreased at a rate of 0.5% per decade in Nanjing. This suggests that precipitation in Nanjing has become more dispersive during this period. Considering the fact that the summer total precipitation in Nanjing increased by 0.52% per decade from 1961 to 2010, while the daily precipitation distribution reflected by Q index showed a decreased trend, it is easy to conclude that daily precipitation in Nanjing tended to be concentrated in fewer periods and flood events tended to occur more easily from 1961 to 2010.
|
| Figure 2 Time series of the (a)Q index and (b) total precipitation in the summers from 1961 to 2010 in Nanjing. The dotted line represents the average, the Q index average is 0.40, and the total precipitation average is 503 mm. |
|
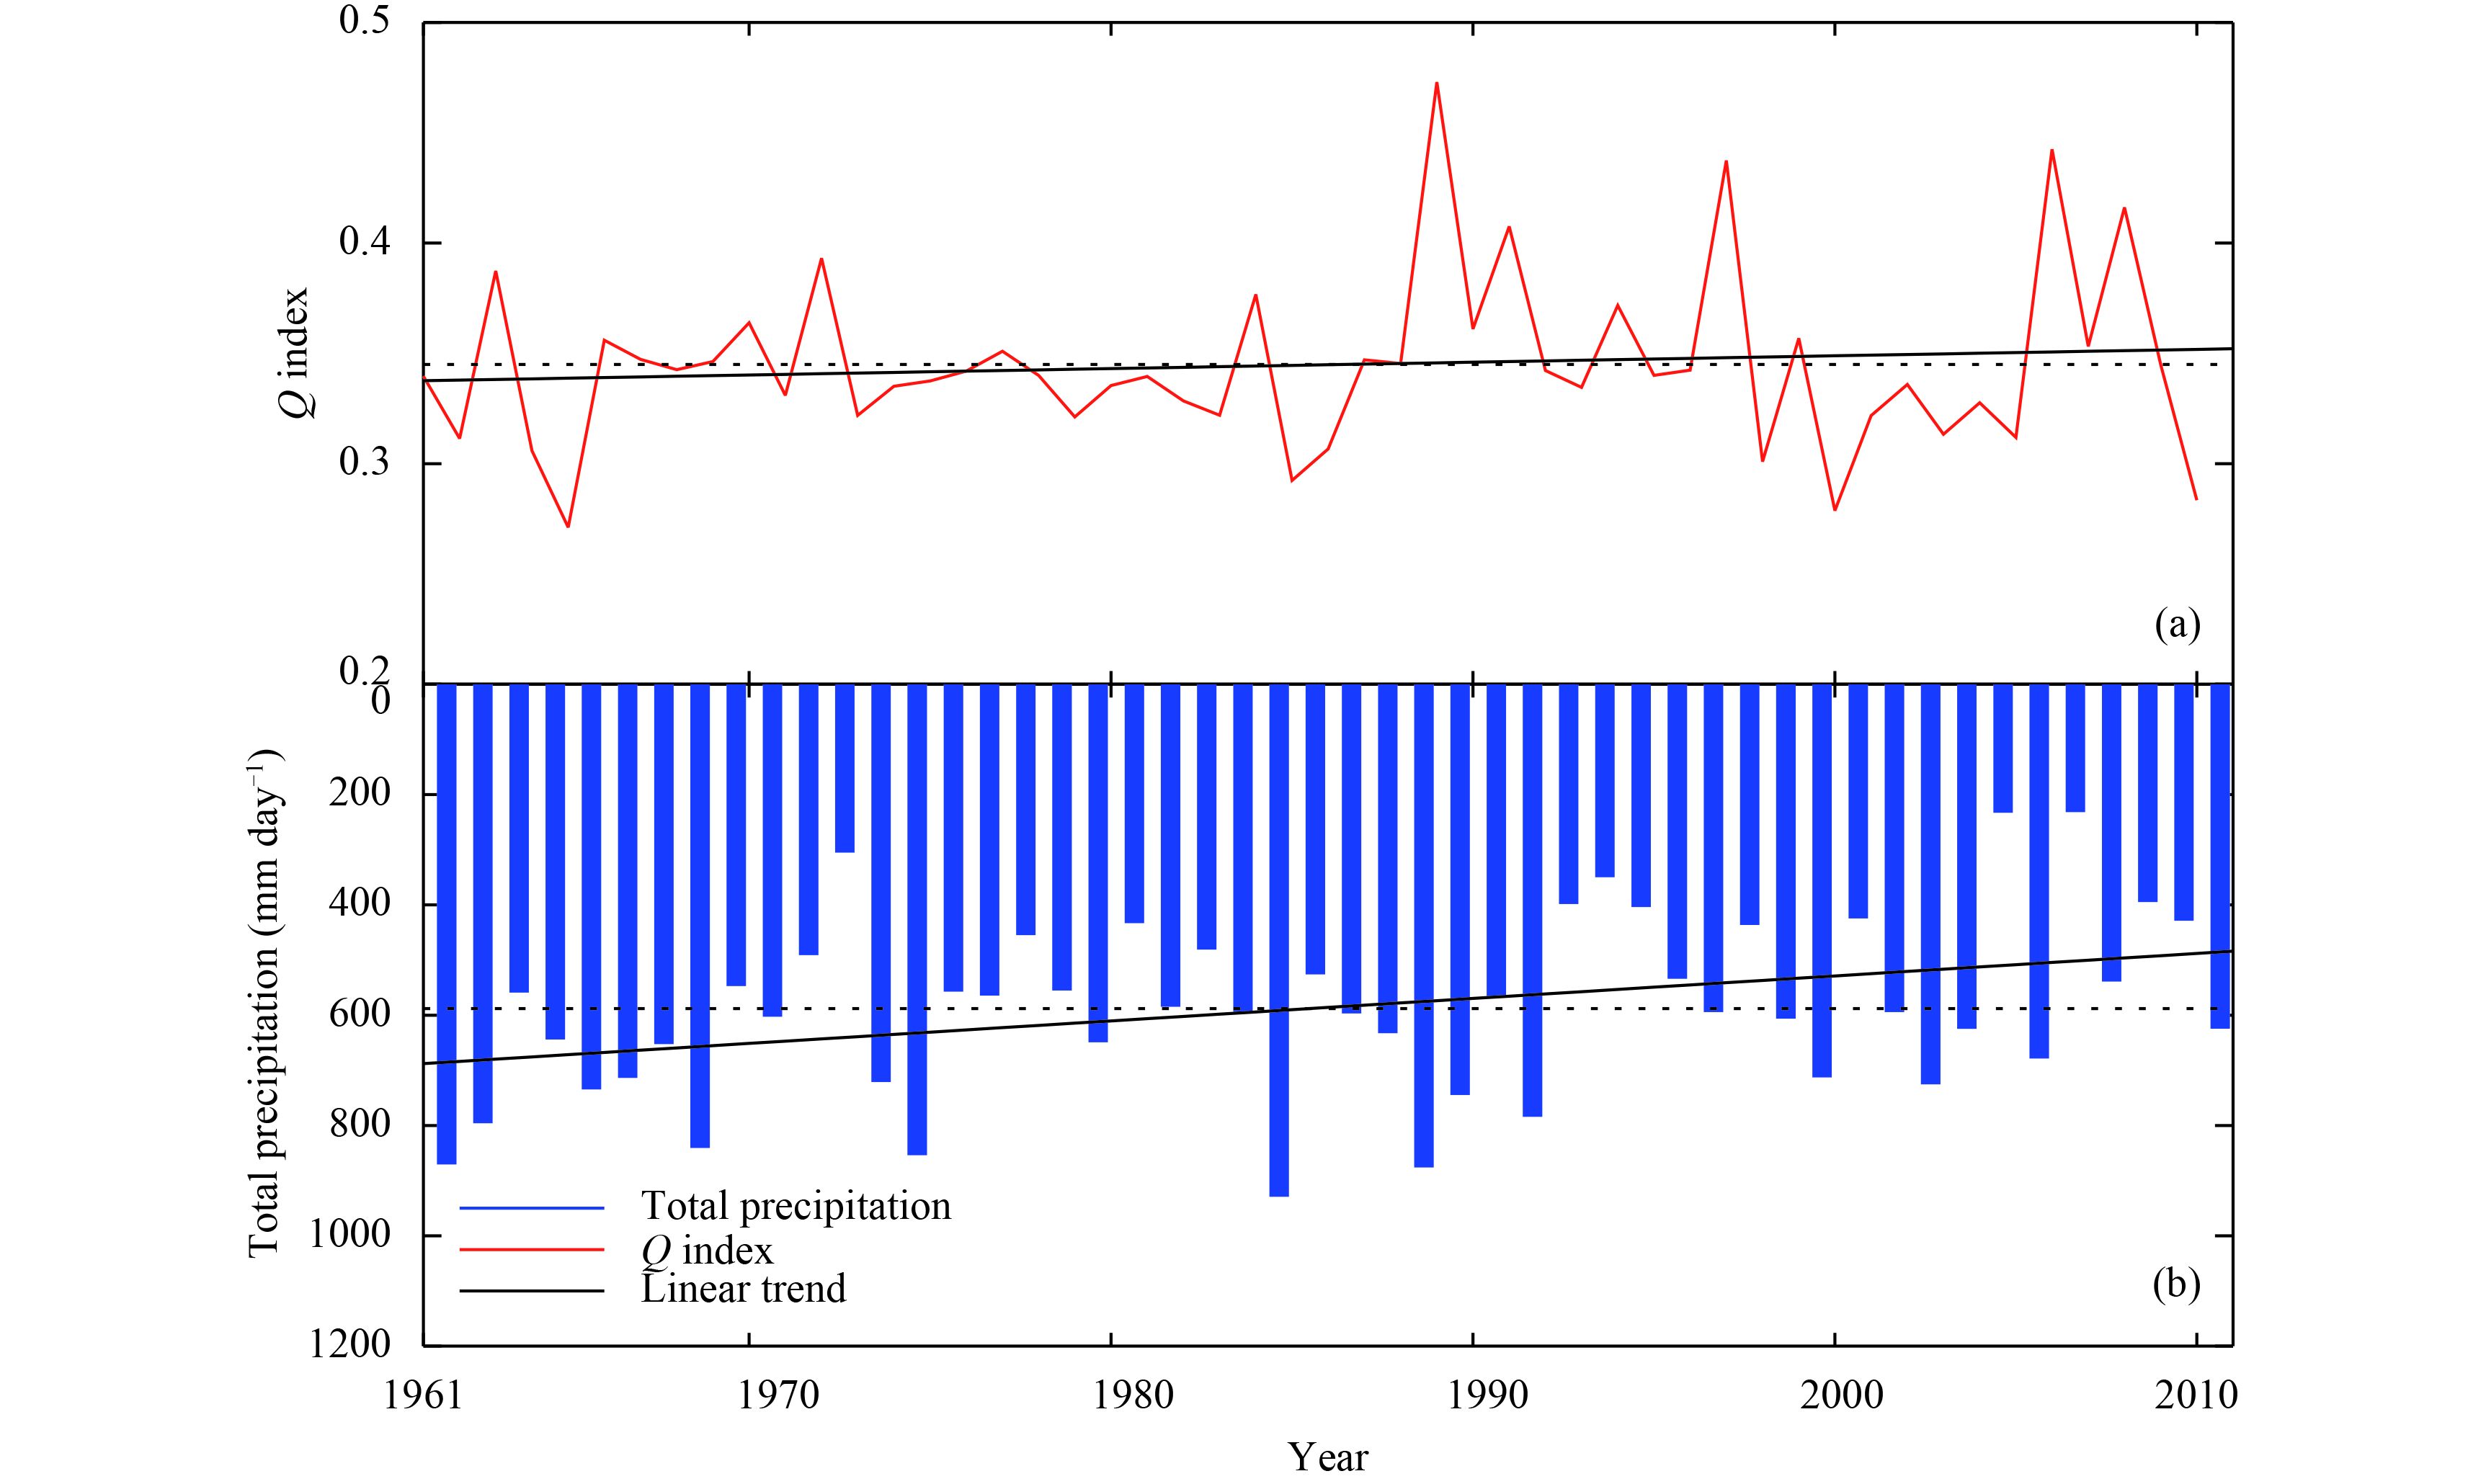
| Figure 3 As in Fig. 2, but for Yibin station. The dotted line represents the average, the Q index average is 0.34 and the total precipitation average is 588 mm. |
Figure 3 indicates that at Yibin station, the summertime precipitation decreased by 0.68% per decade but the Q index increased by 0.5% per decade from 1961 to 2010. It illustrates that temporal precipitation distribution at Yibin station tended to be more concentrated, with the summer rainfall occurring in fewer days. This implies a drying trend in Southwest China. This result is consistent with the conclusion that less persistent precipitation events and more frequent dry spells occurred in Southwest China as noted by Chen and Zhai (2014).
To further describe how the Q index reflects daily precipitation structure, we discussed several cases in Nanjing and Yibin as follows.
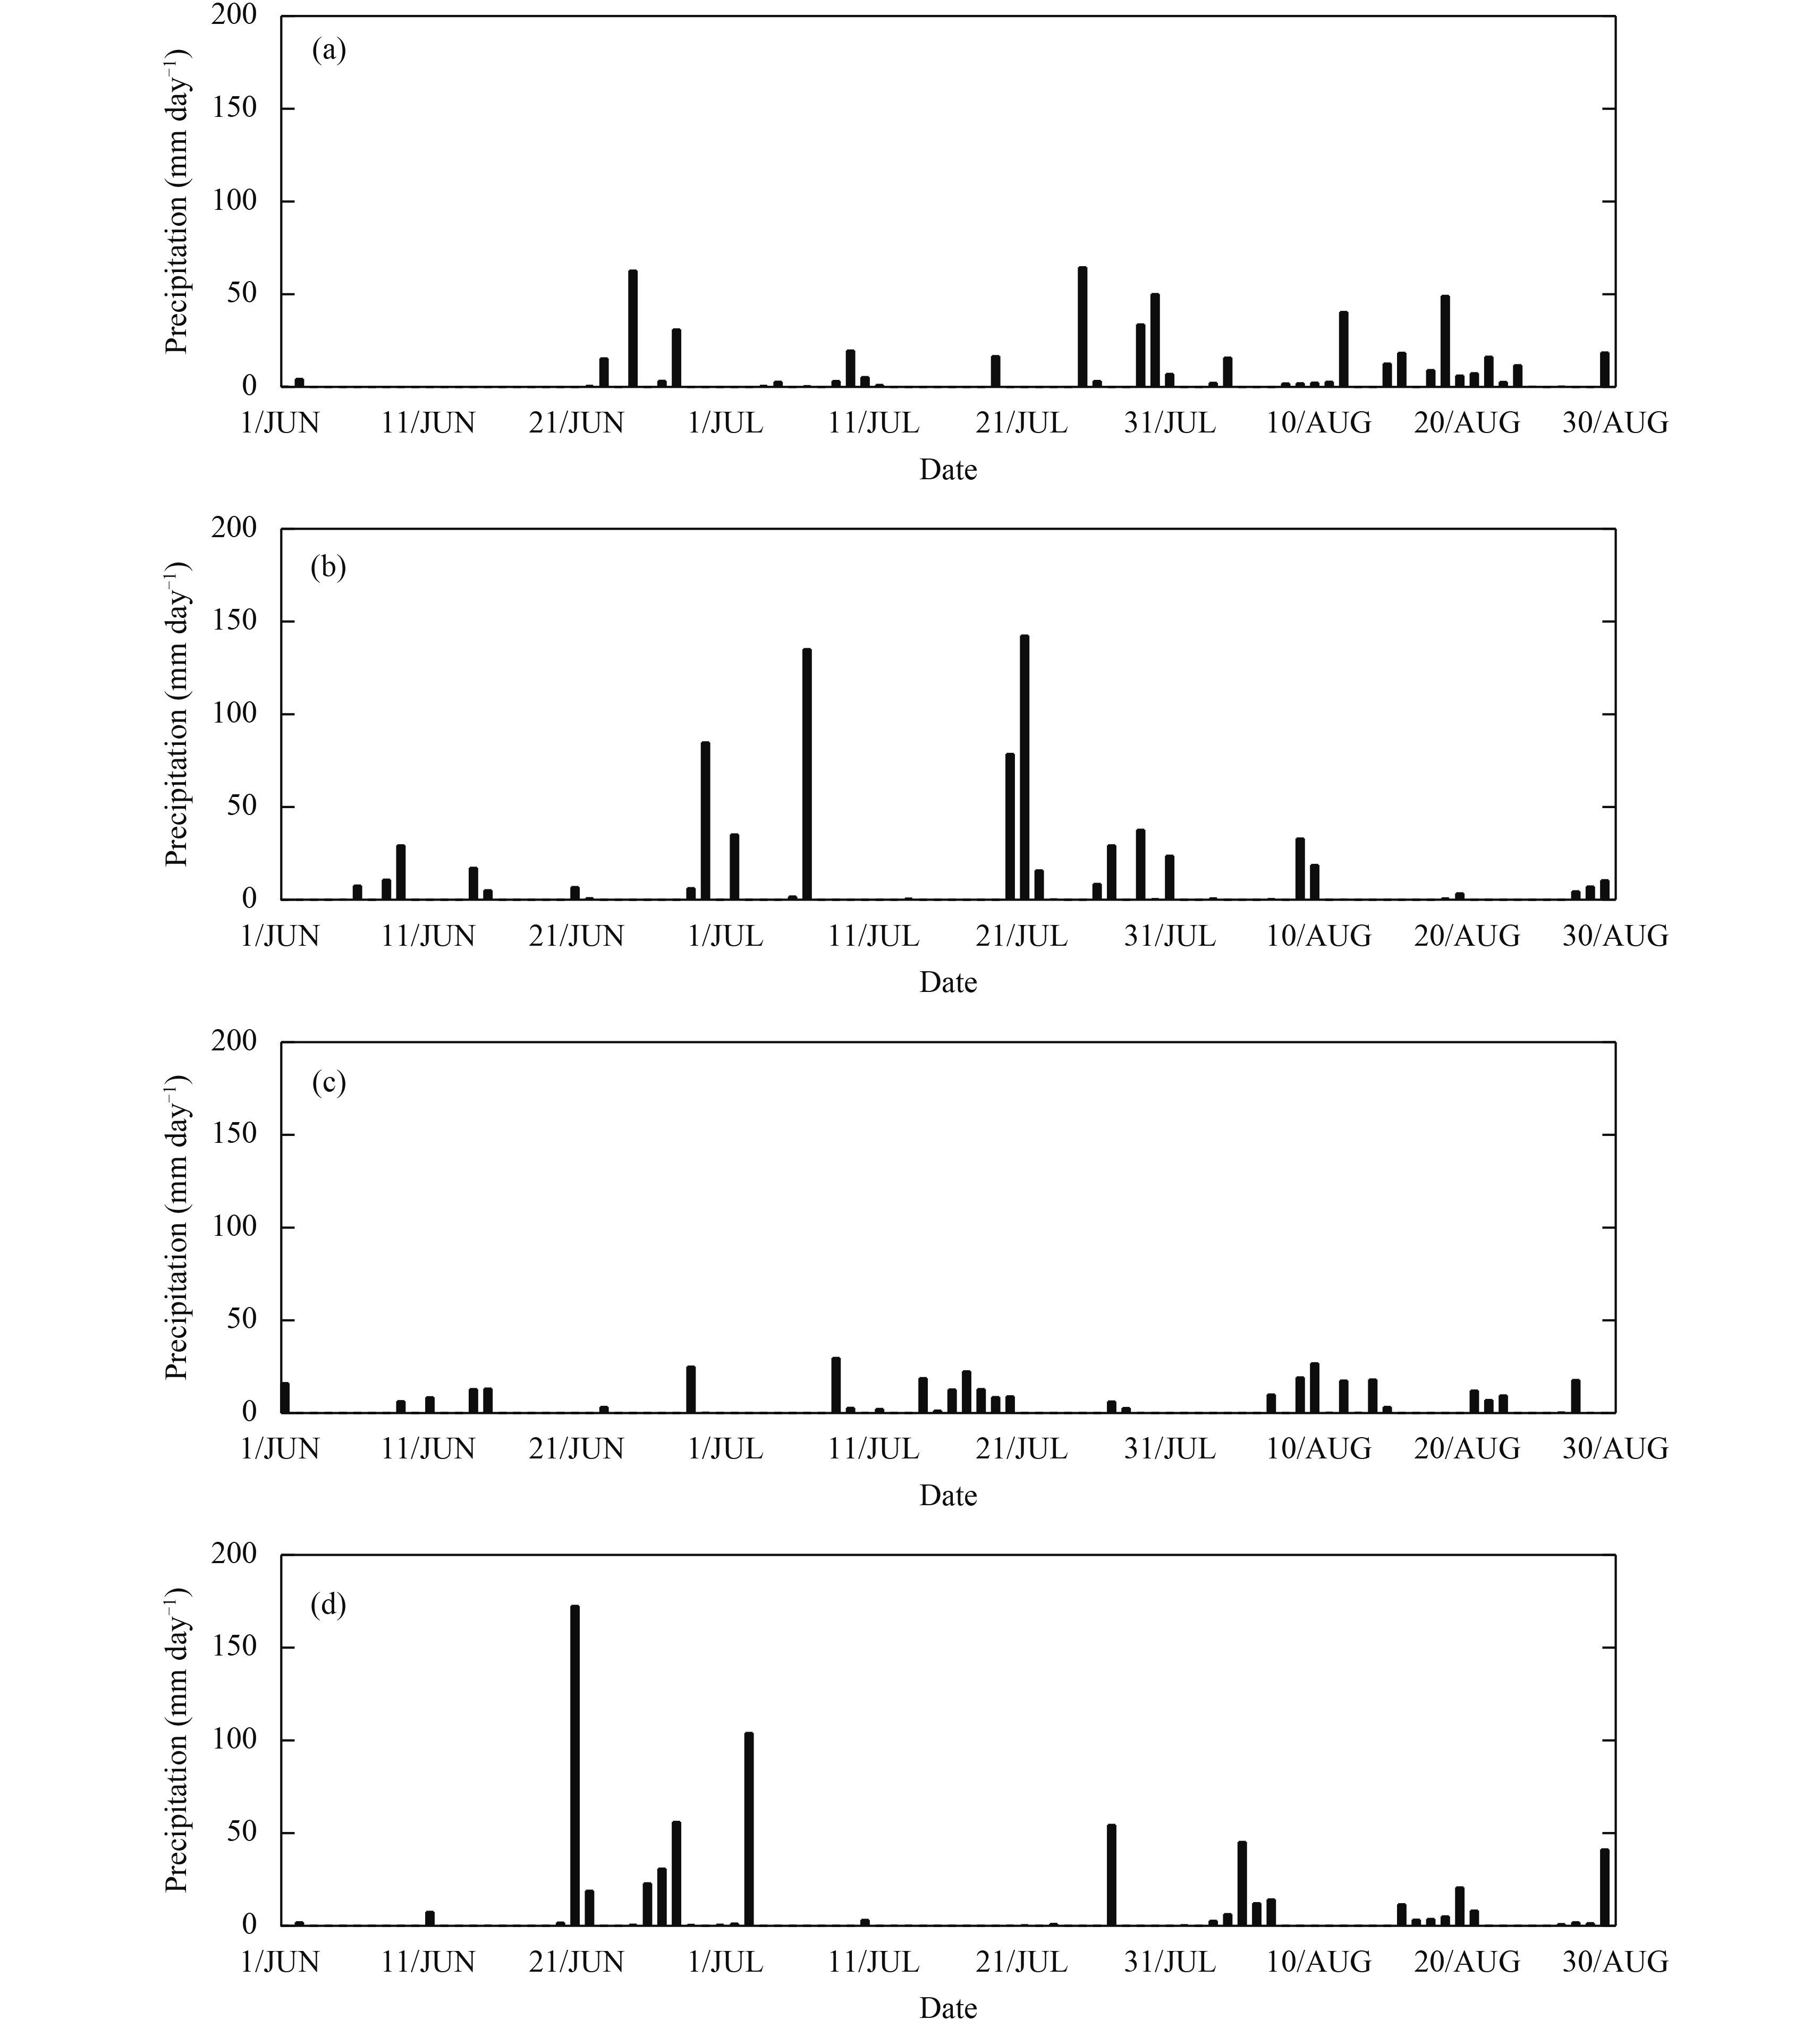
For precipitation in Nanjing, the low and high values of the Q index shown in Fig. 2 were selected to analyze daily rainfall in summer. Figures 4a and 4b show the summer rainfall in Nanjing in 1963 and 2009, respectively. The value of the Q index for 2009 was 0.42. Obviously, most precipitation in the summer of 2009 was concentrated on 1, 8, and 22–23 July, as shown in Fig. 4b. The precipitation within the 4 rainy days accounted for 58.3% of total rainfall in summer. In recent years, with the acceleration of urbanization process and more extreme precipitation events in Nanjing, waterlogging disasters in this city have become more and more serious. The value of the Q index for 1963 was 0.33, and there were 38 rainy days in the summer of 1963. Both indicate that the precipitation during the summer of 1963 dispersed as shown in Fig. 4a. However, the summer total precipitation amount was small in 1963, indicating that there were more wet spells. In addition, Figs. 4c and 4d show the summer daily rainfall distributions in Nanjing in 1977 and 1972. It can be seen that the Q index value for 1972 was as high as 0.44, and the summer total precipitation was 657.3 mm. As a matter of fact, most of the rainfalls were concentrated in a few days, i.e., 22 and 29 June, and 7 and 31 August. Especially on 22 June, there was 172.5-mm precipitation as shown in Fig. 4c. Such kinds of extreme weather events have a high potential to cause delays of major transportation, casualties, and other disasters. However, precipitation was smaller in early June and the entire July, and rainy days were less than normal in the summer of 1972. Thereby, drought events easily occurred during this period. Figure 4d shows that there were 29 rainy days in the entire summer of 1972 while the Q index value was as low as 0.3. This indicates a more dispersed precipitation property.
|
| Figure 4 Temporal distributions of daily precipitation in Nanjing in JJA of (a) 1963, (b) 2009, (c) 1977, and (d) 1972. |
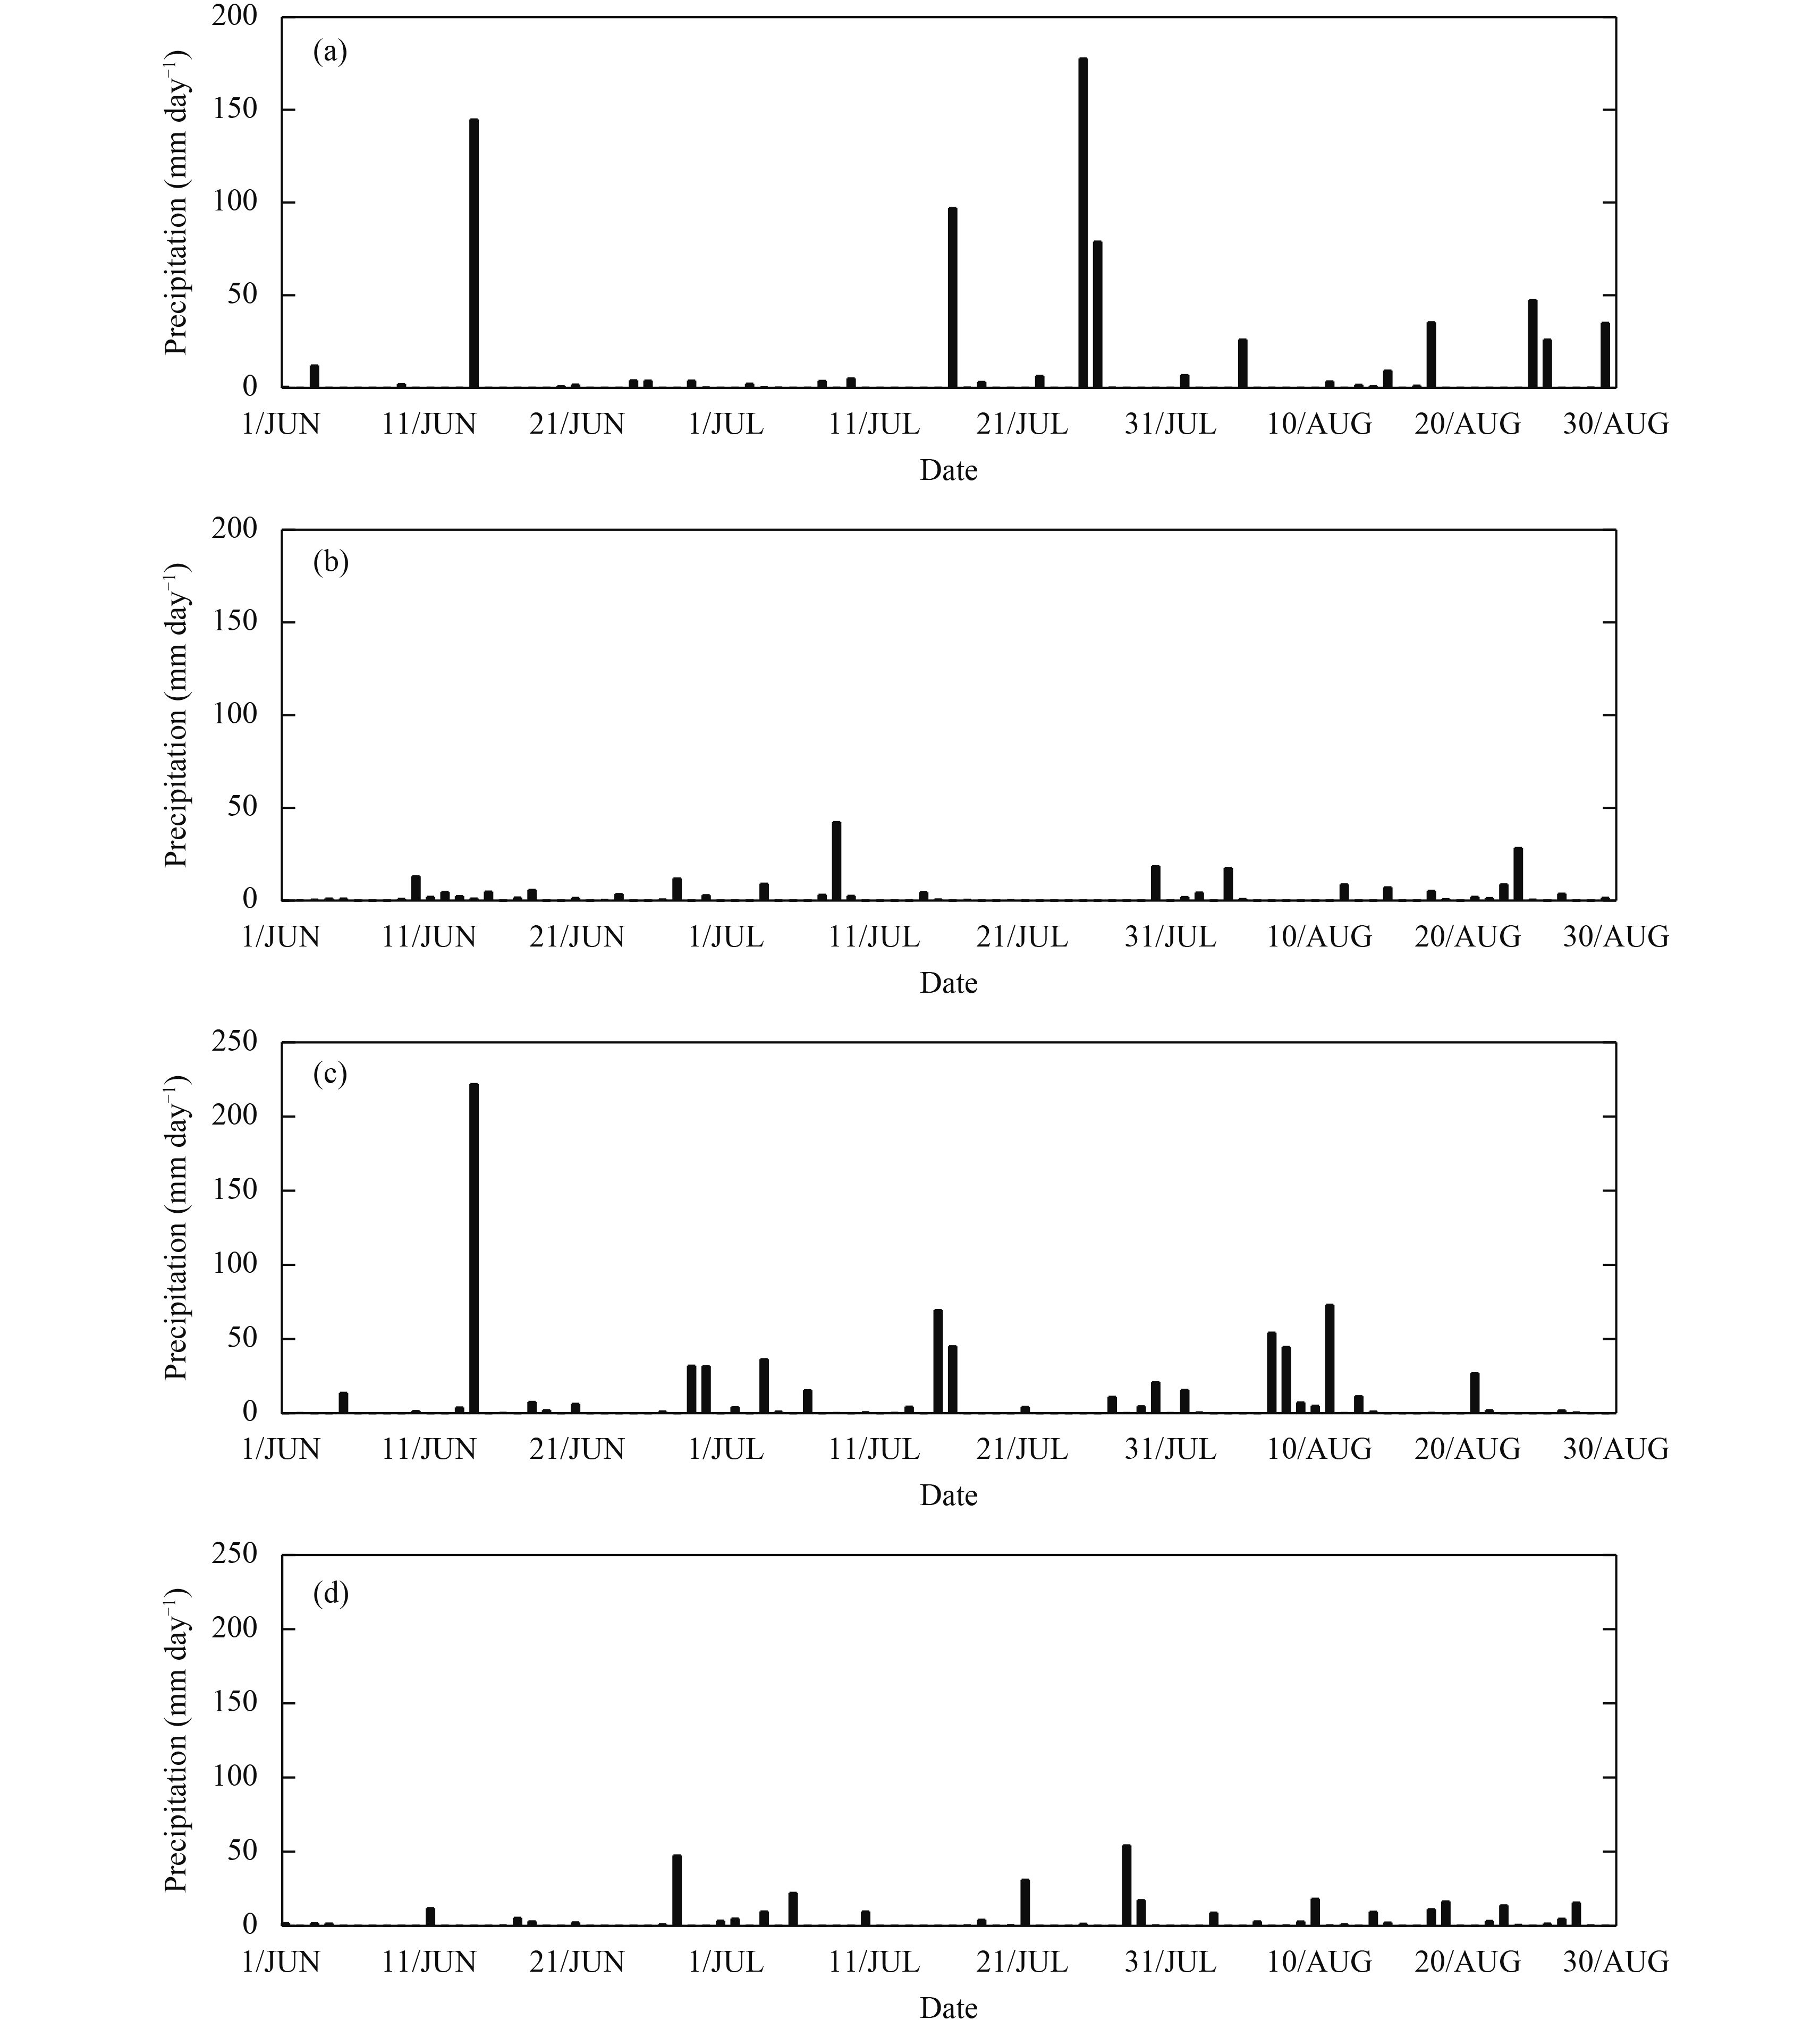
Figures 5a and 5b show the daily precipitation distribution at Yibin in the summer of 1989 when a high Q index value (0.47) was recorded, and in the summer of 2004 when a much lower Q index (0.33) was found in Fig. 3. As shown in Fig. 5a, precipitation mainly occurred on 14 June, 17 and 26–27 July 1989. The total rainfall from June to August 1989 was 744.7 mm, but the precipitation in the 4 rainy days accounted for 70% of the total rainfall in the summer of 1989. This means that most of the summer rainfall in 1989 was concentrated in a few days. Because of the complex mountainous terrain in the Sichuan basin, such types of concentrated heavy rainfall events can easily cause landslide disasters. In contrast, in the summer of 2004, with a total precipitation of 233 mm, daily precipitation scattered over a long period in Yibin as shown in Fig. 5b. The structure of the daily rainfall was decentralized, as reflected by the low Q index and small amount of total rainfall. Such a pattern of temporal distribution of precipitation could easily result in more dry spells.
|
| Figure 5 Temporal distributions of summer daily precipitation in Yibin in (a) 1989, (b) 2004, (c) 1991, and (d) 1993. |
For the additional two cases of 1991 and 1993 as shown in Fig. 3, it can be seen that the Q values were 0.40 and 0.33 for these two years, respectively, while the total precipitation were 784.2 and 349.8 mm (Figs. 5c, d). From Fig. 5c, it can be seen that precipitation was 221.9 mm on 14 June, which accounted for about 28.3% of the total summer rainfall in 1991. It corresponded to the rainstorm in Yibin. On the contrary, only limited summer total precipitation was observed in Yibin and the daily precipitation dispersed in 1993 (Fig. 5d). Such a situation could easily lead to dry spells.
Figures 4 and 5 show that the higher the Q index, the more concentrated the rainfall, suggesting that the whole summer precipitation fall in a few days. If the total precipitation in the summer is fixed, then the more concentrated the rainfall, the higher possibility of occurrence of extreme weather events. If the total precipitation is higher than normal and concentrated over a few days, floods and landslides may occur easily. Nevertheless, less total precipitation is likely to cause more dry spells.
5 Changes in the precipitation concentration in China 5.1 Spatial distributionFigure 6 gives the spatial distributions of the total summer precipitation and the Q index and their trends in China from 1961 to 2010. It can be seen from Fig. 6a that the summer total precipitation gradually decreased from southeast to northwest. The regions with relativity large precipitation were located in Southeast China, southern portion of Southwest China, and southwestern portion of South China. The smallest precipitation was found in most part of Northwest China. However, the regions with greater Q index were located in most part of Northwest China and to the north of the Yellow River (Fig. 6b). It suggests that limited precipitation amount is concentrated in fewer rainy days. This could lead to more dry spells. On the contrary, low values of Q index were found in eastern part of the Tibetan Plateau, eastern Northwest China, and most parts of Southwest and South China, where daily precipitation dispersed.
From Fig. 6c, it can be found that the increasing trend of precipitation occurred in Southeast China, most part of Northwest China and the Tibetan Plateau, with the largest increase occurring in the Jianghuai region and southeastern part of South China. However, precipitation in other regions showed a decreasing trend. As for the Q index (Fig. 6d), the most obvious increasing trend was found in South China and most part of Southwest China. This suggests that there existed various precipitation concentration trends in these areas. In addition, the total precipitation decreased since 1961 in Southwest China, and the Q indices increased. Less precipitation with less rainy days leads to more dry spells. Several recent studies have revealed that Southwest China had experienced more frequent severe droughts during the last decade. This was associated with the change in the precipitation structure (Chen and Zhai, 2015). In addition, the regions with increased precipitation and larger Q index were found in South China, where it seemed that larger precipitation tended to concentrate in fewer days and floods tended to occur more easily. However, a decreasing trend of Q index was noted in Northwest China, the Tibetan Plateau and to the north of Huaihe River. To the north of Huaihe River, Zhai and Pan (2003) revealed that precipitation decreased, and the number of rain days became fewer. Thus, dry spells increased in these places. The region with smallest precipitation was located at Northwest China, where the Q index showed a largest decreasing trend. Because the total summer precipitation showed an increasing trend in Northwest China, dry spells became less there.

|
| Figure 6 Distributions of (a) summer (JJA) mean total precipitation, (b) Q index, (c) the changing trend for total precipitation (mm (10 yr)–1), and (d) the trend for Q index (0.01 (10 yr)–1) in China for 1961–2010. The trends with cross signs are significant at the level of p < 0.1. |
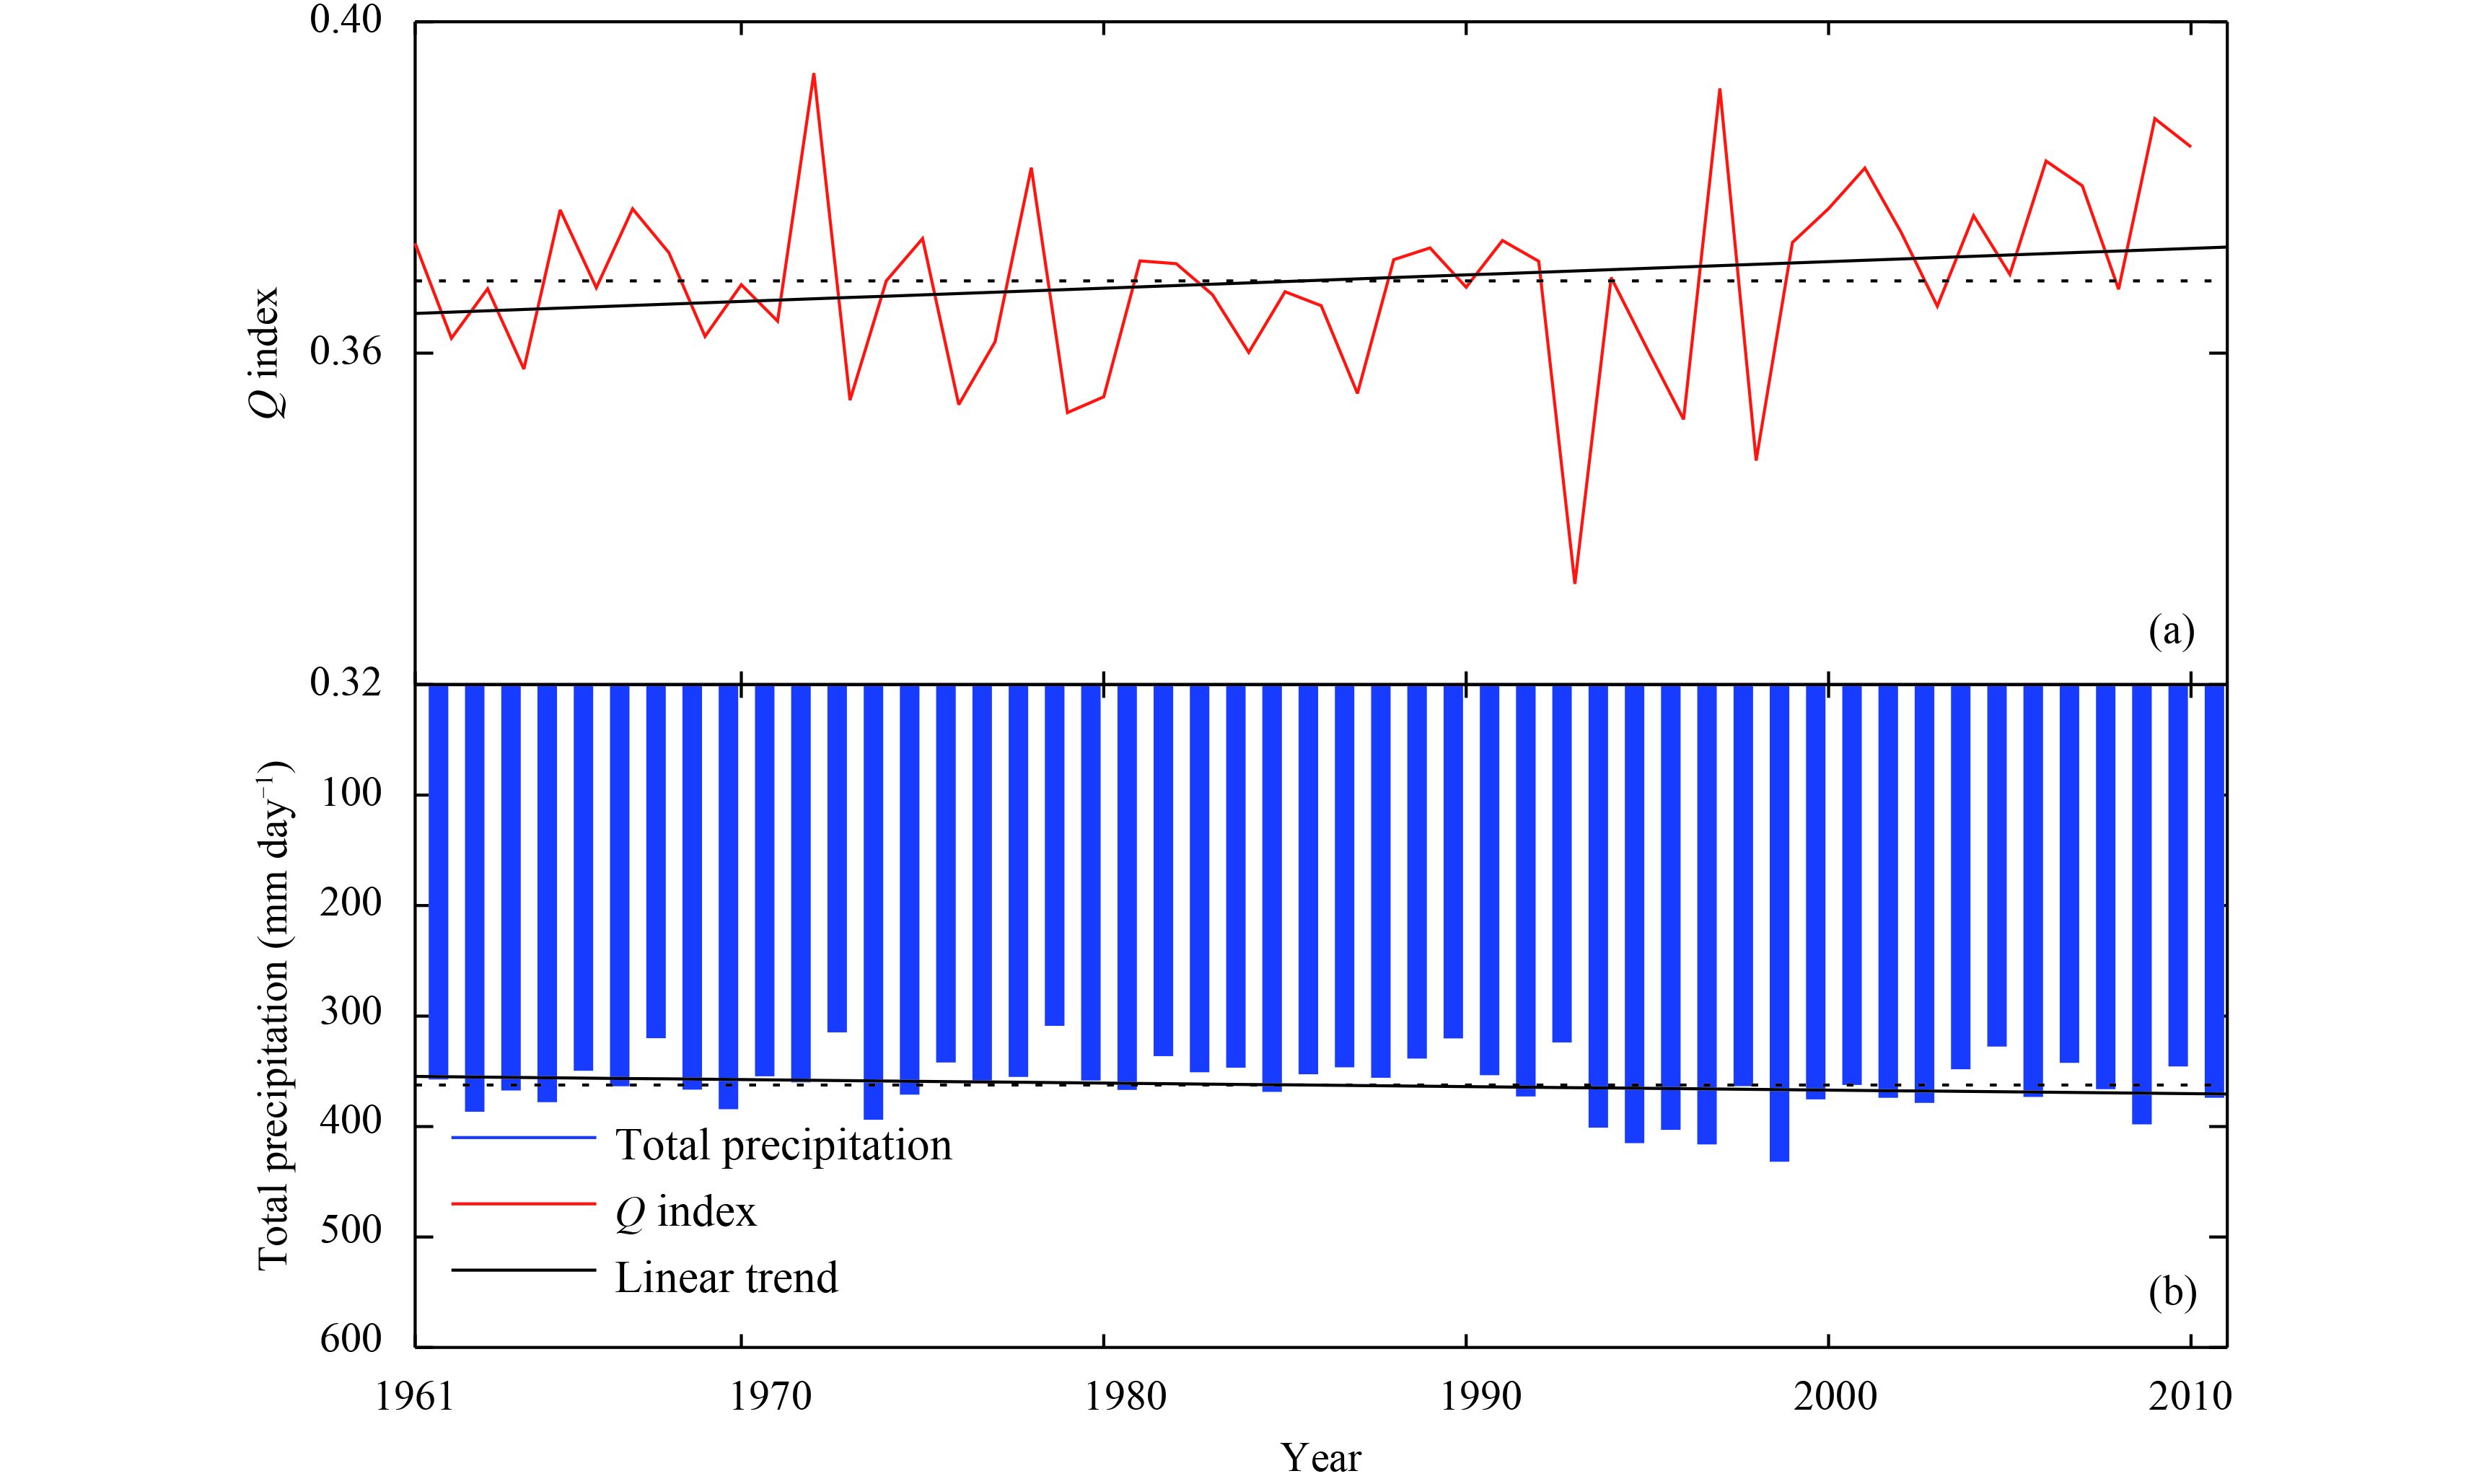
Figure 7 shows the temporal variations of the Q index and summer rainfall total over entire China. The value of the Q index ranged from 0.33 to 0.40, and the annual average was 0.37. The Q index and the total summer precipitation both showed an increasing trend. An increasing trend since the early 1990s was also found. This suggests that the temporal distribution of precipitation tended to be more concentrated from 1961 to 2010. When considering the fact that summer precipitation in China increased during this period, it is not surprising that floods also occurred more frequently.
|
| Figure 7 Variations of (a) the Q index and (b) total precipitation in the summer averaged over the entire China from 1961 to 2010. The straight line is annual average value. |
Figure 8 shows the variations of the Q index and the total precipitation in different regions. Both Q index and the precipitation displayed significant interannual variations. The Q index showed an increasing trend but the total precipitation tended to decrease in Southwest China, Inner Mongolia area, Northeast China, and North China (Figs. 8b, e, f, g). Specifically, the Q index increased fast with a rate of 0.72 per decade in Inner Mongolian area, but precipitation showed a decreasing trend by about 5.7 mm per decade (Table 2). This means that less precipitation occurred in fewer days, and thus dry spells increased obviously. However, both the Q index and the precipitation did not show any increasing trends in South China (Fig. 8a). In other regions, the Q index showed a decreasing trend, while precipitation total exhibited an increasing trend (Figs. 8c, d, h, i). Note that the most remarkable decrease in the Q index with a rate of –0.27 per decade was found in Jiangnan Region (Fig. 8i), but the precipitation total showed a large increasing trend with the increasing rate of 14.7 mm per decade (Table 2).

|
| Figure 8 Variations of the summer Q index and total precipitation for (a) South China, (b) Southwest China, (c) Tibet, (d) Northwest, (e) Inner Mongolia area, (f) Northeast, (g) North China, (h) East China, and (i) Jiangnan Region from 1961 to 2010. Straight lines represent annual averages, blue bars are total precipitation, red lines indicate the Q index value, and black lines show the lineartrends. |
| Region | Q index trend (per decade) | Q index average | Q index range | Precipitation trend (mm (10 yr)–1) | Precipitation average (mm) | Precipitation range (mm) |
| Northeast | 0.67 | 0.35 | 0.30–0.42 | –3.4 | 388.4 | 290.2–502.9 |
| Inner Mongolian area | 0.72 | 0.40 | 0.36–0.48 | –5.7 | 201.6 | 142.0–324.2 |
| Northwest | –0.24 | 0.44 | 0.39–0.49 | 13.01 | 127.4 | 92.2–151.7 |
| North China | 0.62 | 0.39 | 0.33–0.45 | –13.1 | 334.7 | 201.6–464.6 |
| East China | –0.12 | 0.40 | 0.34–0.47 | 7.9 | 472.3 | 292.8–641.1 |
| Jiangnan Region | –0.27 | 0.37 | 0.29–0.44 | 14.7 | 524.0 | 375.4–731.1 |
| Southwest | 0.26 | 0.27 | 0.25–0.37 | –6.7 | 547.0 | 384.0–611.8 |
| South China | 0.097 | 0.31 | 0.25–0.37 | 0.97 | 755.4 | 402.4–1214.8 |
| Tibet | –0.19 | 0.22 | 0.17–0.29 | 8.97 | 297.9 | 190.6–413.1 |
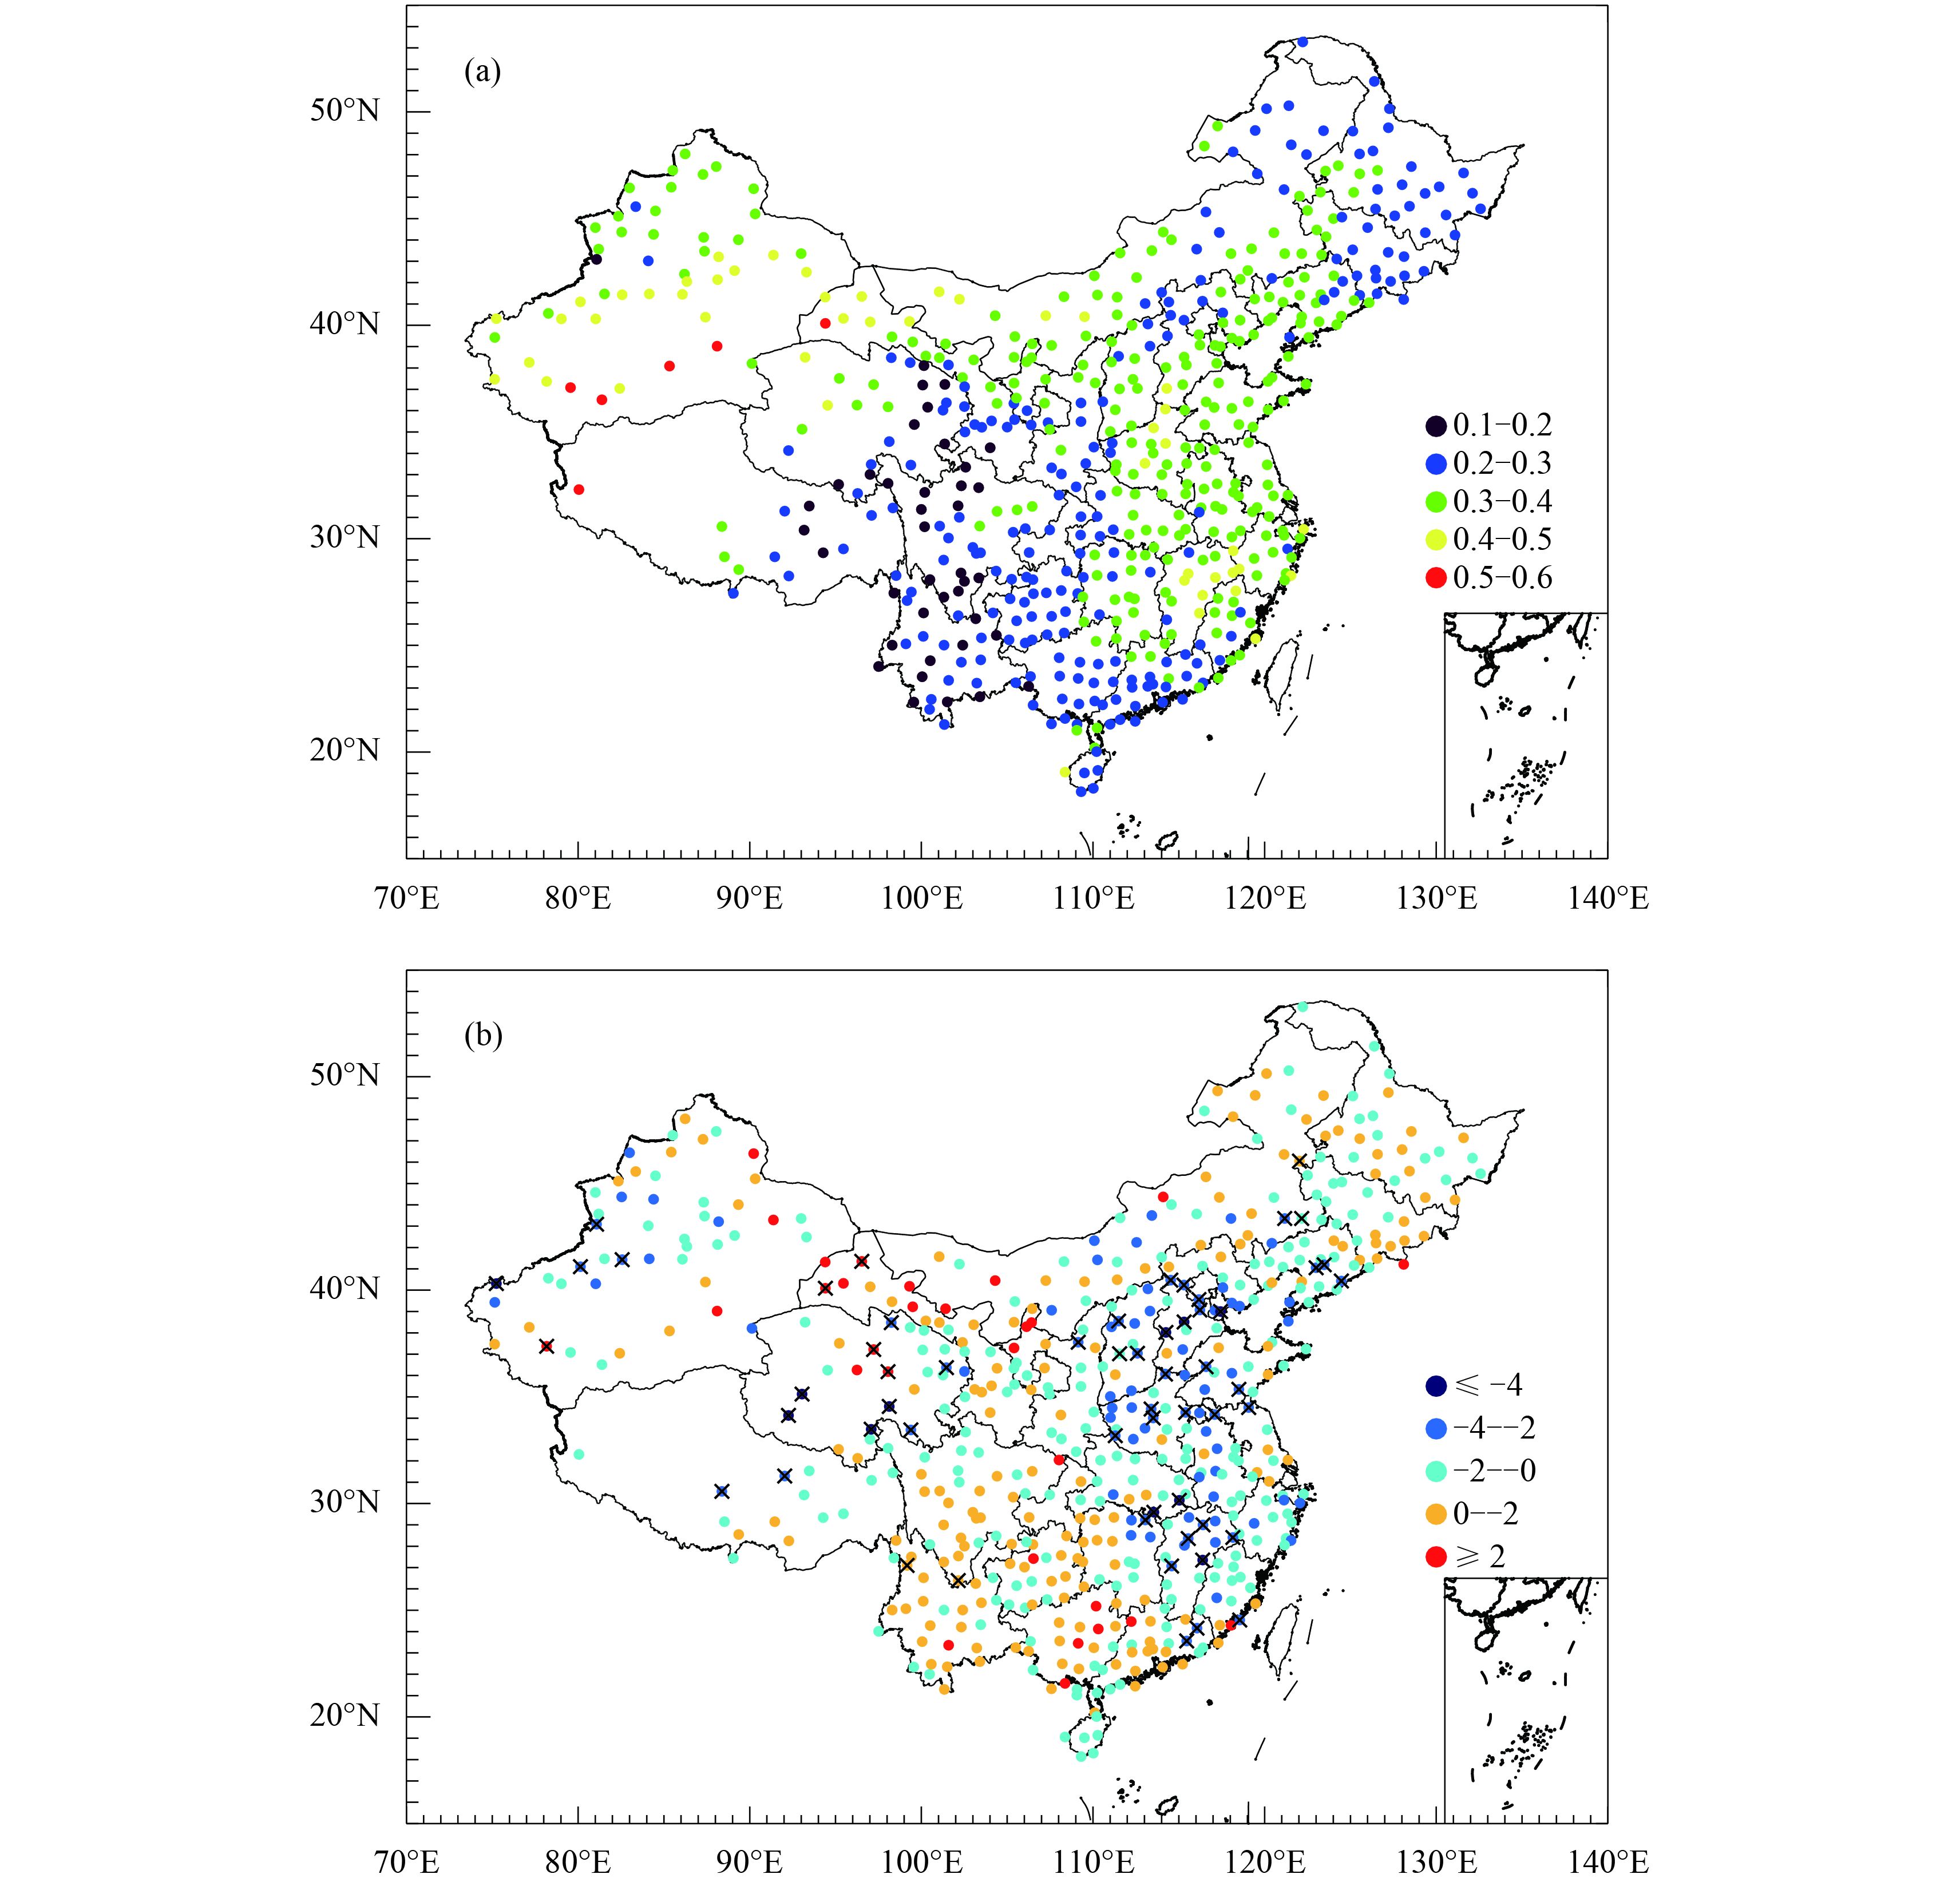
In order to better understand the Q index, the results based on the PCD method are compared with the results from the Q index. The spatial distributions of the value and the trend of the PCD in China in the summer from 1961 to 2010 are illustrated in Fig. 9. It can be seen from Fig. 9a that the range of the summer PCD value was between 0.1 and 0.6, and in most part of China the PCD value was between 0.2 and 0.5. Geographically, the PCD value in most of Heilongjiang Province, eastern North-west China, and Southwest and South China ranged from 0.1 to 0.3, which was lower than that in other regions. On the contrary, the highest PCD value was located in the middle of Xinjiang Region with the value changes around 0.6. The second highest value of the PCD appeared in the south of the Yangtze River, and the value ranged from 0.4 to 0.5. In other regions, it ranged from 0.3 to 0.4.
|
| Figure 9 Distribution of (a) summer (JJA) PCD values and (b) trends for PCD (0.01 (10 yr)–1) in China for 1961–2010. Trends with cross signs stand for p < 0.1. |
Figure 9b shows the spatial distribution of the PCD trend in China from 1961 to 2010. Positive trend of the PCD appeared in the east of the Xinjiang Region, the west of Inner Mongolian area, and most part of South-west China, where the PCD value increased during the period of 1961–2010. The maximal positive trend was located at the west of the Inner Mongolian area, where the tendency of the PCD change was about 0.02 per decade. On the contrary, the PCD value in the northwest of Northwest China and most parts of East and Northeast China showed a decreasing trend by the rate from 0.02 to 0.04 per decade.
Comparing the results based on the two methods, it is clear that both the PCD and the Q index can represent the precipitation concentration degree and the spatial distribution of the rainfall zones in the entire country. However, there are some obvious differences in the distributions of the values and their trends of the PCD and the Q index. Climatologically, the Q index value ranges from 0.1 to 0.6, but the range of the PCD-based is mostly from 0.2 to 0.4 throughout China. Thus, due to the fact that the Q index value spans a wider range than the PCD value, it can better distinguish the temporal concentration property of precipitation in China. In addition, the PCD value shows that the rainfall tended to become more dispersing in almost the entire eastern part of China during 1961–2010, but this changing property could only be found in the middle and lower reaches of the Yangtze River in terms of the Q index. Moreover, the concentration trend of temporal precipitation distribution in Southwest China was more clearly delineated by the Q index than by the PCD method. Obviously, the Q index can more objectively reflect the climate change features of daily precipitation change in eastern China than the PCD method. In addition, the trend revealed by the PCD method is generally not significant at the 90% confidence level.
7 Conclusions and discussionBased on the concept of “information entropy”, an index was defined in this study to measure the degree of precipitation concentration property (Q index). Using daily precipitation data collected at 553 observational stations in China during 1961–2010, the changes in the concentration property of temporal precipitation distribution in the summer over China were investigated. Examples were presented to show the applicability of the new index.
This paper redefined the concept and formula of the precipitation concentration property (Q index). It reflects the structure of the annual rainfall distribution. We used the concept of “information entropy” as the reference. Precipitation concentration reflects the variation in the temporal distribution of daily precipitation.
The Q index is defined in the present study varies between 0 and 1, and thus it can be used to compare the degree of the rainfall concentration among different stations. In addition, it is found that when the Q index value is high (close to 1), precipitation days tend to be concentrated. If precipitation total is large (small), floods (dry spells) tend to occur. When Q index is low (close to 0), precipitation days tend to be dispersed.
To better understand the meaning of the Q index, the data from Nanjing and Yibin stations were used to analyze the precipitation concentration. The summer total precipitation in Nanjing increased from 1961 to 2010, but the Q index showed a downward trend. Daily precipitation in Nanjing tended to be concentrated in fewer periods, which suggests that there were more intense precipitation events and wetter days. However, the total precipitation in Yibin showed a downward trend, but the structure showed a concentration trend. Therefore, the summer rainfall tended to occur in fewer days in Yibin. This implies a drying trend in Southwest China during the study period. In China, the summer total precipitation gradually decreases from southeast to northwest. However, the regions with larger Q index value were located at most parts of Northwest China and to the north of Yellow River. This suggests that limited precipitation total were concentrated in fewer rain days in these regions, and such a precipitation structure is easy to lead to more dry spells. On the contrary, the lowest Q index value was found in eastern part of the Tibetan Plateau, southeastern part of Northwest China, and most parts of Southwest China and South China, where daily precipitation were dispersed.
Increasing trends of precipitation were found in Southeast China, most parts of Northwest China, and the Tibetan Plateau. The most dramatic rainfall changes were found at the Jianghuai area and southeastern parts of South China. However, other regions experienced a decreasing trend. As for the Q index, the most obvious increasing trends were found in South China and most parts of Southwest China. This suggests that there existed various changing trends of precipitation concentration in these regions. When precipitation becomes large (small), floods (dry spells) increase correspondingly. However, decreasing trends of the Q index were found in Northwest China, the Tibetan Plateau, and to the north of Huaihe River. The precipitation there tended to become dispersed during the study period.
Overall, both the Q index and the total summer precipitation in China displayed an increasing trend during 1961–2010, suggesting that the property of precipitation concentration increased and flood disaster occurred more frequently. Summer total precipitation gradually reduced from southeast to northwest. In different regions, both Q index and summer precipitation demonstrated significant interannual variations. The Q index showed an increasing trend but summer total precipitation tended to decrease in Northeast China, Inner Mongolia area, North China, and Southwest China.
Comparing the results based on the PCD and the Q index, some differences could be found. Climatologically, the Q index value ranged from 0.1 to 0.6, but the range of the PCD-based was mostly from 0.2 to 0.4 throughout China. Thus, due to the fact that the Q index value spans a wider range than the PCD value, it can better detect the concentration property of precipitation in China. In addition, the PCD value showed that the rainfall tended to disperse in almost the entire eastern part of China during the study period, but this changing property was only found in the middle and lower reaches of the Yangtze River valley in terms of the Q index. Obviously, the Q index can more objectively reflect the climate change features of daily precipitation in eastern China. Nevertheless, as compared with the method proposed by Zhang and Qian (2003), the new method proposed in this study should be further employed to identify the time period of precipitation concentration in the future study.
| Aguilar E., Barry A. A., Brunet M., et al., 2009: Changes in temperature and precipitation extremes in western central Africa, Guinea Conakry, and Zimbabwe, 1955–2006. J. Geophys. Res., 114(D2), D02115. DOI:10.1029/2008JD011010 |
| Bai A. J., Zhai P. M., Liu X. D., 2006: Climatology and trends of wet spells in China. Theor. Appl. Climatol., 88, 139–148. DOI:10.1007/s00704-006-0235-7 |
| Balling R. C. Jr., Goodrich G. B., 2011: Spatial analysis of variations in precipitation intensity in the USA. Theor. Appl. Climatol., 104, 415–421. DOI:10.1007/s00704-010-0353-0 |
| Bates, B. C., Z. W. Kundzewicz, S. Wu, et al., 2008: Climate Change and Water. Technical Paper of the Intergovernmental Panel on Climate Change. IPCC Secretariat, Geneva, 16. |
| Brown P. J., Bradley R. S., Keimig F. T., 2010: Changes in extreme climate indices for northeastern United States, 1870–2005. J. Climate, 23, 6555–6572. DOI:10.1175/2010JCLI3363.1 |
| Chen Y., Zhai P. M., 2013: Persistent extreme precipitation events in China during 1951–2010. Climate Res., 57, 143–155. DOI:10.3354/cr01171 |
| Chen Y., Zhai P. M., 2014: Changing structure of wet periods across Southwest China during 1961–2012. Climate Res., 61, 123–131. DOI:10.3354/cr01247 |
| Chen Y., Zhai P. M., 2015: Synoptic-scale precursors of the East Asia/Pacific teleconnection pattern responsible for persistent extreme precipitation in the Yangtze River valley. Quart. J. Roy. Meteor. Soc., 141, 1389–1403. DOI:10.1002/qj.2448 |
| Deni S. M., Jemain A. A., Ibrahim K., 2008: The spatial distribution of wet and dry spells over Peninsular Malaysia. Theor. Appl. Climatol., 94, 163–173. DOI:10.1007/s00704-007-0355-8 |
| Endo N., Ailikun B., Yasunari T., 2005: Trends in precipitation amounts and the number of rainy days and heavy rainfall events during summer in China from 1961 to 2000. J. Meteor. Soc. Japan, 83, 621–631. DOI:10.2151/jmsj.83.621 |
| Forland, E. J., A. van Engelen, and J. Ashcroft, 1996: Change in " Normal” Precipitation in the North Atlantic Region. 2nd ed. DMNI Report 9/9 Klima, Norwegian Meteorological Institute, Oslo, 1–27. |
| Gemmer M., Fischer T., Jiang T., et al., 2011: Trends in precipitation extremes in the Zhujiang River basin, South China. J. Climate, 24, 750–761. DOI:10.1175/2010JCLI3717.1 |
| Groisman P. Y., Karl T. R., Easterling D. R., et al., 1999: Changes in the probability of heavy precipitation of heavy precipitation: Important indicators of climatic change. Climate Change, 42, 243–283. DOI:10.1023/A:1005432803188 |
| Hundecha A. Bárdossy, 2005: Trends in daily precipitation and temperature extremes across western Germany in the second half of the 20th century. Int. J. Climatol., 25, 1189–1202. DOI:10.1002/joc.1182 |
| Karl, T. R., 1998: Regional trends and variations of temperature and precipitation.The Regional Impacts of Climate Change. An Assessment of Vulnerability. Watson, R. T., M. C. Zyinyowera, and R. H. Moss, Eds., Cambridge University Press, Cambridge, UK, 411–437. |
| Karl T. R., Knight R. W., 1998: Secular trends of precipitation amount, frequency, and intensity in the United States. Bull. Amer. Meteor. Soc., 79, 231–241. DOI:10.1175/1520-0477(1998)079<0231:STOPAF>2.0.CO;2 |
| Kunkel K. E., 2003: North American trends in extreme precipitation. Natural Hazards, 29, 291–305. DOI:10.1023/A:1023694115864 |
| Liu Y. L., Yan J. P., Cen M. Y., 2015: Comprehensive evaluation of precipitation heterogeneity in China. Acta Geographica Sinica, 70, 392–406. DOI:10.11821/dlxb201503004 |
| Liu Y. L., Yan J. P., Cen M. Y., 2016: The relationship between precipitation heterogeneity and meteorological drought/flood in China. J. Meteor. Res., 30, 758–770. DOI:10.1007/s13351-016-5993-2 |
| Peterson T. C., Taylor M. A., Demeritte R., et al., 2002: Recent changes in climate extremes in the Caribbean region. J. Geophys. Res., 107(D21), ACL 16-1–ACL 16-9. DOI:10.1029/2002Jd002251 |
| Roy S. S., Balling R. C. Jr., 2004: Trends in extreme daily precipitation indices in India. Int. J. Climatol., 24, 457–466. DOI:10.1002/joc.995 |
| Schmidli J., Frei C., 2005: Trends of heavy precipitation and wet and dry spells in Switzerland during the 20th century. Int. J. Climatol., 25, 753–771. DOI:10.1002/joc.1179 |
| Schonwiese, C. D., and J. Rapp, 1997:Climate Trend Atlas of Europe Based on Observations 1891–1990. Kluwer, Dordrecht, The Netherlands, 1–5. |
| Shannon C. E., 1948: A mathematical theory of communication. The Bell System Technical Journal, 27, 379–423. DOI:10.1002/j.1538-7305.1948.tb01338.x |
| Tank A. M. G. K., Peterson T. C., Quadir D. A., et al., 2006: Changes in daily temperature and precipitation extremes in central and South Asia. J. Geophys. Res., 111(D16), D16105. DOI:10.1029/2005JD006316 |
| Vincent L. A., Peterson T. C., Barros V. R., et al., 2005: Observed trends in indices of daily temperature extremes in South America 1960–2000. J. Climate, 18, 5011–5023. DOI:10.1175/JCLI3589.1 |
| Yin Z. Y., Cai Y. L., Zhao X. Y., et al., 2009: An analysis of the spatial pattern of summer persistent moderate-to-heavy rainfall regime in Guizhou Province of Southwest China and the control factors. Theor. Appl. Climatol., 97, 205–218. DOI:10.1007/s00704-008-0060-2 |
| Zhai P. M., Pan X. H., 2003: Change in extreme temperature and precipitation over northern China during the second half of the 20th century. Acta Geographica Sinica, 58, 1–10. |
| Zhai P. M., Sun A. J., Ren F. M., et al., 1999: Changes of climate extremes in China. Climate Change, 42, 203–218. DOI:10.1023/A:1005428602279 |
| Zhai P. M., Zhang X. B., Wan H., et al., 2005: Trends in total precipitation and frequency of daily precipitation extremes over China. J. Climate, 18, 1096–1108. DOI:10.1175/JCLI-3318.1 |
| Zhang D. L., Lin Y. H., Zhao P., et al., 2013: The Beijing extreme rainfall of 21 July 2012: " Right results” but for wrong reasons. Geophys. Res. Lett., 40, 1426–1431. DOI:10.1002/grl.50304 |
| Zhang L. J., Qian Y. F., 2003: Annual distribution features of precipitation in China and their interannual variations. Acta Meteor. Sinica, 17, 146–163. |
| Zhang Q., Xu C. Y., Zhang Z. X., et al., 2010: Changes of atmospheric water vapor budget in the Pearl River basin and possible implications for hydrological cycle. Theor. Appl. Climatol., 102, 185–195. DOI:10.1007/s00704-010-0257-z |
| Zhang X. B., Hogg W. D., Mekis É., 2001: Spatial and temporal characteristics of heavy precipitation events over Canada. J. Climate, 14, 1923–1936. DOI:10.1175/1520-0442(2001)014<1923:SATCOH>2.0.CO;2 |
| Ziegler A. D., Sheffield J., Maurer E. P., et al., 2003: Detection of intensification in global- and continental-scale hydrological cycles: Temporal scale of evaluation. J. Climate, 16, 535–547. DOI:10.1175/1520-0442(2003)016<0535:DOIIGA>2.0.CO;2 |
| Zin W. Z. W., Jemain A. A., 2010: Statistical distributions of extreme dry spell in Peninsular Malaysia. Theor. Appl. Climatol., 102, 253–264. DOI:10.1007/s00704-010-0254-2 |
| Zolina O., Simmer C., Gulev S. K., et al., 2010: Changing structure of European precipitation: Longer wet periods leading to more abundant rainfalls. Geophys. Res. Lett., 37, L06704. DOI:10.1029/2010GL042468 |
 2017, Vol. 31


