The Chinese Meteorological Society
Article Information
- Lili ZHU, Tim LI . 2017.
- A Special MJO Event with a Double Kelvin Wave Structure. 2017.
- J. Meteor. Res., 31(2): 295-308
- http://dx.doi.org/10.1007/s13351-016-6004-3
Article History
- Received January 19, 2016
- in final form September 7, 2016
2. International Pacific Research Center and Department of Atmospheric Sciences, University of Hawaii at Manoa, Honolulu 96822, USA
The Madden–Julian Oscillation (MJO) is a dominant intraseasonal mode in the tropical atmosphere. Since Madden and Julian (1971) first discovered the 30–60-day oscillation of zonal wind in a single station, the three-dimensional structure and evolution characteristics of this low-frequency mode has been comprehensively studied over the last four decades with use of radiosonde, satellite, and reanalysis data (e.g., Weickmann, 1983; Murakami and Nakazawa, 1985; Lau and Chan, 1986; Wang and Rui, 1990; Jiang et al., 2011; Ling and Zhang, 2011; Zeng et al., 2012; Adames and Wallace, 2014). Compared to the original 30–60-day period identified by Madden and Julian (1971, 1972), the MJO period is found more broadband and can span a range of 20–100 days (e.g., Krishnamurti and Subrahmanyam, 1982; Annamalai and Slingo, 2001; Li and Wang, 2005; Zhang, 2005; Waliser, 2006; Lau and Waliser, 2012).
The structure of MJO is characterized by the planetary-scale coupled circulation-convection patterns propagating eastward along the equator (Wang and Rui, 1990; Li and Zhou, 2009). The planetary scale selection is attributed to the wet and dry Kelvin wave interference mechanism proposed by Li and Zhou (2009), in which nonlinear heating differentiates wet and dry Kelvin wave phase speeds in such a way that fast dry Kelvin waves in the non-convective region “catch up” and suppress slower wet Kelvin waves in the convective region to its east, leading to the decay of shorter wavelength perturbations. MJO is characterized by a horizontal pattern of Kelvin–Rossby wave couplet (Wang and Rui, 1990; Hendon and Salby, 1994; Wang and Li, 1994) and a first baroclinic mode vertical structure in the free atmosphere. In the planetary boundary layer (PBL), convergence and vertical motion lead the MJO convection (e.g., Hendon and Sabby, 1994; Wang and Li, 1994; Maloney and Hartmann, 1998). Consistent with the tilting of vertical motion is the phase leading of PBL moisture with respect to MJO convection (Sperber, 2003; Kiladis et al., 2005; see Li, 2014 for a review). A PBL moisture budget analysis indicated that this moisture phase leading results from anomalous vertical advection associated with boundary layer convergence (Hsu and Li, 2012).
In addition to MJO, there are various low-frequency atmospheric modes in the tropics such as convectively coupled Kelvin waves (CCKW). CCKWs propagate at the speed of 10–17 m s–1 (Yang et al., 2007), which is much slower than dry Kelvin wave speed of 50 m s–1. It has been shown that both the mid-tropospheric heating and boundary layer moisture asymmetry can contribute to the reduction of the phase speed (Wang and Li, 2016). Roundy (2012a, b) showed that CCKWs can propagate at a wide continuum of phase speeds associated with different convective intensities; as a result, there is no clear cutoff in eastward-moving low-frequency spectrums that separate CCKWs and MJOs.
An international field campaign named Dynamics of the Madden–Julian Oscillation/Cooperative Indian Ocean Experiment on Intraseasonal Variability in the Year 2011 (DYNAMO/CINDY2011) was conducted in the equatorial Indian Ocean (IO) from October 2011 to March 2012 (Yoneyama et al., 2013). Its main goal is to advance our understanding of MJO initiation processes and to improve MJO prediction. During the campaign period, there were two strong MJO events from mid October to mid December (hereafter referred to as MJO I and MJO II respectively). As seen from the Hovmöller diagram of raw precipitation field along the equator (Fig. 1), MJO II structure is quite unusual. After initiated in the western equatorial Indian Ocean on November 14 (Li et al., 2015), two successive rainbands emerged, and both the rainbands propagate eastward at a similar phase speed across the tropical Indian Ocean (Gottschalck et al., 2013; Kerns and Chen, 2014). This rainfall pattern is quite different from conventional MJO events, which show a single large-scale convective branch.

|
| Figure 1 Hovmöller diagram of unfiltered rainfall field (shading; mm h–1) averaged within 10°S–10°N from 1 October 2011 to 1 January 2012. |
The objective of the current study is to reveal the spatial structure and evolution characteristics of this special MJO event. Science questions to be addressed are as following. What is the anomalous circulation feature associated with MJO II? Do the double rainband structure and phase propagation resemble convectively coupled Kelvin waves? What is the bias if one uses conventional MJO filtering to extract the signal? The remaining part of this paper is organized as follows. In Section 2, data and methodology are introduced. In Section 3, the origin of the double rainband structure associated with MJO II is investigated. In Section 4, the structure and evolution characteristics of the outgoing longwave radiation (OLR) and circulation anomalies associated with the convectively coupled Kelvin wave component are examined. In Section 5, we further compare the above convection and circulation characteristics with those associated with the conventionally filtered MJO component. In Section 6, the summation of the Kelvin wave and MJO modes is examined. Finally, conclusions and discussion are given in Section 7.
2 Data and methodObserved daily OLR (Liebmann and Smith, 1996) during 1979–2013 is used as a proxy for deep convection in the tropics. In addition, wind, specific humidity, and geopotential height fields are extracted from the ECMWF reanalysis (ERA-Interim; Dee et al., 2011). The horizontal resolution for OLR is 2.5° × 2.5°, and for ERA-Interim 1.5° × 1.5°.
We use the Wheeler–Kiladis space–time spectral analysis (Wheeler and Kiladis, 1999) method to isolate the MJO and Kelvin wave signals. Any given field that is function of time and longitude can be transferred into the wavenumber and frequency domain for both eastward and westward propagating waves (e.g., Wheeler and Kiladis, 1999; Roundy and Frank, 2004). The MJO component may be filtered by including eastward zonal wavenumbers 1–4 and periods of 20–80 days, and the Kelvin wave component may be filtered by including eastward wavenumbers 2–14 and periods of 3–20 days [see Wheeler and Kiladis (1999), their Fig. 3b]. Thus, based on the Wheeler–Kiladis spectral filtering method, one may readily separate the MJO component and Kelvin wave component from daily OLR data. Same procedure can be done for other atmospheric variables.
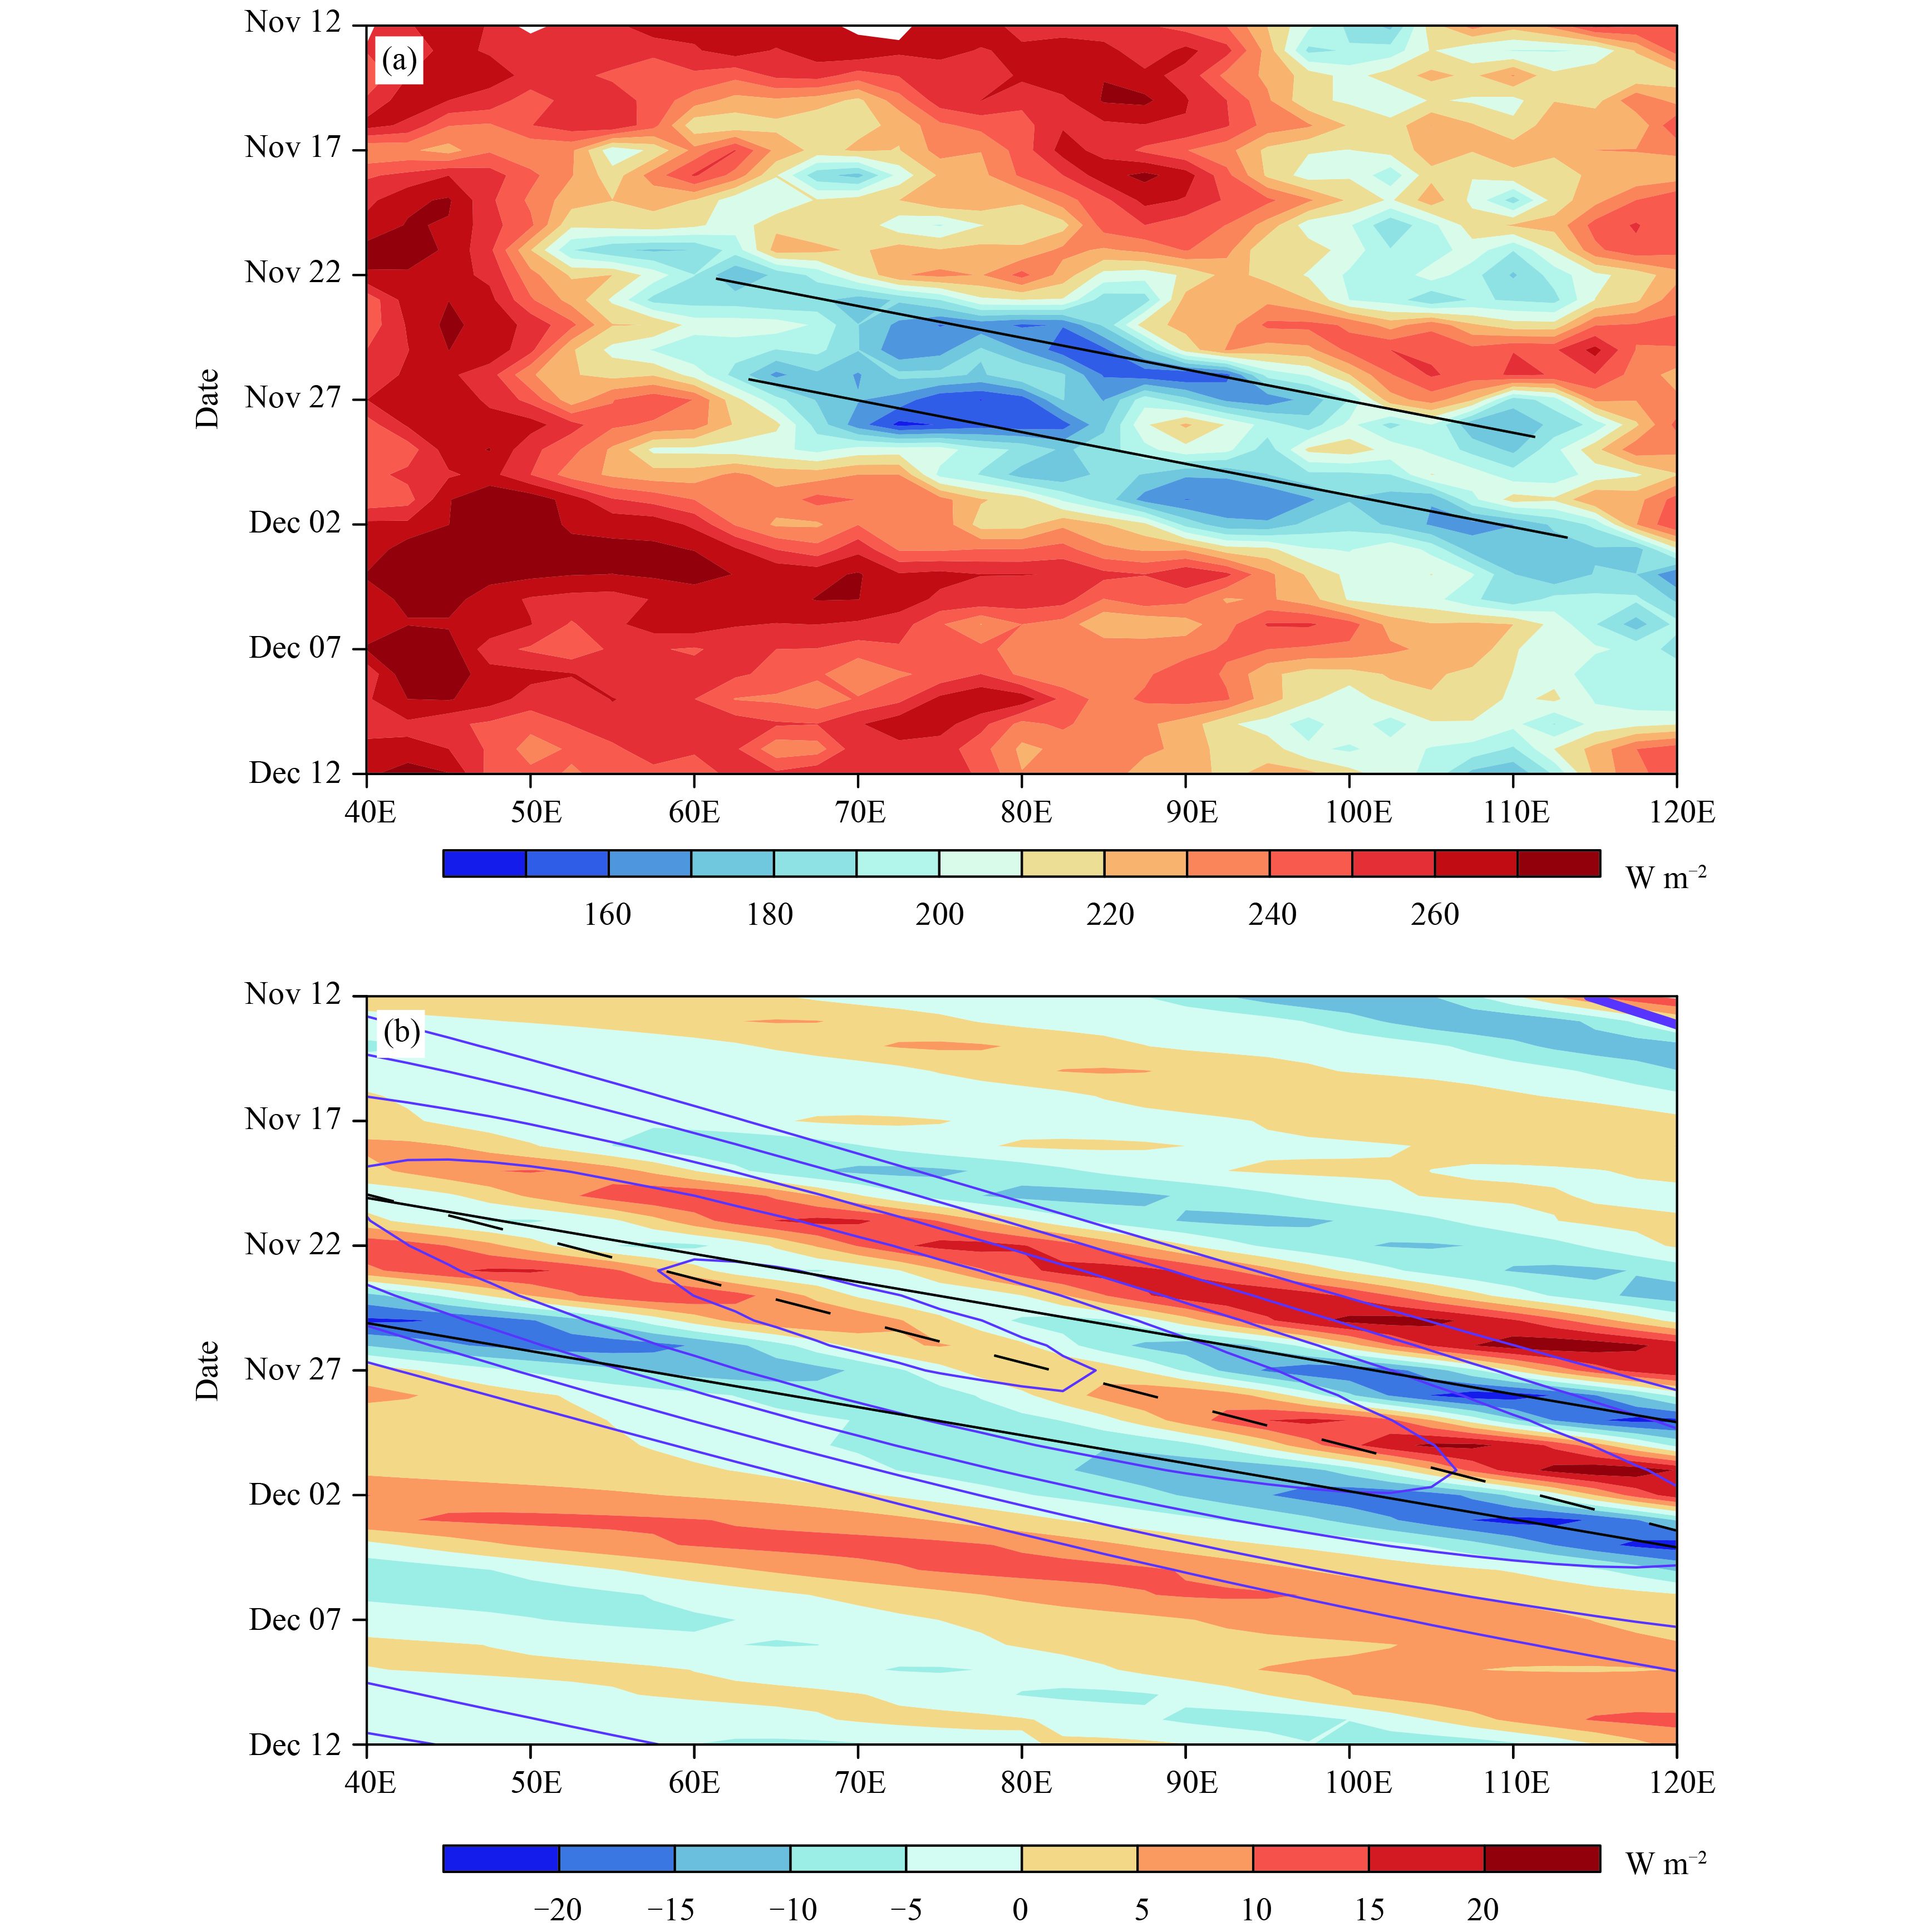
3 Origin of the double rainband structure associated with MJO IIBecause the observed OLR is used as a proxy for the deep convection throughout the paper, we first examine the characteristic OLR evolution pattern associated with the second MJO event during the DYNAMO/CINDY2011 campaign period. The Hovmöller diagram of the raw OLR field along the equator (Fig. 2a) shows that there were clearly two successive convective branches propagating eastward during MJO II. This is consistent with the precipitation field shown in Fig. 1.
|
| Figure 2 Hovmöller diagrams of (a) original OLR field (W m–2) and (b) filtered MJO component (contour; W m–2) and Kelvin wave component (shading; W m–2) of OLR anomalies averaged within 10°S–10°N from 12 November to 12 December 2011. The black solid lines indicate the phase propagation of the raw OLR field in (a) and of the Kelvin wave mode in (b). The black dashed line in (b) indicates the phase propagation of the MJO mode. Contour in (b) from –20 to 0 by 5. |
The phase propagation speed of the dual rainbands is about 7.9 degree (written as ° hereafter) per day, faster than typical MJO phase speed in the warm pool (about 5° per day). Does this imply that MJO II is characterized by prominent Kelvin waves? To address the question, we plotted the MJO component and Kelvin wave component of OLR anomalies separately, with aid of the Wheeler–Kiladis spectral filter. Figure 2b shows that the eastward-propagating OLR or rainfall anomalies during MJO II are indeed part of the convectively coupled Kelvin waves. The filtered Kelvin waves of negative OLR anomalies coincide well with the raw OLR (and dual rainband) signals. The phase propagation speed of the filtered Kelvin wave component (8.9° per day) is close to that of raw OLR and rainfall fields. This phase speed is roughly 11.4 m s–1, slower than the speed in the core of the global OLR spectrum (about 17 m s–1), but consistent with Roundy (2008) that Kelvin waves often evolve more slowly over the Indian Ocean, especially as they evolve through the active convective phase of the MJO. In contrast, the filtered MJO component propagates eastward in a much slower speed (about 5.9° per day). Thus the analysis above indicates that the dual rainband signature in November 2011 is a special MJO event, and it has a dominant convectively coupled Kelvin wave structure with double convective branches 10° apart. In the subsequent section, we will reveal three-dimensional structure associated with this double Kelvin wave event.
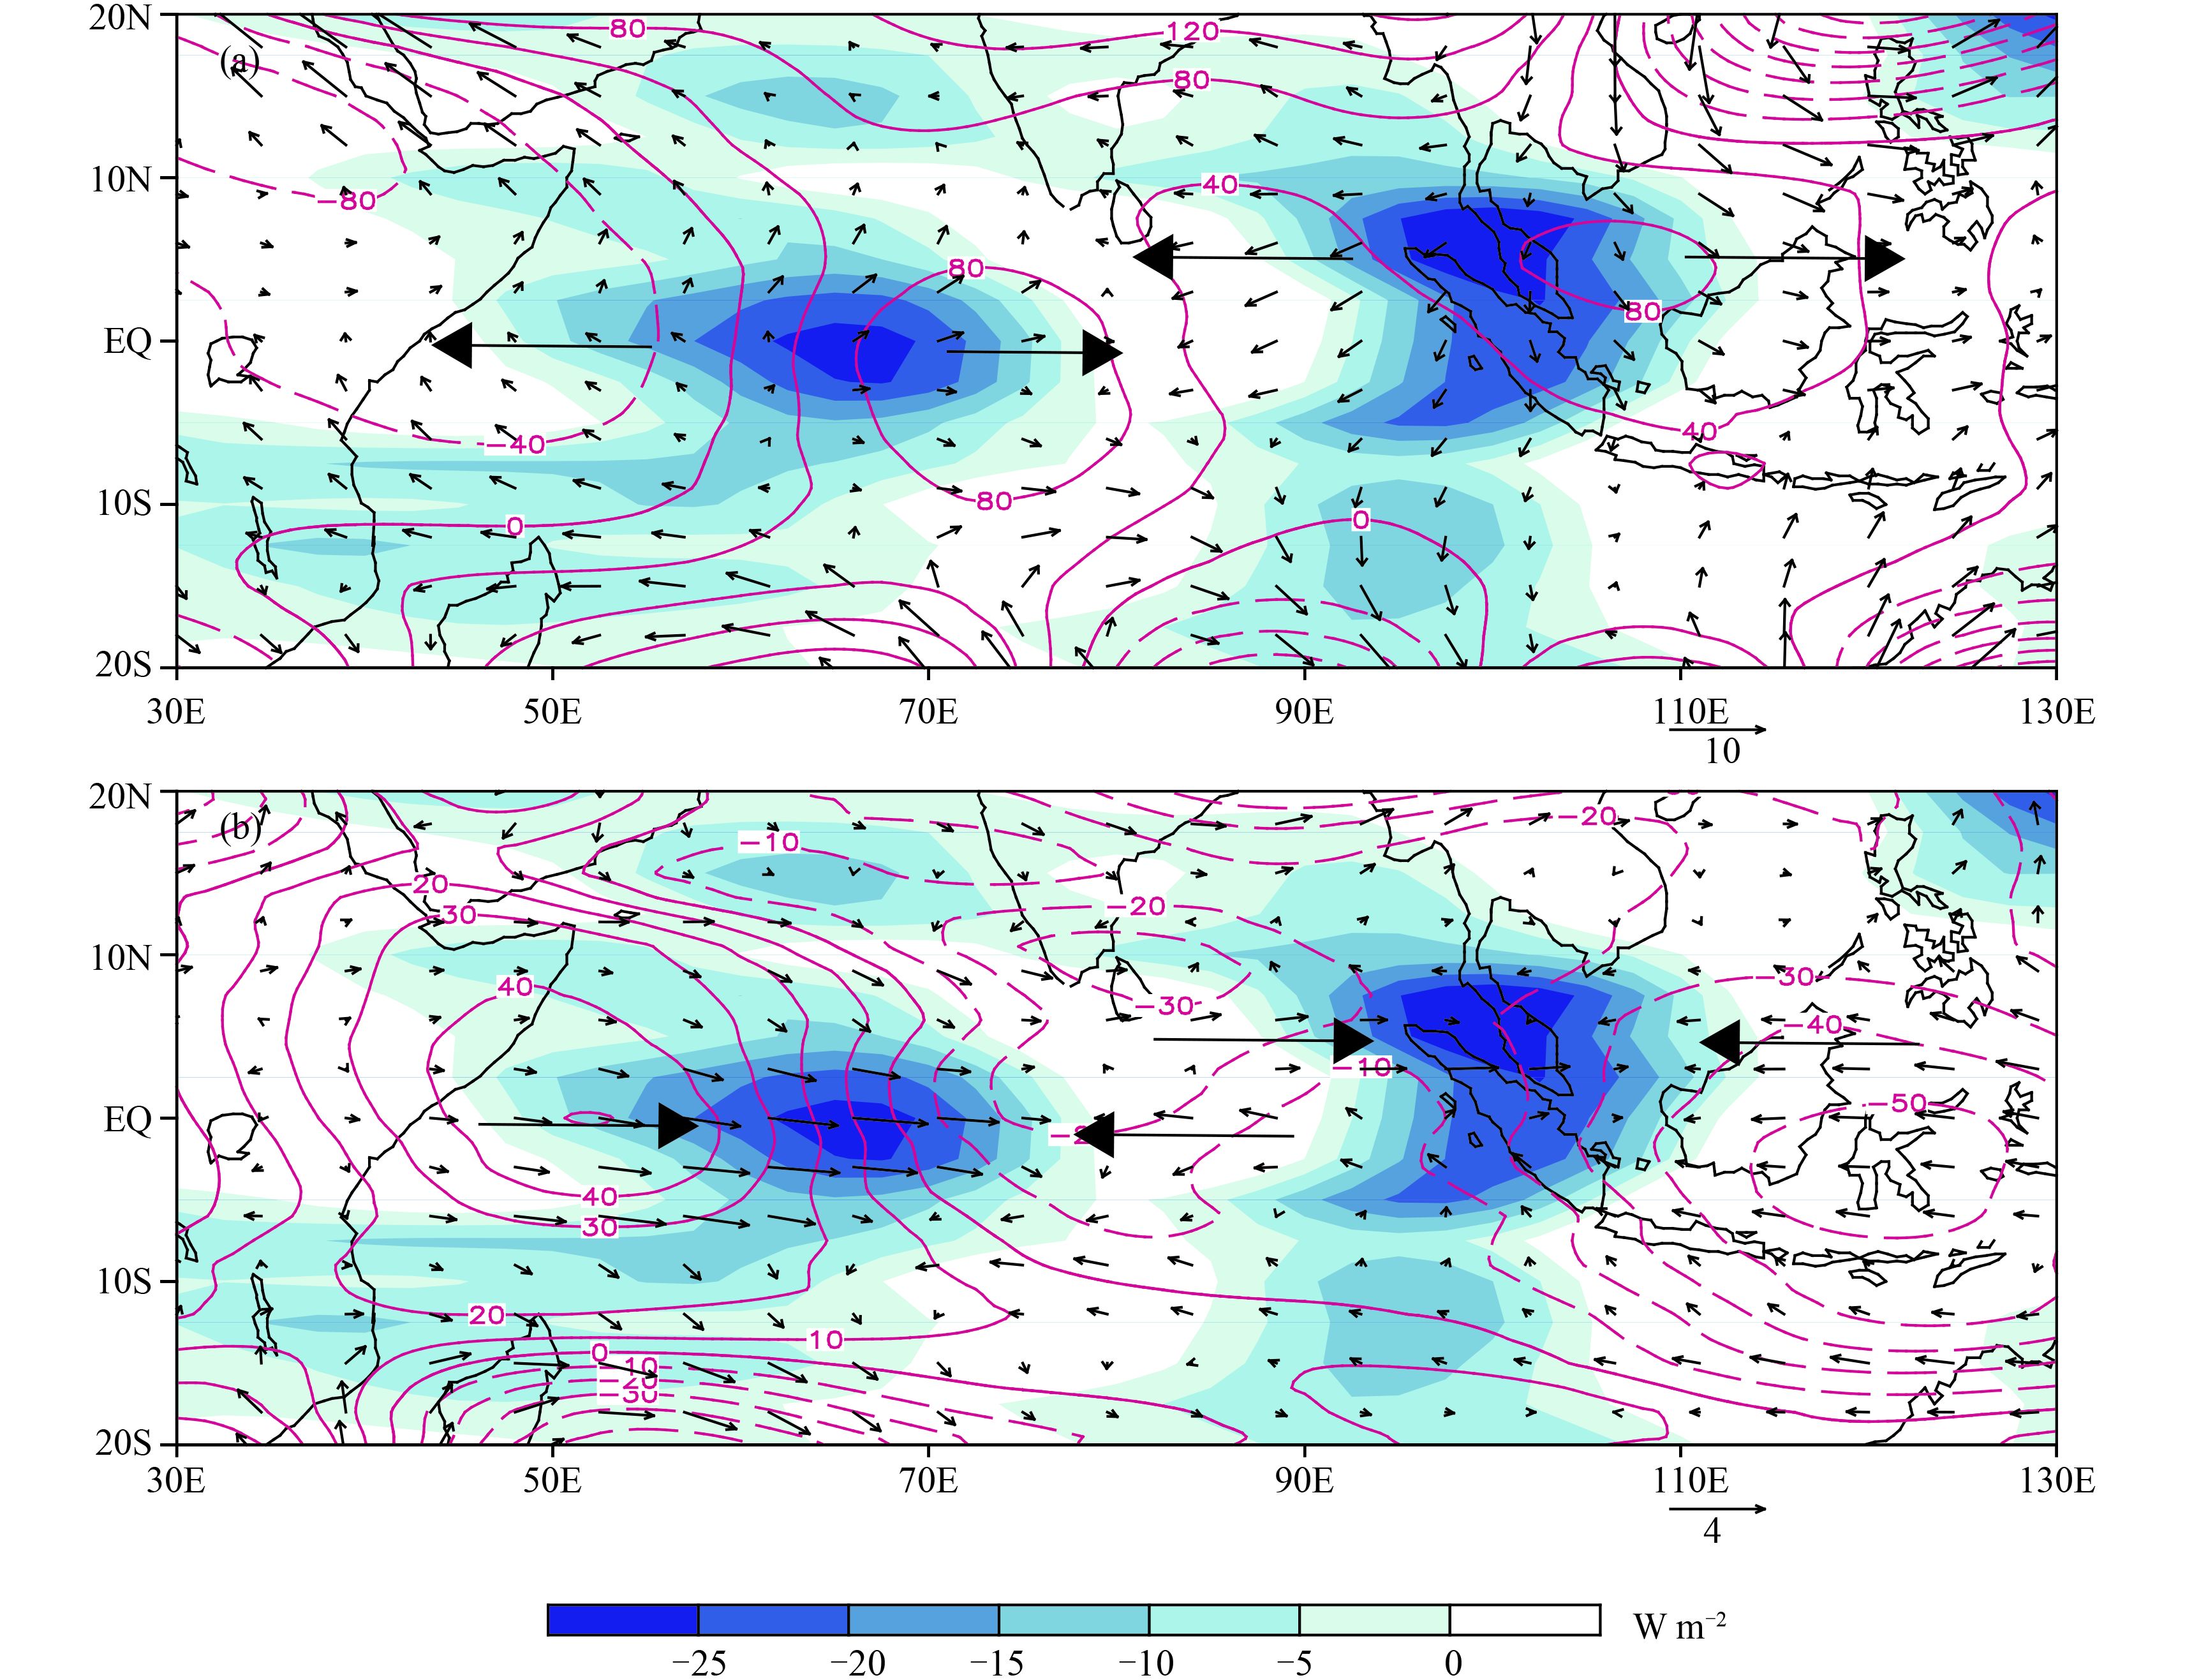
4 Structure and evolution characteristics of the Kelvin wave componentThe horizontal patterns in the upper and lower troposphere associated with the double Kelvin waves on November 27 are shown in Fig. 3. It is clear that there were two anomalous convective branches over the equatorial Indian Ocean. The front one shifted slightly north of the equator, whereas the rear one was right on the equator. To the west of the rear convective branch, an anomalous low (high) pressure center appeared at the equator in the upper (lower) troposphere, accompanied with pronounced easterly (westerly) anomalies. To the east of the front convective branch, an anomalous high (low) pressure center accompanied with westerly (easterly) anomalies appeared in the upper (lower) troposphere. These zonal wind–geopotential height relationships agree well with the equatorial wave theory (Matsuno, 1966). Between the two anomalous convective centers, although being a little complicated, the Kelvin wave zonal wind–geopotential height relationship still held, with westerly (easterly) anomalies being in phase with a high (low) pressure anomaly immediately to the east of the rear convection and easterly (westerly) anomalies being in phase with a low (high) pressure immediately to the west of the front convection in the upper (lower) troposphere.
|
| Figure 3 The horizontal patterns of the OLR anomaly (shading; W m–2), geopotential anomaly (contour; m2 s–2), and wind anomaly (vector; m s–1) fields at (a) 200 and (b) 850 hPa in association with the Kelvin wave component on 27 November 2011. |
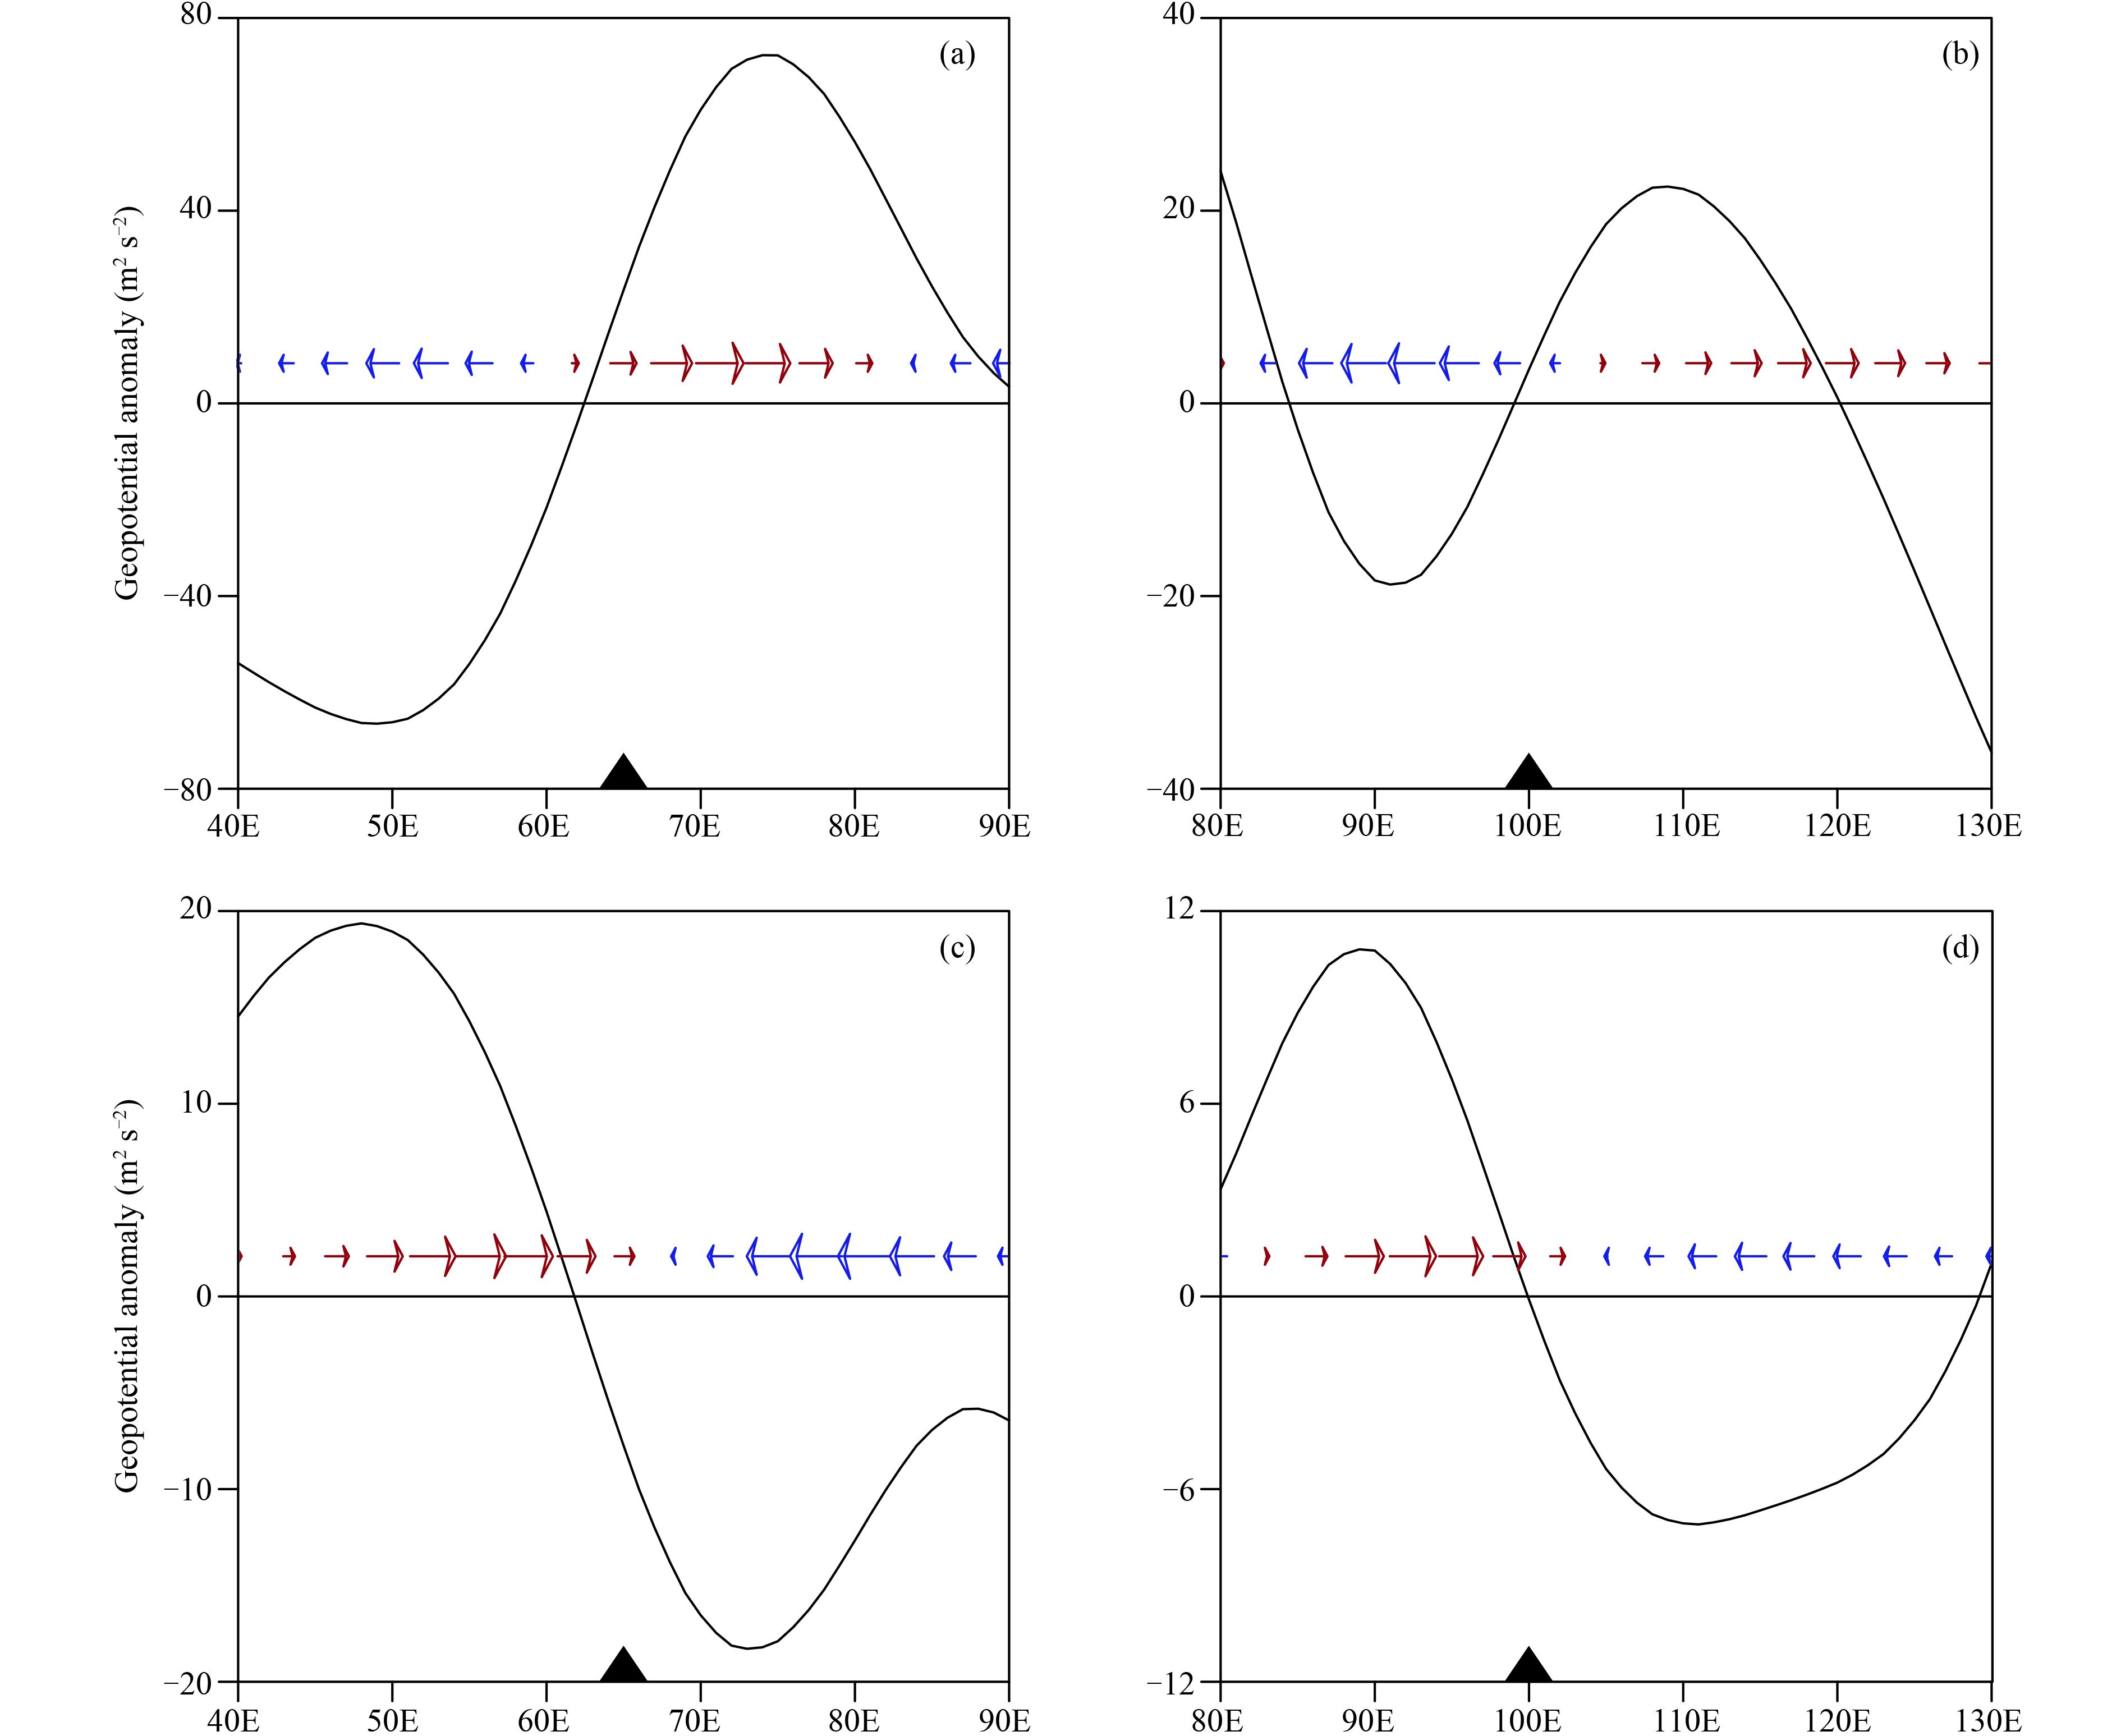
To show more clearly the Kelvin wave zonal wind-geopotential relationship, we plotted the zonal wind and geopotential height anomalies for two convective centers separately (Fig. 4). Due to slight northward shift of the front convective center, the latitudinal band from 0° to 5°N is used for calculating the longitudinal profiles for the front convective branch, whereas the latitudinal band from 5°S to 5°N is used for calculating the longitudinal profiles for the rear convective branch. It is seen clearly that for both the convective branches, low-level westerly (easterly) wind anomalies are approximately in phase with a relative high (low) pressure center. This phase relationship is held for lower-level (e.g., 700 hPa) and also for the upper troposphere (e.g., 250 hPa). Thus the circulation anomalies exhibit a first baroclinic mode vertical structure, with the upper-level wind anomalies being opposite to those at the low level. The convection is in quadrant with the zonal wind in upper and lower levels, implying that mid-tropospheric ascending motion is in phase with low-level convergence and upper-level divergence. All the structure characteristics are consistent with the convectively coupled Kelvin waves (Straub and Kiladis, 2003; Nasuno et al., 2008; Wang and Li, 2016).
|
| Figure 4 The zonal distributions of zonal wind (vector; m s–1) and geopotential (solid lines; m2 s–2) anomalies (with zonal mean values removed) along (a, c) 5°S–5°N and (b, d) 0°–5°N at (a, b) 250 and (c, d) 700 hPa in association with the Kelvin wave component on 27 November 2011. The black triangles indicate the anomalous convection centers. |
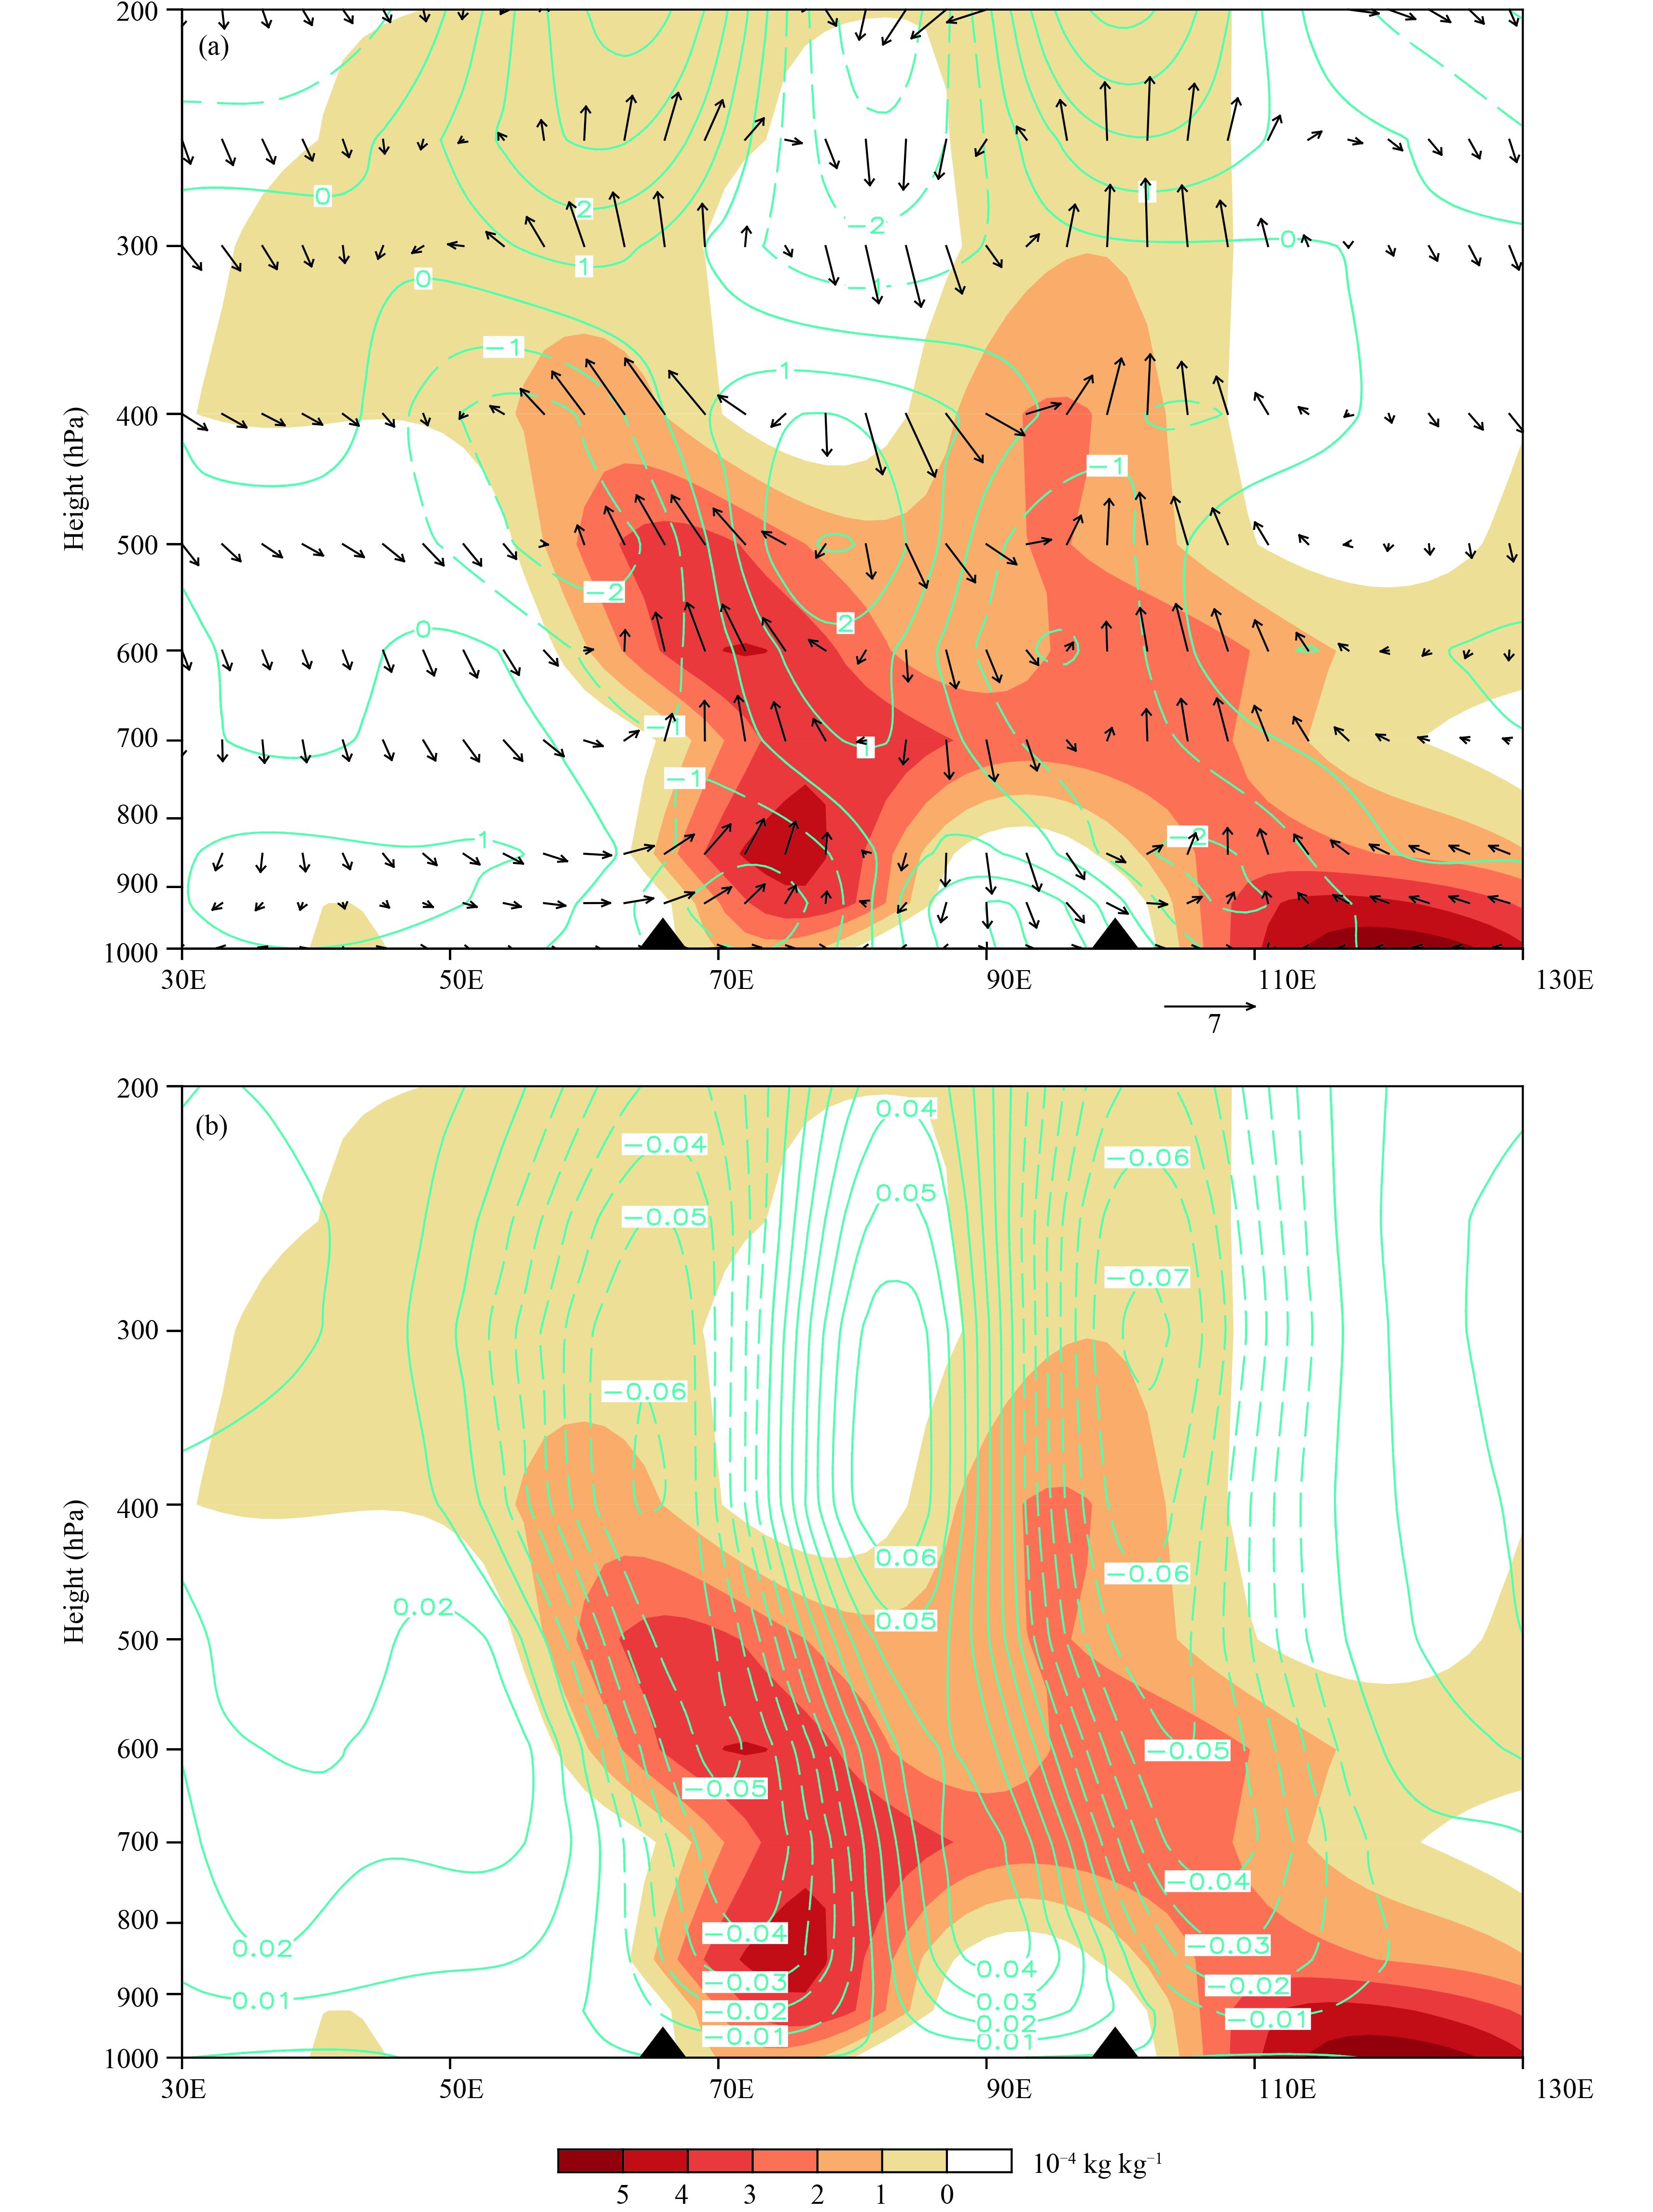
The zonal-vertical distributions of the anomalous vertical velocity and moisture fields show a slightly tilting vertical structure over the two convective centers (Fig. 5). Both the vertical motion and specific humidity anomalies tilted westward with height. A positive specific humidity anomaly center appeared in PBL (below 800 hPa). This PBL moisture anomaly led the convection, while the mid-tropospheric (near 600 hPa) moisture anomaly was in phase with the convection. Maximum ascending motion centers appeared near 300 hPa and were in phase with the OLR minimum centers. Immediately below (above) the centers were anomalous convergence (divergence) centers due to mass continuation. While the strongest ascending motion anomalies appeared in the upper troposphere, both the vertical motion and convergence anomalies in the PBL led the convections. The in-phase relationship between the PBL moisture and ascending motion anomalies implies that the moistening was attributed to the vertical advection of mean specific humidity gradient by anomalous ascending motion, as demonstrated by Hsu and Li (2012) and Wang and Li (2016).
|
| Figure 5 Zonal-vertical distributions along 0°–5°N of (a) specific humidity anomaly (shading; 10–4 kg kg–1), divergence anomaly (contour; 10–6 s–1), u wind and vertical velocity anomalies (vector; m s–1) [with the vertical velocity (Pa s–1) being multiplied by –100], and (b) specific humidity anomaly (shading; 10–4 kg kg–1) and vertical velocity anomaly (contour; Pa s–1), in association with the Kelvin wave component on 27 November 2011. The black triangles indicate the anomalous convection centers. |
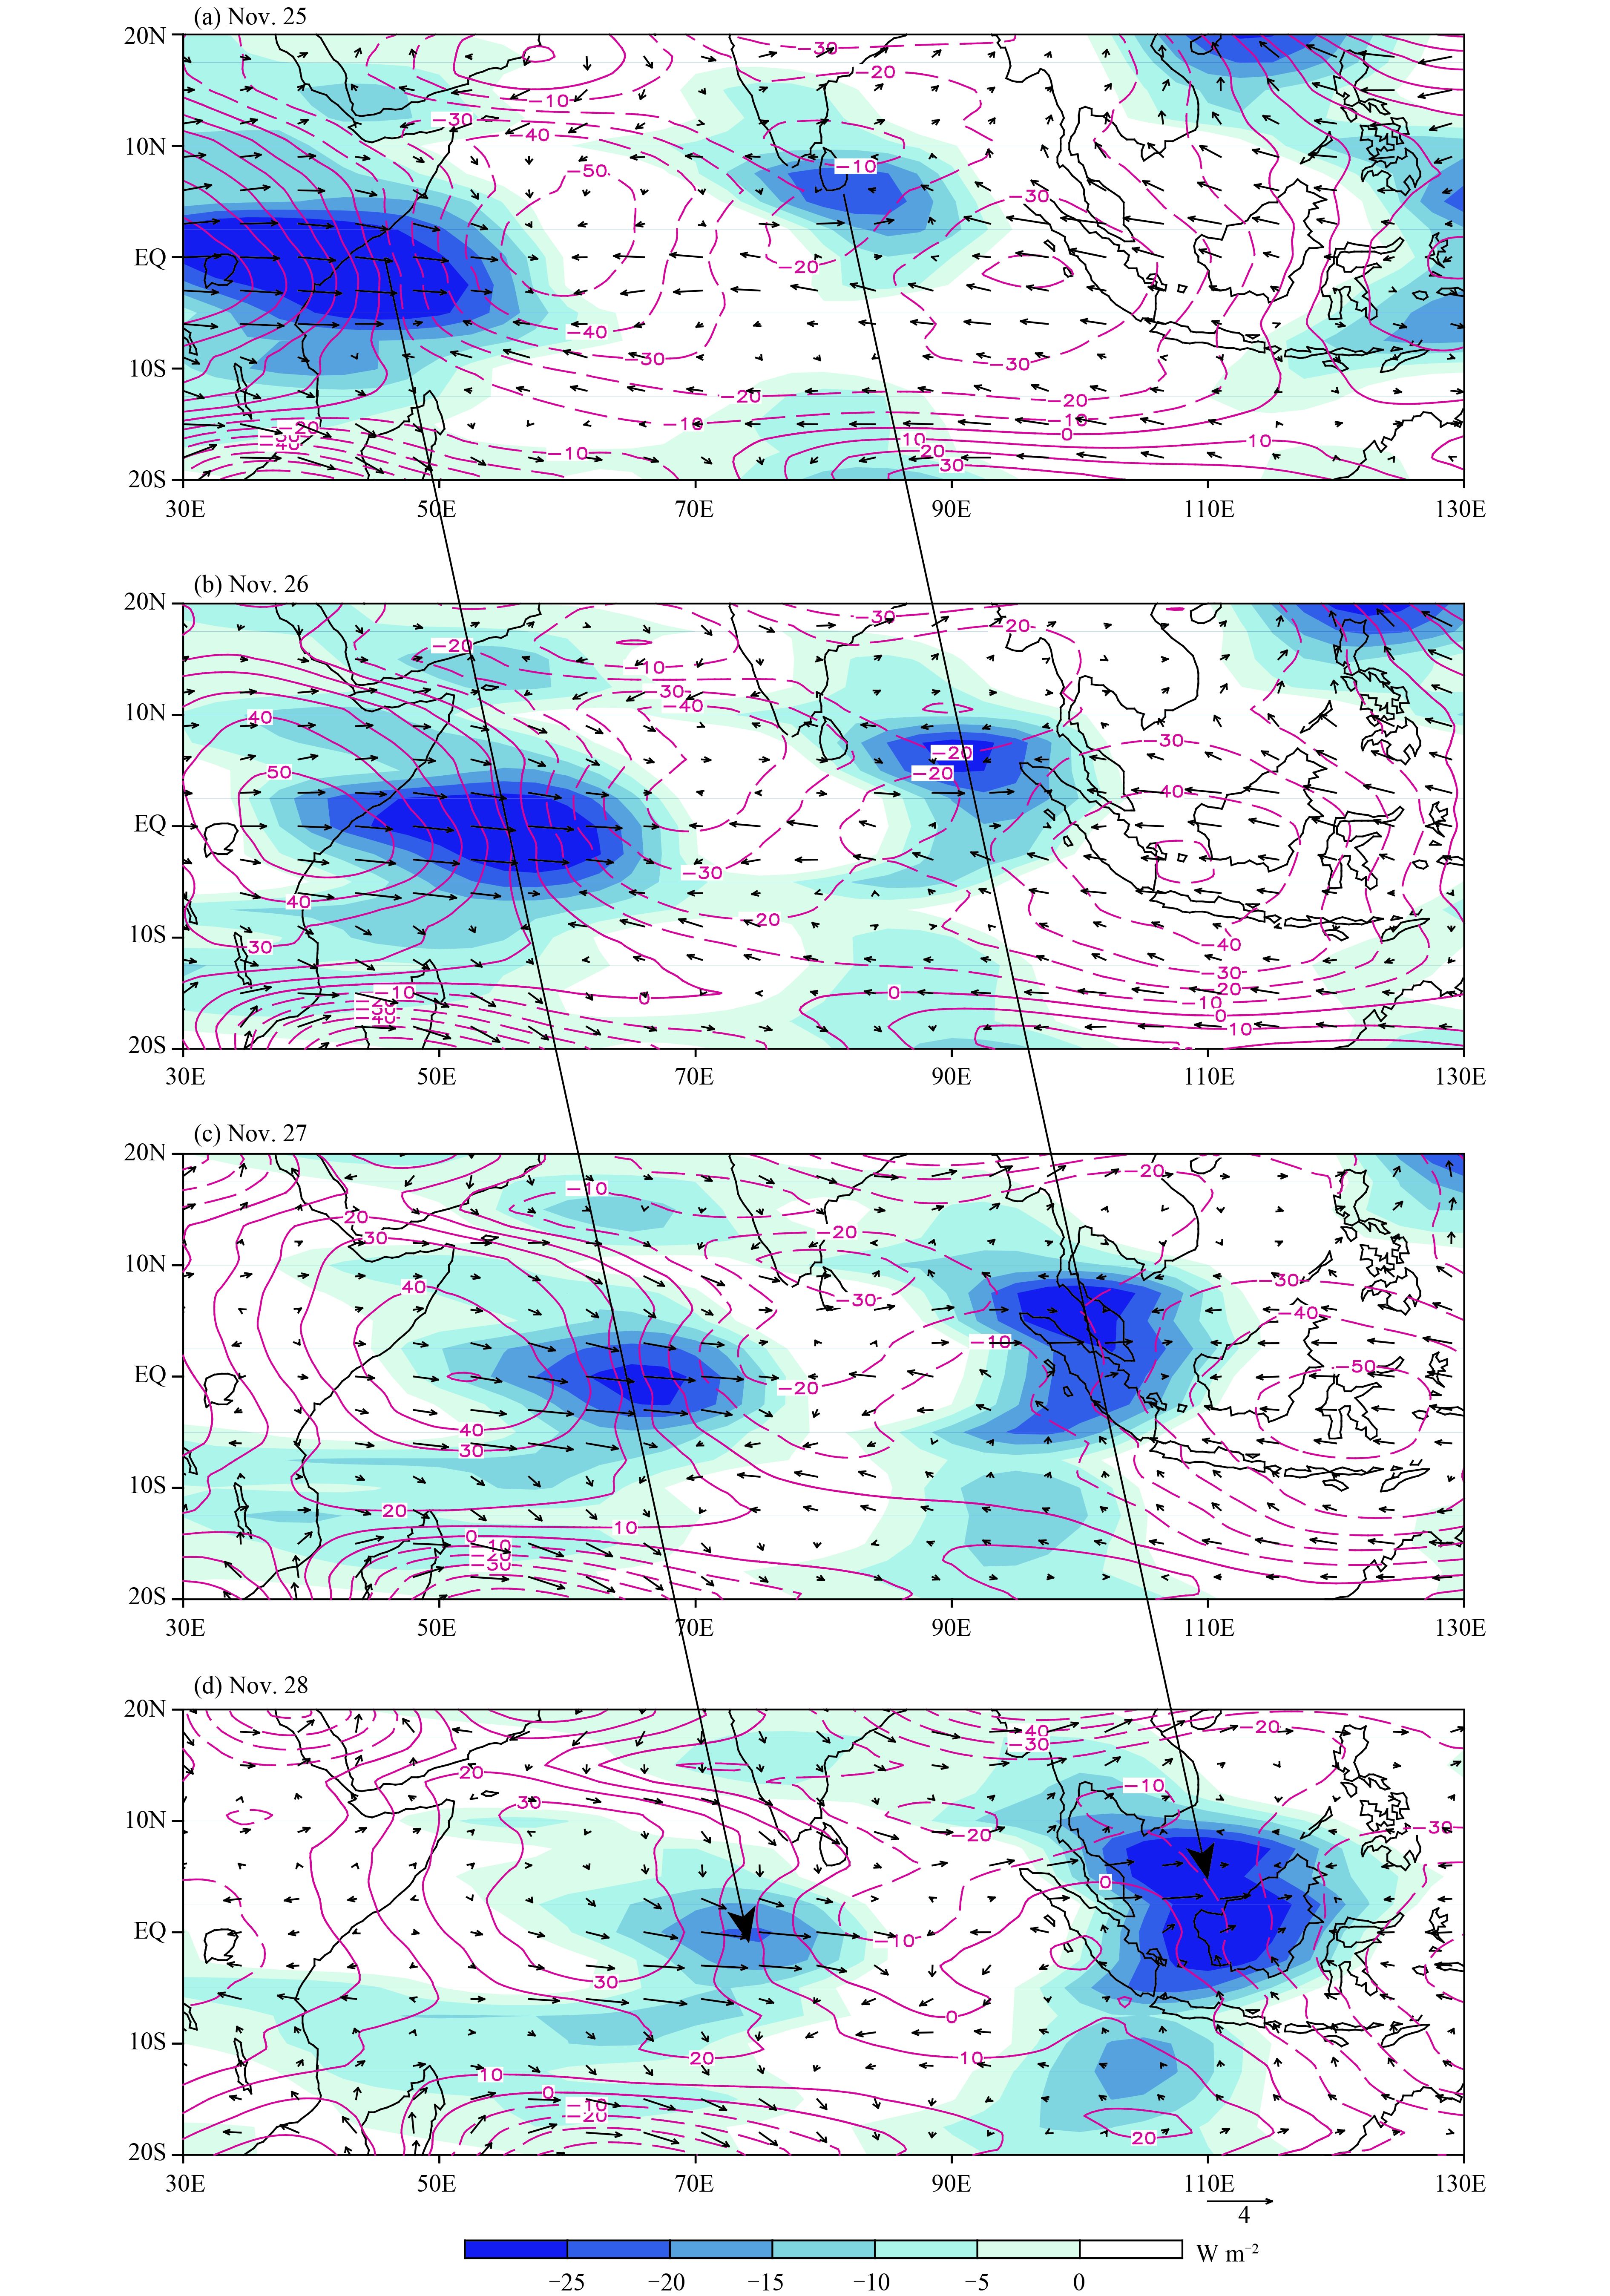
The temporal evolutions of horizontal patterns of the double Kelvin waves are displayed in Fig. 6. It is clearly seen that the two convective branches moved shoulder to shoulder toward the east, at a similar phase speed. On November 25, the rear convective branch was quite strong, while the front convective branch was much weaker and its center shifted north of the equator. During their eastward journey, the rear convection was weakened, while the front convection became stronger and stronger, and its center shifted more toward the equator. On November 28, the intensity of the front convection exceeded that of the rear one. Later, the rear convection was re-developed again, as the convective center moved to the eastern Indian Ocean/Maritime Continent sector, as seen from Fig. 2b.
|
| Figure 6 Evolutions of the OLR anomaly (shading; W m–2), geopotential anomaly (contour; m2 s–2), and 850-hPa wind anomaly (vector; m s–1) fields in relevance to the Kelvin wave component on (a) 25, (b) 26, (c) 27, and (d) 28 November 2011. |
The special feature of the double rainband structure associated with MJO II raises an important question, namely, can one see such a feature from the conventional MJO filter in the wavenumber-frequency diagram? If not, should we still call this a MJO event, or a double Kelvin wave event?
Figure 7 shows the convection and circulation anomalies at 200 and 850 hPa on November 27 associated with the filtered MJO component. It shows a conventional horizontal pattern of Rossby–Kelvin wave couplet in response to the MJO heating. To the west of the MJO convection, two anticyclonic (cyclonic) Rossby wave gyres appeared on both sides of the equator in the upper (lower) troposphere, with pronounced easterly (westerly) anomalies near the equator. To the east of the MJO convection, the Kelvin wave response occurred in the upper (lower) troposphere, accompanied with pronounced westerly (easterly) and high (low) pressure anomalies. Obviously, observed double rainband and double OLR convection patterns shown in Figs. 1, 2, and 3 are missing in this analysis. This points out that it is incomplete to use the MJO filter to describe this special event.

|
| Figure 7 The horizontal patterns of the OLR anomaly (shading; W m–2), the geopotential anomaly (contour; m2 s–2), and wind anomaly (vector; m s–1) fields at (a) 200 and (b) 850 hPa on November 27 in association with the MJO component. |
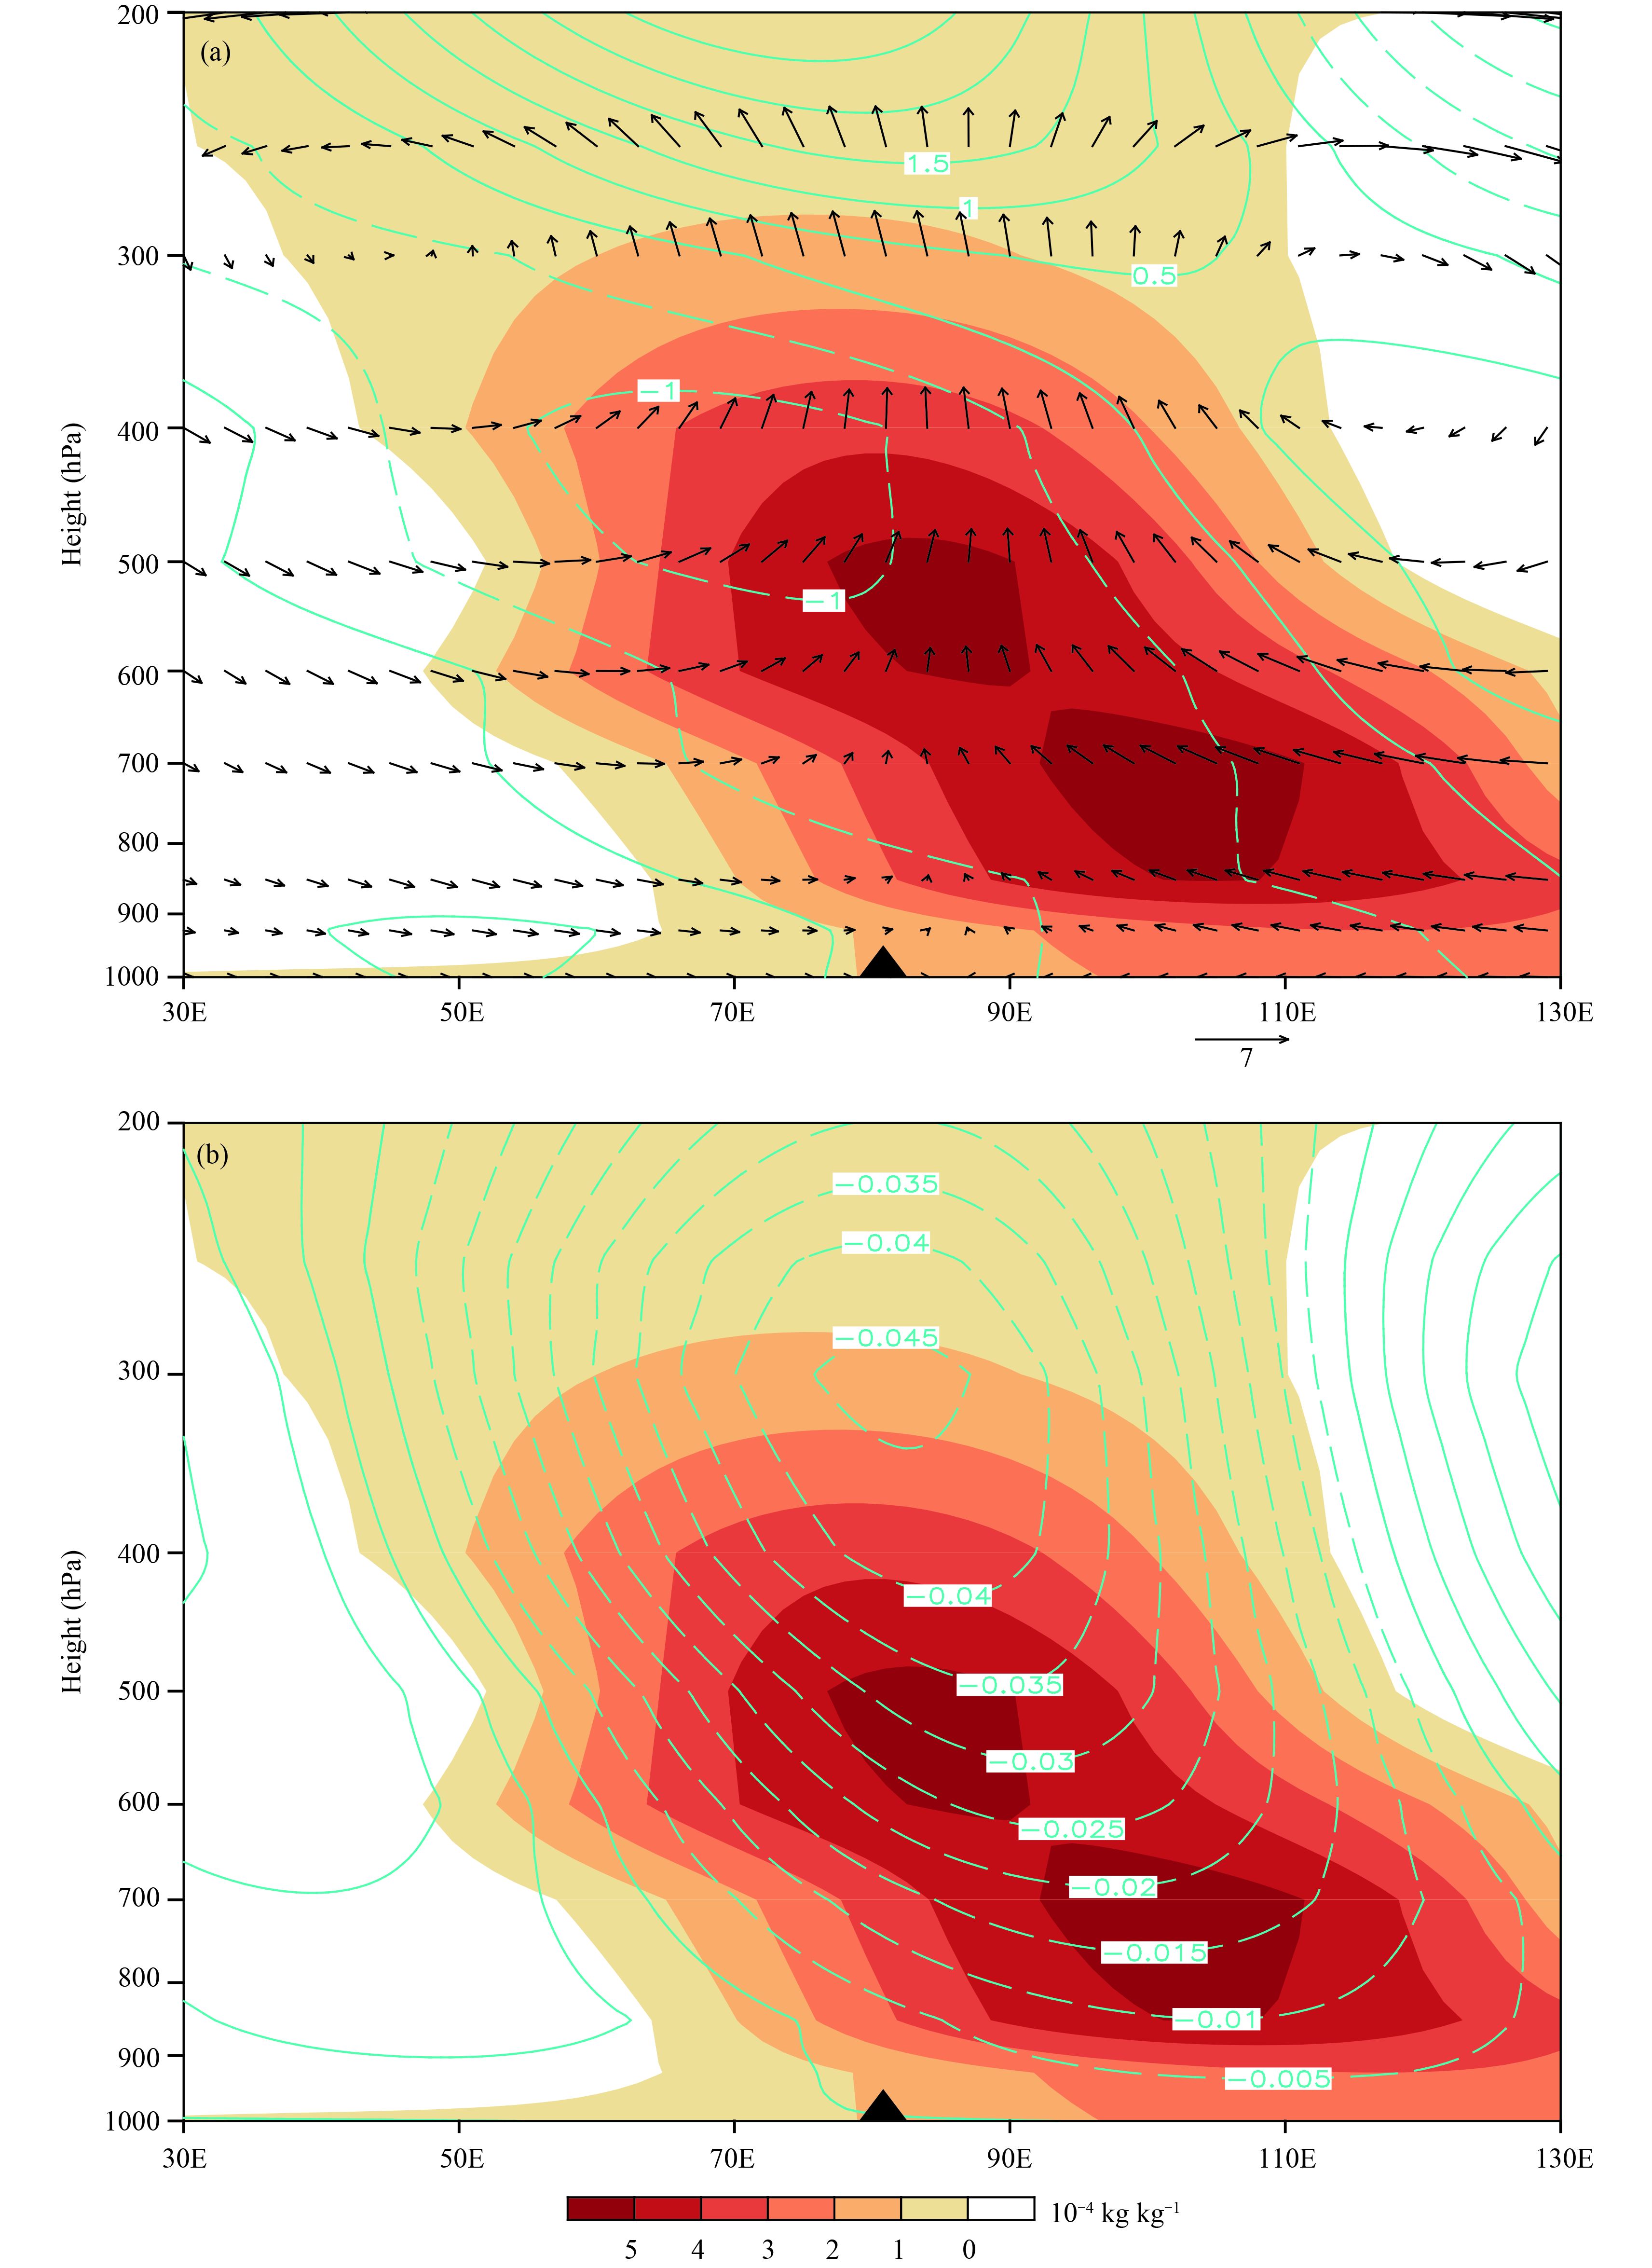
The zonal-vertical distributions of anomalous specific humidity, divergence and vertical velocity fields in Fig. 8 show a longitudinally smoothed version of Fig. 5, that is, a single branch of larger-scale vertical velocity and specific humidity anomaly fields. Westerly (easterly) anomalies were pronounced in the lower-to-middle (upper) troposphere to the west of the MJO convective center, while easterly (westerly) anomalies appeared in the lower (upper) troposphere to the east of the MJO convective center. While the strongest ascending motion anomaly appeared at 300 hPa and was in phase with the OLR minimum center, vertical motion anomaly tilted eastward toward lower troposphere. The asymmetry of the ascending motion at top of the PBL was consistent with a pronounced zonal asymmetry in the PBL convergence. The structure characteristics are in general consistent with those described in Hsu and Li (2012). Again the missing of the double vertical cell structure in the vertical velocity and moisture fields suggests the incomplete treatment of the data.
|
| Figure 8 As in Fig. 5, but for zonal–vertical distributions along 10°S–5°N of (a) specific humidity anomaly, divergence anomaly, and zonal wind and vertical velocity anomalies and (b) specific humidity anomaly and vertical velocity anomaly associated with the MJO component. The triangle indicates the MJO convection center. |
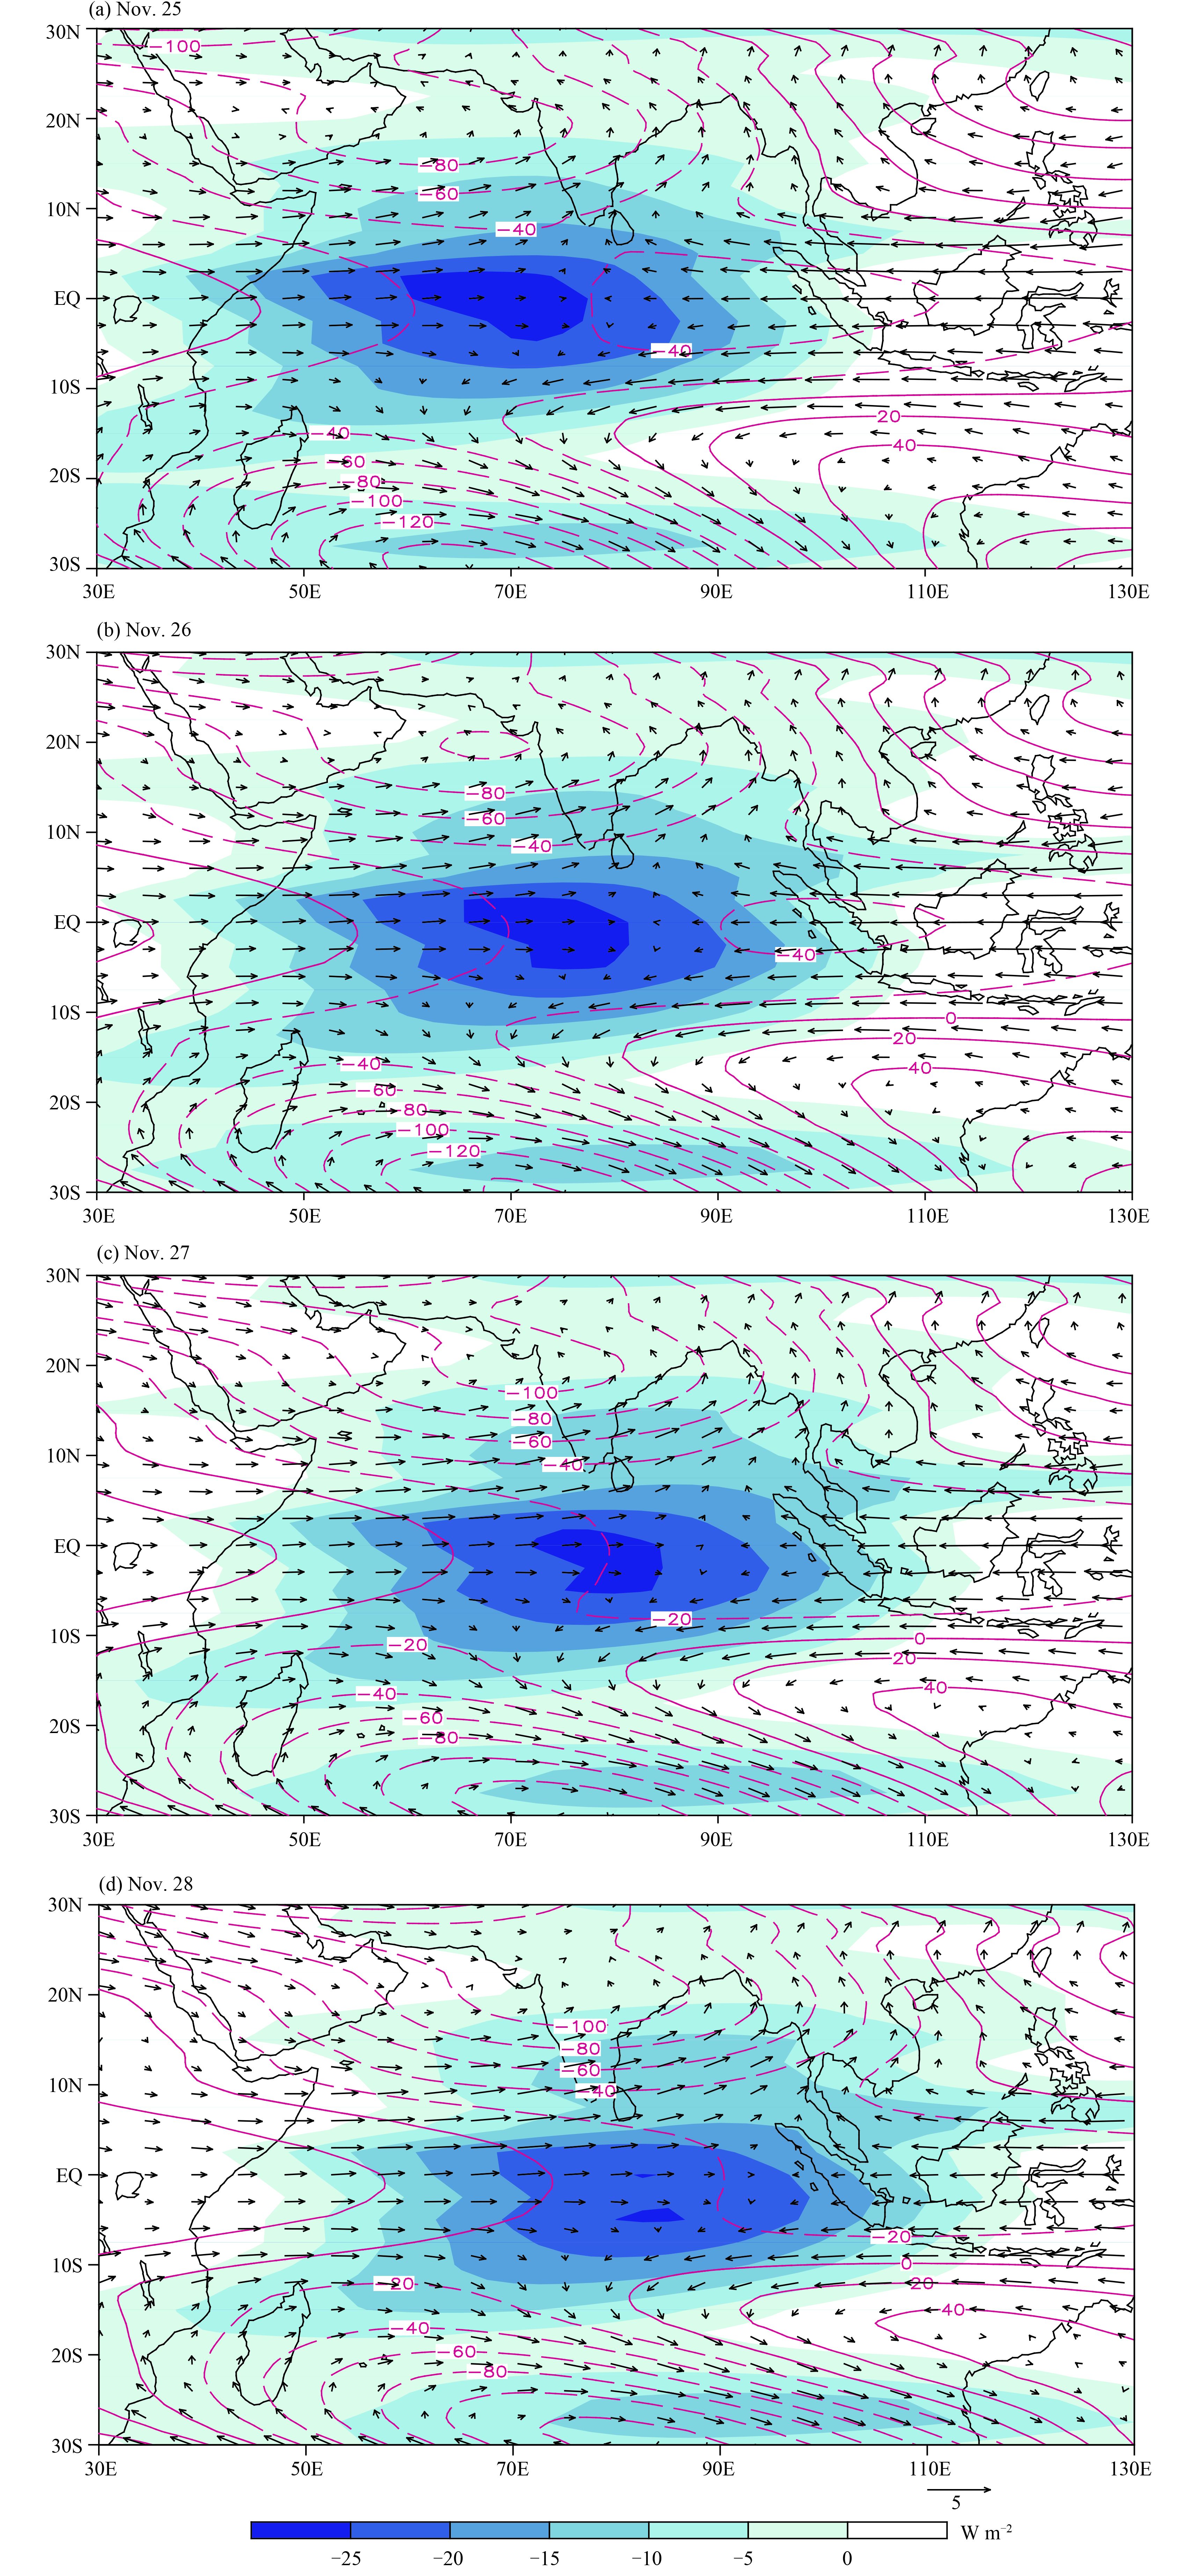
Figure 9 shows the horizontal evolution patterns of the filtered MJO component OLR and low-level circulation fields. Note that there are no double convective branches and associated double Kelvin wave structure. It is just like a conventional MJO pattern. The eastward propagation speed of the filtered OLR anomaly is about 5.9 degree per day, far slower than the observed rainband phase speed.
|
| Figure 9 As in Fig. 6, but for evolutions of the OLR anomaly, 850-hPa geopotential anomaly, and wind anomaly fields associated with the MJO component. |
Figure 10 illustrates the pattern of the combined Kelvin wave and MJO mode. It is noted that the Kelvin wave signal superimposed on the MJO signal together represents, to the large extent, the total low-frequency anomaly field. Thus, this special event is a combined Kelvin–MJO wave mode.

|
| Figure 10 The horizontal pattern of the OLR anomaly (W m–2) field in association with the combined Kelvin wave and MJO components on 27 November 2011. The rectangular box indicates the correlation analysis region (10°S–10°N, 60°–100°E). |
The relative role of the MJO mode and the Kelvin wave mode in forming the structure of this special event may be estimated based on pattern correlation coefficient. Note that both the original OLR field and the combined Kelvin–MJO mode structure have two separate rainfall/OLR centers, and both the patterns look more like that of the double Kelvin waves. In fact, the pattern correlation coefficient between the combined pattern and the individual Kelvin wave and MJO component is 0.89 and 0.34 in the tropical Indian Ocean domain (10°S–10°N, 60°E–100°E). This indicates that the Kelvin wave mode is a major contributor to the horizontal structure of this special low-frequency event. Without retaining the Kelvin wave mode, the double rainband structure would be missing. Therefore a caution is needed to filter out low-frequency signals from the original raw data. A comparison of the filtered data to the observed field is needed to make sure that the derived field matches the observed circulation feature.
7 Conclusions and discussionThe Hovmöller diagram of the observed precipitation field along the equator shows a clear double rainband structure during the second MJO event of the DYNAMO/CINDY2011 field campaign. By decomposing the raw data into a Kelvin wave component and a MJO component by using the Wheeler–Kiladis wavenumber-frequency spectral analysis method, we demonstrate that the dual rainbands are of the Kelvin wave component. While the large-scale convective envelope associated with the MJO component propagates at a phase speed of approximately 5.9º per day, the propagation speed of the convectively coupled Kelvin waves is 8.9º per day, close to that of the observed dual rainbands.
The three-dimensional circulation structure associated with the Kelvin wave component is examined. There were two anomalous convective centers along the equatorial Indian Ocean in late November 2011. To the west of both the convective centers, there were an anomalous low (high) pressure center and anomalous easterlies (westerlies) in the upper (lower) troposphere. Opposite signs of the pressure and wind anomalies were found to the east of the convective centers. As a result, the zonal wind and geopotential height anomaly fields are approximately in phase along the equator, being consistent with the Matsuno (1966) free wave solution. While the wind and height anomalies in free atmosphere show a prominent first baroclinic mode vertical structure, the anomalous specific humidity and vertical velocity exhibit an eastward tilting from middle troposphere to PBL, that is, the vertical motion and specific humidity anomalies in middle troposphere were in phase with the convection, they led the convection in the PBL.
The circulation patterns derived from the MJO component were very different from those described above. No double convective centers occurred, as the system moved across the equatorial Indian Ocean. Rather a conventional MJO structure characterized by the horizontal pattern of a Kelvin–Rossby wave couplet as shown in Hsu and Li (2012) appeared in the equatorial Indian Ocean. The failure to match both the rainfall propagation speed and horizontal pattern indicates that a caution is needed when one extracts low-frequency signals by using different filters. It is necessary to validate the filtered data against the observations, to make sure that they correctly represent observed circulation structure and evolution characteristics.
An interesting issue related to the MJO II is what caused the formation of double Kelvin waves? A further observational and modeling study is needed to address this issue. It is noted that the same double rainband structure also occurred in other time, such as April 1990. Our preliminary analysis shows that the dual rainband event in April 1990 was also associated with the Kelvin wave mode, and it had a similar phase speed. Another issue is whether or not the Kelvin wave signals were identifiable before they entered the MJO convective envelope. Our analysis shows that the Kelvin wave signal did exist, suggesting that the Kelvin wave mode was independent of the MJO. The third issue related to the Kelvin wave vertical structure is what caused the phase leading of the boundary layer vertical motion and moisture. We speculate that such a phase leading resulted from the zonal asymmetry of the boundary layer convergence induced by Kelvin wave low pressure anomaly at top of PBL east of the convective center. In the future study we will validate this hypothesis through the diagnosis of the boundary layer momentum budget and the lower tropospheric moisture budget.
Acknowledgments . Constructive comments provided by Dr. Paul Roundy and anonymous reviewers were greatly appreciated. The authors thank Drs. Pang-Chi Hsu and Mingcheng Chen for discussions.
| Adames Á. F., Wallace J. M., 2014: Three-dimensional structure and evolution of the MJO and its relation to the mean flow. J. Atmos. Sci., 71, 2007–2026. DOI:10.1175/JAS-D-13-0254.1 |
| Annamalai H., Slingo J. M., 2001: Active/break cycles: Diagnosis of the intraseasonal variability of the Asian summer monsoon. Climate Dyn., 18, 85–102. DOI:10.1007/s003820100161 |
| Dee D. P., Uppala S. M., Simmons A. J., et al., 2011: The ERA-Interim reanalysis: Configuration and performance of the data assimilation system. Quart. J. Roy. Meteor. Soc., 137, 553–597. DOI:10.1002/qj.828 |
| Gottschalck J., Roundy P. E., Schreck III C. J., et al., 2013: Large-scale atmospheric and oceanic conditions during the 2011–12 DYNAMO field campaign. Mon. Wea. Rev., 141, 4173–4196. DOI:10.1175/MWR-D-13-00022.1 |
| Hendon H. H., Salby M. L., 1994: The life cycle of the Madden–Julian Oscillation. J. Atmos. Sci., 51, 2225–2237. DOI:10.1175/1520-0469(1994)051<2225:TLCOTM>2.0.CO;2 |
| Hsu P.-C., Li T., 2012: Role of the boundary layer moisture asymmetry in causing the eastward propagation of the Madden–Julian Oscillation. J. Climate, 25, 4914–4931. DOI:10.1175/JCLI-D-11-00310.1 |
| Jiang X. A., Waliser D. E., Olson W. S., et al., 2011: Vertical diabatic heating structure of the MJO: Intercomparison between recent reanalyses and TRMM estimates. Mon. Wea. Rev., 139, 3208–3223. DOI:10.1175/2011MWR3636.1 |
| Kerns B. W., Chen S. S., 2014: Equatorial dry air intrusion and related synoptic variability in MJO initiation during DYNAMO. Mon. Wea. Rev., 142, 1326–1343. DOI:10.1175/MWR-D-13-00159.1 |
| Kiladis G. N., Straub K. H., Haertel P. T., 2005: Zonal and vertical structure of the Madden–Julian Oscillation. J. Atmos. Sci., 62, 2790–2809. DOI:10.1175/JAS3520.1 |
| Krishnamurti T. N., Subrahmanyam D., 1982: The 30–50-day mode at 850 mb during MONEX. J. Atmos. Sci., 39, 2088–2095. DOI:10.1175/1520-0469(1982)039<2088:TDMAMD>2.0.CO;2 |
| Lau K.-M., Chan P. H., 1986: Aspects of the 40–50-day oscillation during the northern summer as inferred from outgoing longwave radiation. Mon. Wea. Rev., 114, 1354–1367. DOI:10.1175/1520-0493(1986)114<1354:AOTDOD>2.0.CO;2 |
| Lau K.-M., Waliser D. E., 2012: Intraseasonal Variability in the Atmosphere–Ocean Climate System. 2nd Ed. Springer, Berlin Heidelberg, 613 pp. DOI:10.1007/978-3-642-13914-7 |
| Li T., 2014: Recent advance in understanding the dynamics of the Madden–Julian Oscillation. J. Meteor. Res., 28, 1–33. DOI:10.1007/s13351-014-3087-6 |
| Li T., Wang B., 2005: A review on the western North Pacific monsoon: Synoptic-to-interannual variabilities. Terrestrial, Atmospheric and Oceanic Sciences, 16, 285–314. DOI:10.3319/TAO.2005.16.2.285(A) |
| Li T., Zhou C. H., 2009: Planetary scale selection of the Madden–Julian Oscillation. J. Atmos. Sci., 66, 2429–2443. DOI:10.1175/2009JAS2968.1 |
| Li T., Zhao C. B., Hsu P.-C., et al., 2015: MJO initiation processes over the tropical Indian Ocean during DYNAMO/CINDY2011. J. Climate, 28, 2121–2135. DOI:10.1175/JCLI-D-14-00328.1 |
| Liebmann B., Smith C. A., 1996: Description of a complete (interpolated) outgoing longwave radiation dataset. Bull. Amer. Meteor. Soc., 77, 1275–1277. |
| Ling J., Zhang C. D., 2011: Structural evolution in heating profiles of the MJO in global reanalyses and TRMM retrievals. J. Climate, 24, 825–842. DOI:10.1175/2010JCLI3826.1 |
| Madden R. A., Julian P. R., 1971: Detection of a 40–50-day oscillation in the zonal wind in the tropical Pacific. J. Atmos. Sci., 28, 702–708. DOI:10.1175/1520-0469(1971)028<0702:DOADOI>2.0.CO;2 |
| Madden R. A., Julian P. R., 1972: Description of global-scale circulation cells in the tropics with a 40–50-day period. J. Atmos. Sci., 29, 1109–1123. DOI:10.1175/1520-0469(1972)029<1109:DOGSCC>2.0.CO;2 |
| Maloney E. D., Hartmann D. L., 1998: Frictional moisture convergence in a composite life cycle of the Madden–Julian Oscillation. J. Climate, 11, 2387–2403. DOI:10.1175/1520-0442(1998)011<2387:FMCIAC>2.0.CO;2 |
| Matsuno T., 1966: Quasi-geostrophic motions in the equatorial area. J. Meteor. Soc. Japan, 44, 25–43. DOI:10.2151/jmsj1965.44.1_25 |
| Murakami T., Nakazawa T., 1985: Tropical 45-day oscillations during the 1979 Northern Hemisphere summer. J. Atmos. Sci., 42, 1107–1122. DOI:10.1175/1520-0469(1985)042<1107:TDODTN>2.0.CO;2 |
| Nasuno T., Tomita H., Iga S., et al., 2008: Convectively coupled equatorial waves simulated on an aquaplanet in a global nonhydrostatic experiment. J. Atmos. Sci., 65, 1246–1265. DOI:10.1175/2007JAS2395.1 |
| Roundy P. E., 2008: Analysis of convectively coupled Kelvin waves in the Indian Ocean MJO. J. Atmos. Sci., 65, 1342–1359. DOI:10.1175/2007JAS2345.1 |
| Roundy P. E., 2012a: Observed structure of convectively coupled waves as a function of equivalent depth: Kelvin waves and the Madden–Julian Oscillation. J. Atmos. Sci., 69, 2097–2106. DOI:10.1175/JAS-D-12-03.1 |
| Roundy P. E., 2012b: The spectrum of convectively coupled Kelvin waves and the Madden–Julian Oscillation in regions of low-level easterly and westerly background flow. J. Atmos. Sci., 69, 2107–2111. DOI:10.1175/JAS-D-12-060.1 |
| Roundy P. E., Frank W. M., 2004: A climatology of waves in the equatorial region. J. Atmos. Sci., 61, 2105–2132. DOI:10.1175/1520-0469(2004)061<2105:ACOWIT>2.0.CO;2 |
| Sperber K. R., 2003: Propagation and the vertical structure of the Madden–Julian Oscillation. Mon. Wea. Rev., 131, 3018–3037. DOI:10.1175/1520-0493(2003)131<3018:PATVSO>2.0.CO;2 |
| Straub K. H., Kiladis G. N., 2003: The observed structure of convectively coupled Kelvin waves: Comparison with simple models of coupled wave instability. J. Atmos. Sci., 60, 1655– 1668 . DOI:10.1175/1520-0469(2003)060<1655:TOSOCC>2.0.CO;2 |
| Waliser, D. E., 2006: Intraseasonal variability.The Asian Monsoon. Wang, B, Ed., Springer, Berlin Heidelberg, 203–257, doi: 10.1007/3-540-37722-0_5. |
| Wang B., Rui H. L., 1990: Dynamics of the coupled moist Kelvin–Rossby wave on an equatorial β-plane. J. Atmos. Sci., 47, 397–413. DOI:10.1175/1520-0469(1990)047<0397:DOTCMK>2.0.CO;2 |
| Wang B., Li T. M., 1994: Convective interaction with boundary-layer dynamics in the development of a tropical intraseasonal system. J. Atmos. Sci., 51, 1386–1400. DOI:10.1175/1520-0469(1994)051<1386:CIWBLD>2.0.CO;2 |
| Wang L., Li T., 2016: Roles of convective heating and boundaryayer moisture asymmetry in slowing down the convectively coupled Kelvin waves. Climate Dyn., 1–17. DOI:10.1007/s00382-016-3215-3 |
| Weickmann K. M., 1983: Intraseasonal circulation and outgoing longwave radiation modes during Northern Hemisphere winter. Mon. Wea. Rev., 111, 1838–1858. DOI:10.1175/1520-0493(1983)111<1838:ICAOLR>2.0.CO;2 |
| Wheeler M., Kiladis G. N., 1999: Convectively coupled equatorial waves: Analysis of clouds and temperature in the wavenumber-frequency domain. J. Atmos. Sci., 56, 374–399. DOI:10.1175/1520-0469(1999)056<0374:CCEWAO>2.0.CO;2 |
| Yang G. Y., Hoskins B., Slingo J., 2007: Convectively coupled equatorial waves. Part II: Propagation characteristics. J. Atmos. Sci., 64, 3424–3437. DOI:10.1175/JAS4018.1 |
| Yoneyama K., Zhang C. D., Long C. N., 2013: Tracking pulses of the Madden–Julian Oscillation. Bull. Amer. Meteor. Soc., 94, 1871–1891. DOI:10.1175/BAMS-D-12-00157.1 |
| Zeng Z., Ho S. P., Sokolovskiy S., et al., 2012: Structural evolution of the Madden–Julian Oscillation from COSMIC radio occultation data. J. Geophys. Res., 117, D22108. DOI:10.1029/2012JD017685 |
| Zhang C. D., 2005: Madden–Julian Oscillation. Rev. Geophys., 43, RG2003. DOI:10.1029/2004RG000158 |
 2017, Vol. 31


