The Chinese Meteorological Society
Article Information
- BAO Yun, WEN Xinyu . 2017.
- Projection of China's Near- and Long-Term Climate in a New High-Resolution Daily Downscaled Dataset NEX-GDDP. 2017.
- J. Meteor. Res., 31(1): 236-249
- http://dx.doi.org/10.1007/s13351-017-6106-6
Article History
- Received June 30, 2016
- in final form December 14, 2016
2. Troop 61741, People's Liberation Army of China, Beijing 100094
Global climate models (GCMs) are the primary tool for understanding and evaluating earth's climate change in the past and future (Taylor et al., 2012). They provide reliable global mean information on large-scale conditions, but fail to accurately estimate regional meteorological states on scales below 200 km (Meehl et al., 2007). In particular, GCMs cannot resolve hydrological-related processes that typically occur on finer scales (Kundzewicz et al., 2007). Thus, a variety of dynamical and statistical downscaling approaches, as an attempt to bridge the gap between future climate projections under specific scenarios and regional responses, have been widely developed in the last decade (Wilby and Wigley, 1997;Mearns et al., 1999;Maraun et al., 2010;Sunyer et al., 2012;Ekström et al., 2015). Many climate-associated disciplines, such as agricultural planning, water resources management, and ecological engineering, as well as the power industry and environmental policymaking, have benefited extensively from these downscaled data (Maraun et al., 2010).
Two major downscaling methods, dynamical and statistical, have been developed since the pioneering work of Giorgi (1990).Wilby and Wigley (1997) reviewed the two methods and further classified statistical downscaling into three groups: regression or transfer function method; circulation-based weather pattern method; and stochastic weather generators. The dynamical downscaling approach, using limited-area regional climate models (RCMs) nested to GCMs, provides a physical-based approximation on finer scales, but suffers from its huge computing cost, domain dependency and inflexibility, lateral boundary transition handling, and the RCM's intrinsic bias (Leung et al., 2003;Pal et al., 2007;Feser et al., 2011;Pielke and Wilby, 2012;Xue et al., 2014). As such, it is almost impossible to perform consecutive RCM-based downscaling to generate centennial timescale global data, even for one country, in future climate projection. It is necessary to choose a few specific decadal time slices and reduce the size of the domains of interest so that the central processing unit cost can be largely reduced (Xue et al., 2014). In particular, it is possible that RCM-based dynamical downscaling can introduce new bias in estimating precipitation, mainly due to physical parameterization, and therefore generally cannot meet the requirements of the hydrology community (Xue et al., 2014). In comparison, statistical downscaling method play an important role in performing longer—up to more than 100 years—downscaling work for much larger domains, with less computing cost than dynamical downscaling, which is very helpful for long-term climate projection (Fan et al., 2005;Maurer and Hidalgo, 2008;Liu et al., 2011,2012;Gutiérrez et al., 2013). Meanwhile, it has been suggested that statistical downscaling can make better estimation of local precipitation than RCMs (Fan et al., 2007;Maraun et al., 2010), meaning that statistical downscaling outputs are more valuable and useful to generic end users by serving as inputs to other relevant studies among the earth science community.
The downscaled projection of China's future climate has been tentatively investigated during the last decade (Fu et al., 2005;Fan et al., 2005,2007;Gao et al., 2011;Shi et al., 2011;Liu et al., 2013;Wu et al., 2015).Fu et al. (2005), by leading the Regional Climate Model Intercomparison Project for Asia in 2005, validated a set of RCMs' performances in reproducing past climate and projecting future climate over East Asia. They indicated that the RCMs ensemble effectively increased the quantity of spatial information, but still with large inter-model variance. A series of studies (Gao et al., 2011;Shi et al., 2011;Wu et al., 2015) promoted the application of dynamical downscaling in projecting China's climate after the late 1990s using the RCM from the Abdus Salam International Centre for Theoretical Physics (Pal et al., 2007). This line of research delivered the first 20-km high-resolution dynamical downscaling product for 2071–2100 under specific scenarios over the China domain. In recent years, an emerging international collaborative effort—the Coordinated Regional Climate Downscaling Experiment—was established by World Climate Research Program with the aim to improve the performance of the next generation of RCMs in terms of projecting the future East Asian climate (Lee et al., 2014;Ayar et al., 2016;Park et al., 2016). The preliminary results (Lee et al., 2014) show promising advances in capturing the summertime climatology of rainfall extremes in the East Asian monsoon region, which implies good potential for RCM-based climate projection over Asia and surrounding areas. As compared to dynamical downscaling, statistical methods in the last decade have progressed mainly in terms of monthly to seasonal predictions, rather than centennial timescale climate projection (Liu et al., 2012).Liu et al. (2011,2012) comprehensively reviewed advances in statistical downscaling up to 2012 with respect to temperature and precipitation prediction in China. It is evident that most studies have focused on the intraseasonal timescale over limited areas of China. Thus, the climate and hydrology research communities, as well as other relevant disciplines, still lack reliable high-resolution statistically downscaled data covering the whole of China for the entire 21st century. This kind of product is of considerable importance for both scientists and the public.
The purpose of the present paper is to investigate the availability and performance of a new statistically downscaled dataset, NEX-GDDP (NASA Earth Exchange Global Daily Downscaled Projections), in assessing China's future climate. It is shown, by comparing against observations and coarse-resolution GCMs, that the new data deliver a promising and remarkably improved projection for both the past and future climate of China on regional-to-local scales. Following this introduction, Section 2 describes the statistically downscaled data; Section 3 presents the climatology of the data, as compared to other data sources; near- and long-term projections derived from the data are discussed in Section 4; the added information on weather extremes at regional scales that can be extracted from the data is discussed in Section 5; and a summary and conclusions are provided in the final section.
2 DataNEX-GDDP was released to the earth science community in June 2015 (Wood et al., 2002,2004;Thrasher et al., 2012,2013). This dataset is intended to facilitate the study of climate change and its impact in the past and future at regional scales, as well as to enhance the public understanding of possible future climate patterns at the spatial scale of individual towns, cities, and watersheds (Thrasher et al., 2013). NEX-GDDP is generated by using the Bias-Correction Spatial Disaggregation (BCSD) method (Wood et al., 2004;Thrasher et al., 2012)—a regression type statistical downscaling algorithm specifically developed to solve the limitations of global GCM projections, including the problem of coarse resolution coverage and the issue of global accuracy but local bias (Thrasher et al., 2013). The BCSD method involves two steps for the period 1950–2005, based on CMIP5 historical runs. The first (bias correction) step corrects the bias of the GCM data in terms of the mean, variances, slope, etc., by comparing the selected variables with observations, which is the Global Meteorological Forcing Dataset (GMFD) available from the Terrestrial Hydrology Research Group in Princeton University (Sheffield et al., 2006). The second (spatial disaggregation) step spatially transfers the adjusted GCM data to a finer resolution (0.25° × 0.25°) by performing interpolation and associated processing with GMFD constrains (Wood et al., 2004).
The released NEX-GDDP dataset includes three key climatic variables (daily maximum temperature, daily minimum temperature, daily total precipitation) for the periods 1950–2005 (the “Retrospective Run”) and 2006–2100 (the “Prospective Run”), by compiling the historical and two projection experiment (RCP4.5 and RCP8.5) (Meinshausen et al., 2011) results of 21 CMIP5 GCMs (Taylor et al., 2012). Each of the 21 CMIP5 GCMs is downscaled to a spatial resolution of a global 0.25° grid (approximately 25 km in the midlatitudes). The total size of the data archive is more than 12 TB. More information on NEX-GDDP can be found at its official website ( https://nex.nasa.gov/nex/projects/1356/), and the data can be accessed via https://cds.nccs.nasa.gov/ nex-gddp/.
The high-resolution feature of NEX-GDDP significantly improve the data availability of GCMs, not only by providing information at finer scales but also by incorporating the effect of topography that occasionally dominates local extremes of rainfall-related variables (Wood et al., 2004).Figure 1 shows the improved grid size of NEX-GDDP, as compared to CMIP5 GCMs. The mean grid size of the CMIP5 GCMs (Fig. 1, light grey box) is about 2° (longitude) × 1.9° (latitude), by averaging the 21 GCMs used in NEX-GDDP (big markers) and the other 23 GCMs (small black circles; three GCMs share the same grid size). However, the 0.25° grid in NEX-GDDP, shown as the dark grey box in the bottom-left corner, is much finer than the average of the GCMs (light grey box), and even close to the finest grid size from MRI-AGCM3.2S (approximately 20 km × 20 km) and GFDL-HIRAM-C360 (approximately 25 km × 25 km).Figure 2 shows the improvement in China's elevation and its implicit topography correction in NEX-GDDP. We can see that the significantly improved areas are mainly close to steep terrain with sharp slopes, such as the edges of the Tibetan Plateau, northern Xinjiang, the transition area of the Taihang Mountains, and the Central Mountain Range area in Taiwan. Note that the Sichuan basin in east of Tibet, could be one of the key improved regions, which is a populous area with distinct climate that is conventionally poorly reproduced by GCMs due to coarse terrain representation.

|
| Fig. 1 Grid sizes of the 21 CMIP5 GCMs used in the NEX-GDDP (NASA Earth Exchange Global Daily Downscaled Projections) dataset (big markers) and the other 23 GCMs (small black circle), as well as the mean size of the CMIP5 2° × 2° grid (light grey box) and the NEX-GDDP 0.25° × 0.25° grid (dark grey box). The grid size of the observational dataset (CRU-TS) is also marked, as solid black axis ticks. All model names comply with IPCC-AR5 convention (Flato et al., 2013). |

|
| Fig. 2 Altitude of surface topography (in m) in the (a) CMIP5 mean grid and (b) NEX-GDDP high-resolution grid. The (c) sub-grid standard deviation of altitude in NEX-GDDP within the CMIP5 mean grid mesh shows the major improvements in the topographic effect implicitly incorporated in the NEX-GDDP algorithm. |
In this study, three key periods are defined in the following discussion: PA, the past 26 years from 1980 to 2005; NF, the near-term future from 2025 to 2050; and LF, the long-term future from 2075 to 2100 (2 out of 21 models provide data through to 2099). To better evaluate the extreme conditions at the end of this century, we choose RCP8.5 as the scenario for NF and LF. We also use version 3.2 of the University of East Anglia's Climatic Research Unit (CRU) high-resolution (0.5° × 0.5°) land surface climate dataset (CRU-TS) as benchmark observations to validate NEX-GDDP's climatology.
3 ClimatologyThe two salient features of the NEX-GDDP dataset are: 1) more accurate spatial patterns than CMIP5 GCMs, as compared to observations; and 2) more accurate temporal variability in both the past and the projected future. The former feature is discussed here and the latter in the next section.
China's climatology is typically characterized by a monsoonal seasonal cycle, with the maximum temperature and precipitation occurring in July and the minimum in January (Ding and Chan, 2005;An et al., 2015).Figure 3 shows the 1980–2005 averaged climatology of minimum temperature in January, maximum temperature in July, and precipitation rate in July, from NEX-GDDP, as compared to CMIP5 GCMs, as well as observations from the CRU dataset. We can see that, in general, NEX-GDDP (Fig. 3, right column) successfully reproduces these three variables, with the spatial pattern and amplitude much closer to observations (Fig. 3, middle column) than the GCMs (Fig. 3, left column). For example, the daily minimum temperature of January in NEX-GDDP, an indicator of the intensity of the East Asian winter monsoon, ranges from –38°C to 16°C, with the lowest temperature occurring near the northern part of Northeast China and the highest over Hainan Province, which agrees well with the observation. The results from the GCMs, however, deliver a much warmer wintertime climate than NEX-GDDP, with the temperature ranging from –31°C over Tibet to 18°C over Taiwan Island. A similar bias is apparent for the daily maximum temperature in July (Fig. 3, second row). The hottest places in China according to NEX-GDDP and observations—southern Xinjiang and central China (Hunan Province), with temperature greater than 35°C—is not reproduced well by the GCMs. For July precipitation, we can see again that NEX-GDDP significantly reduces the overestimated precipitation bias over Southwest China shown in the GCMs, and gives a spatial pattern and strength of summertime precipitation consistent with observation. The two key rain belts: the monsoonal Meiyu belt between the Yangtze and Huai rivers and the typhoon-induced belt over South China, are reasonably reproduced by NEX-GDDP.

|
| Fig. 3 Climatology of (a) daily minimum temperature (Tmin; °C) in January, (b) daily maximum temperature (Tmax; °C) in July, and (c) precipitation (mm day–1) in July, in NEX-GDDP (right column), CRU-TS (middle column), and CMIP5 (left column). The climatology is derived for the period 1980–2005. |
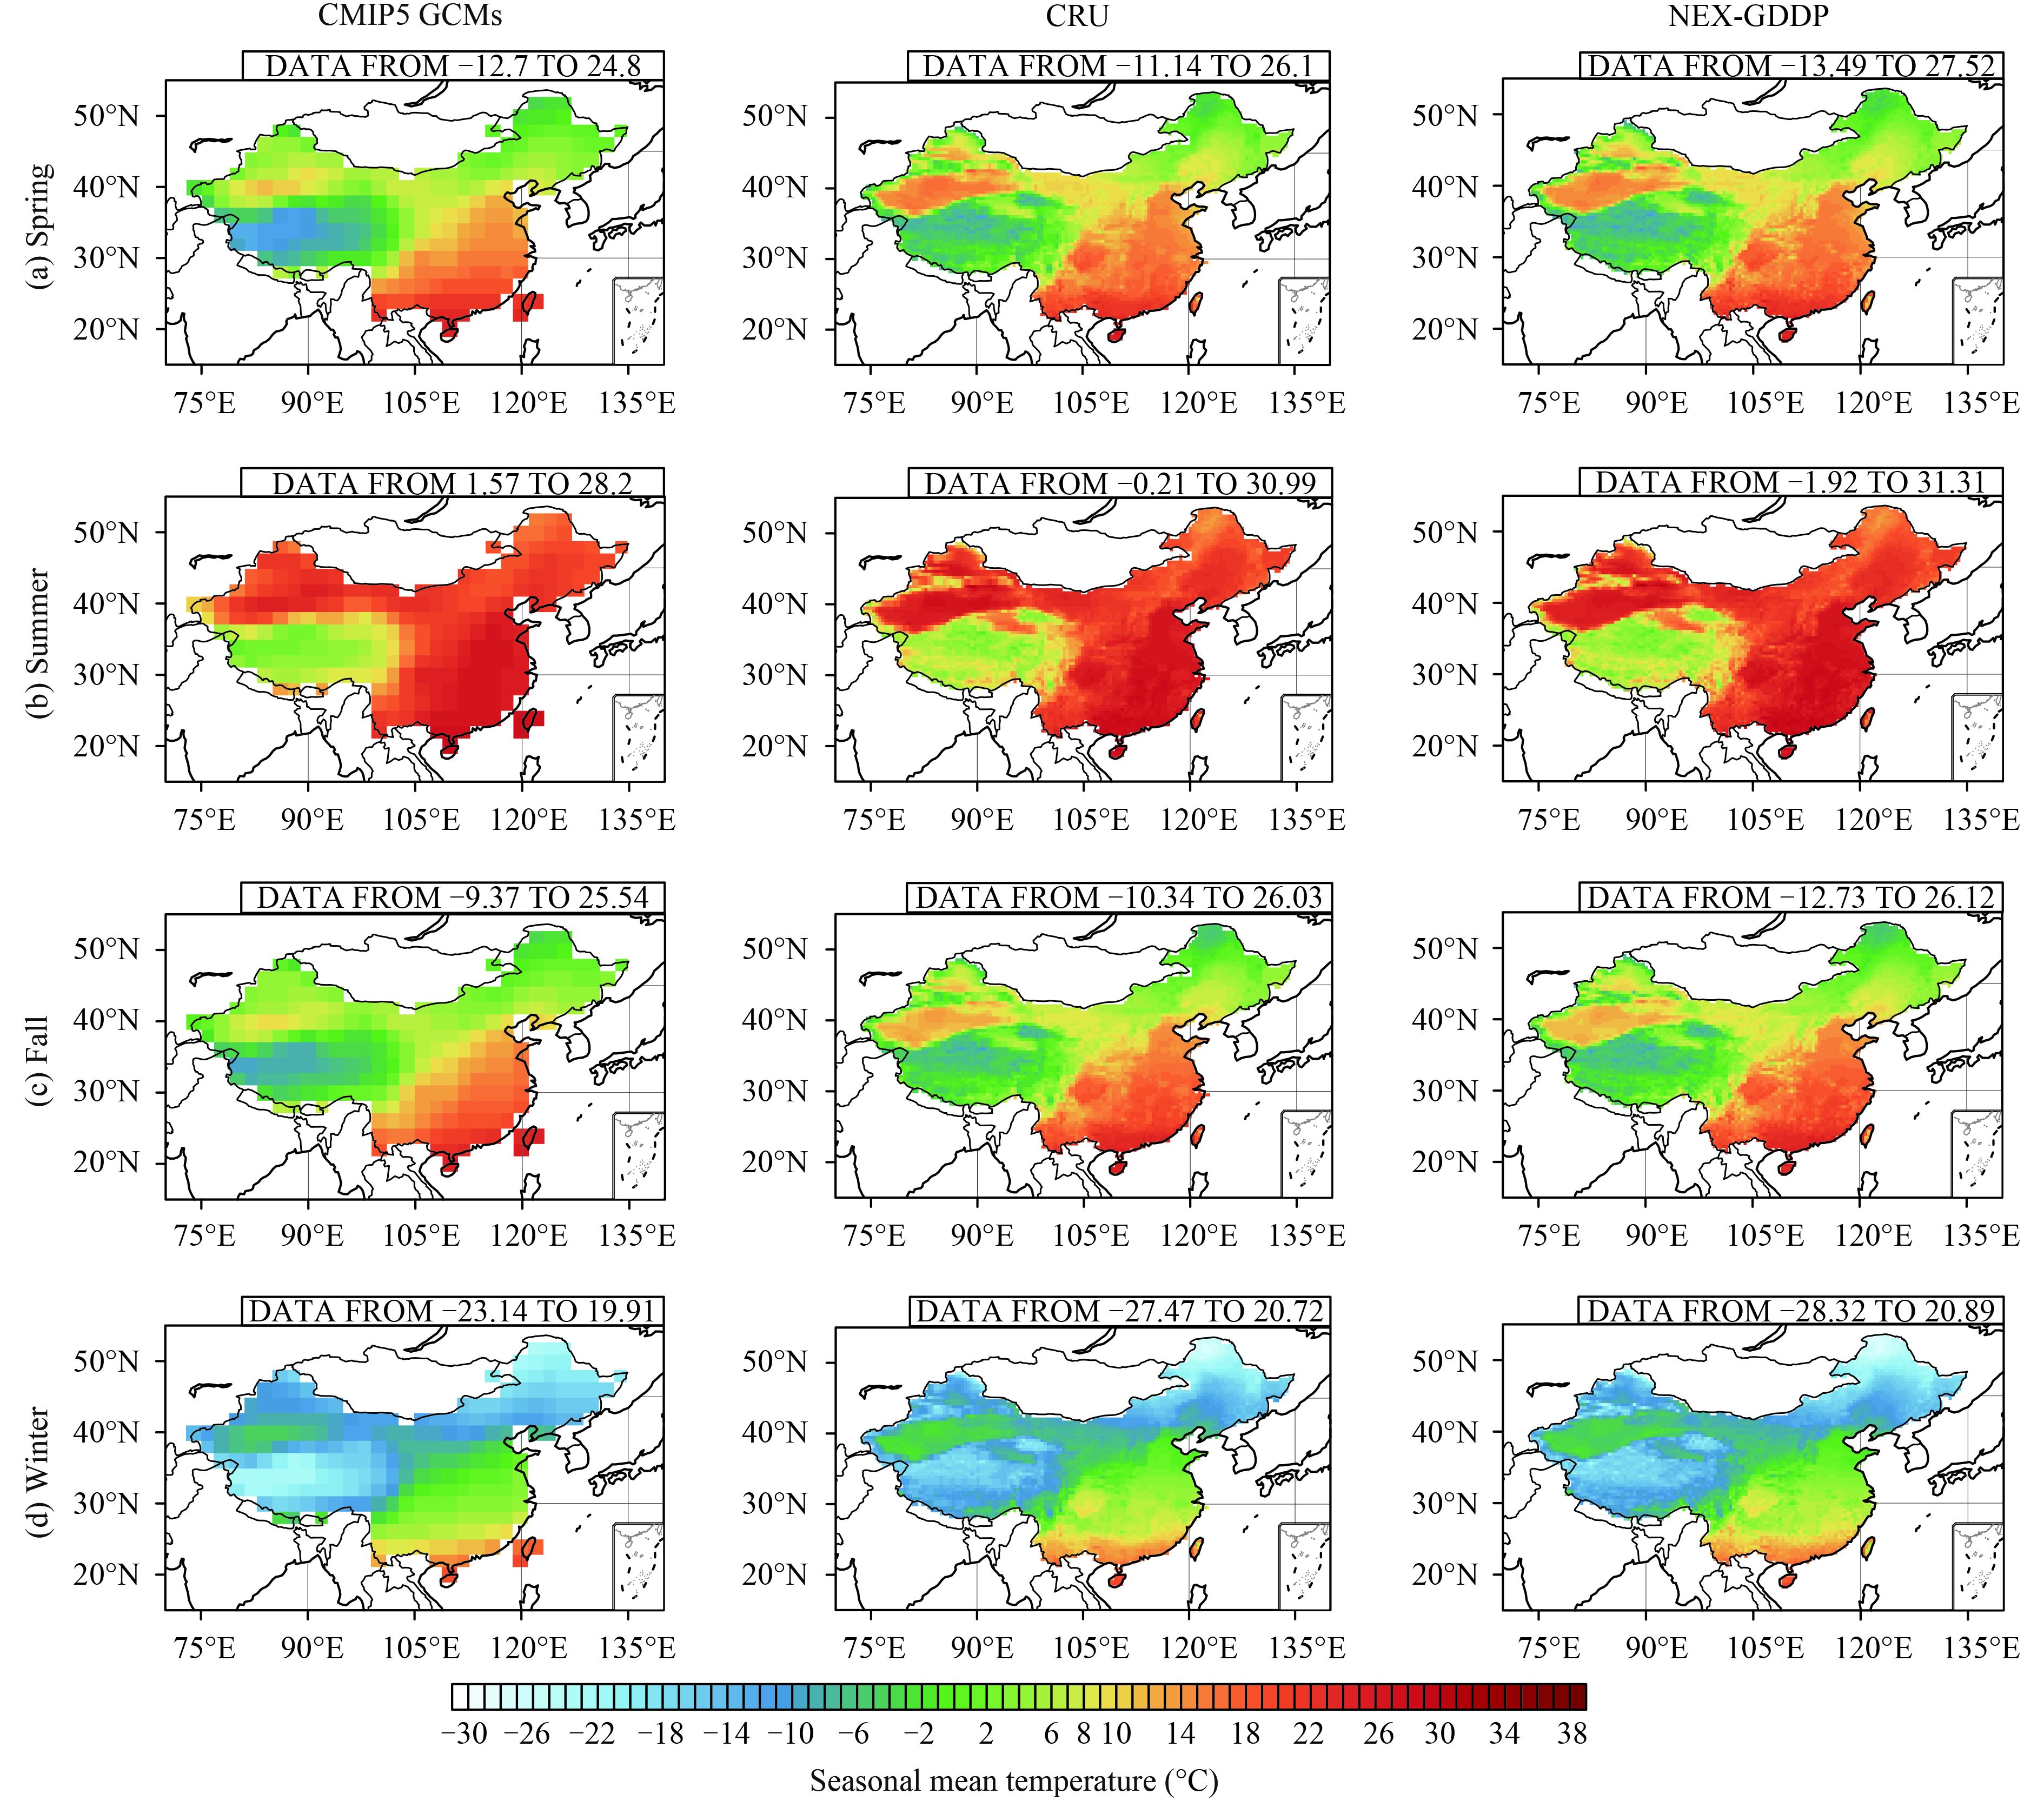
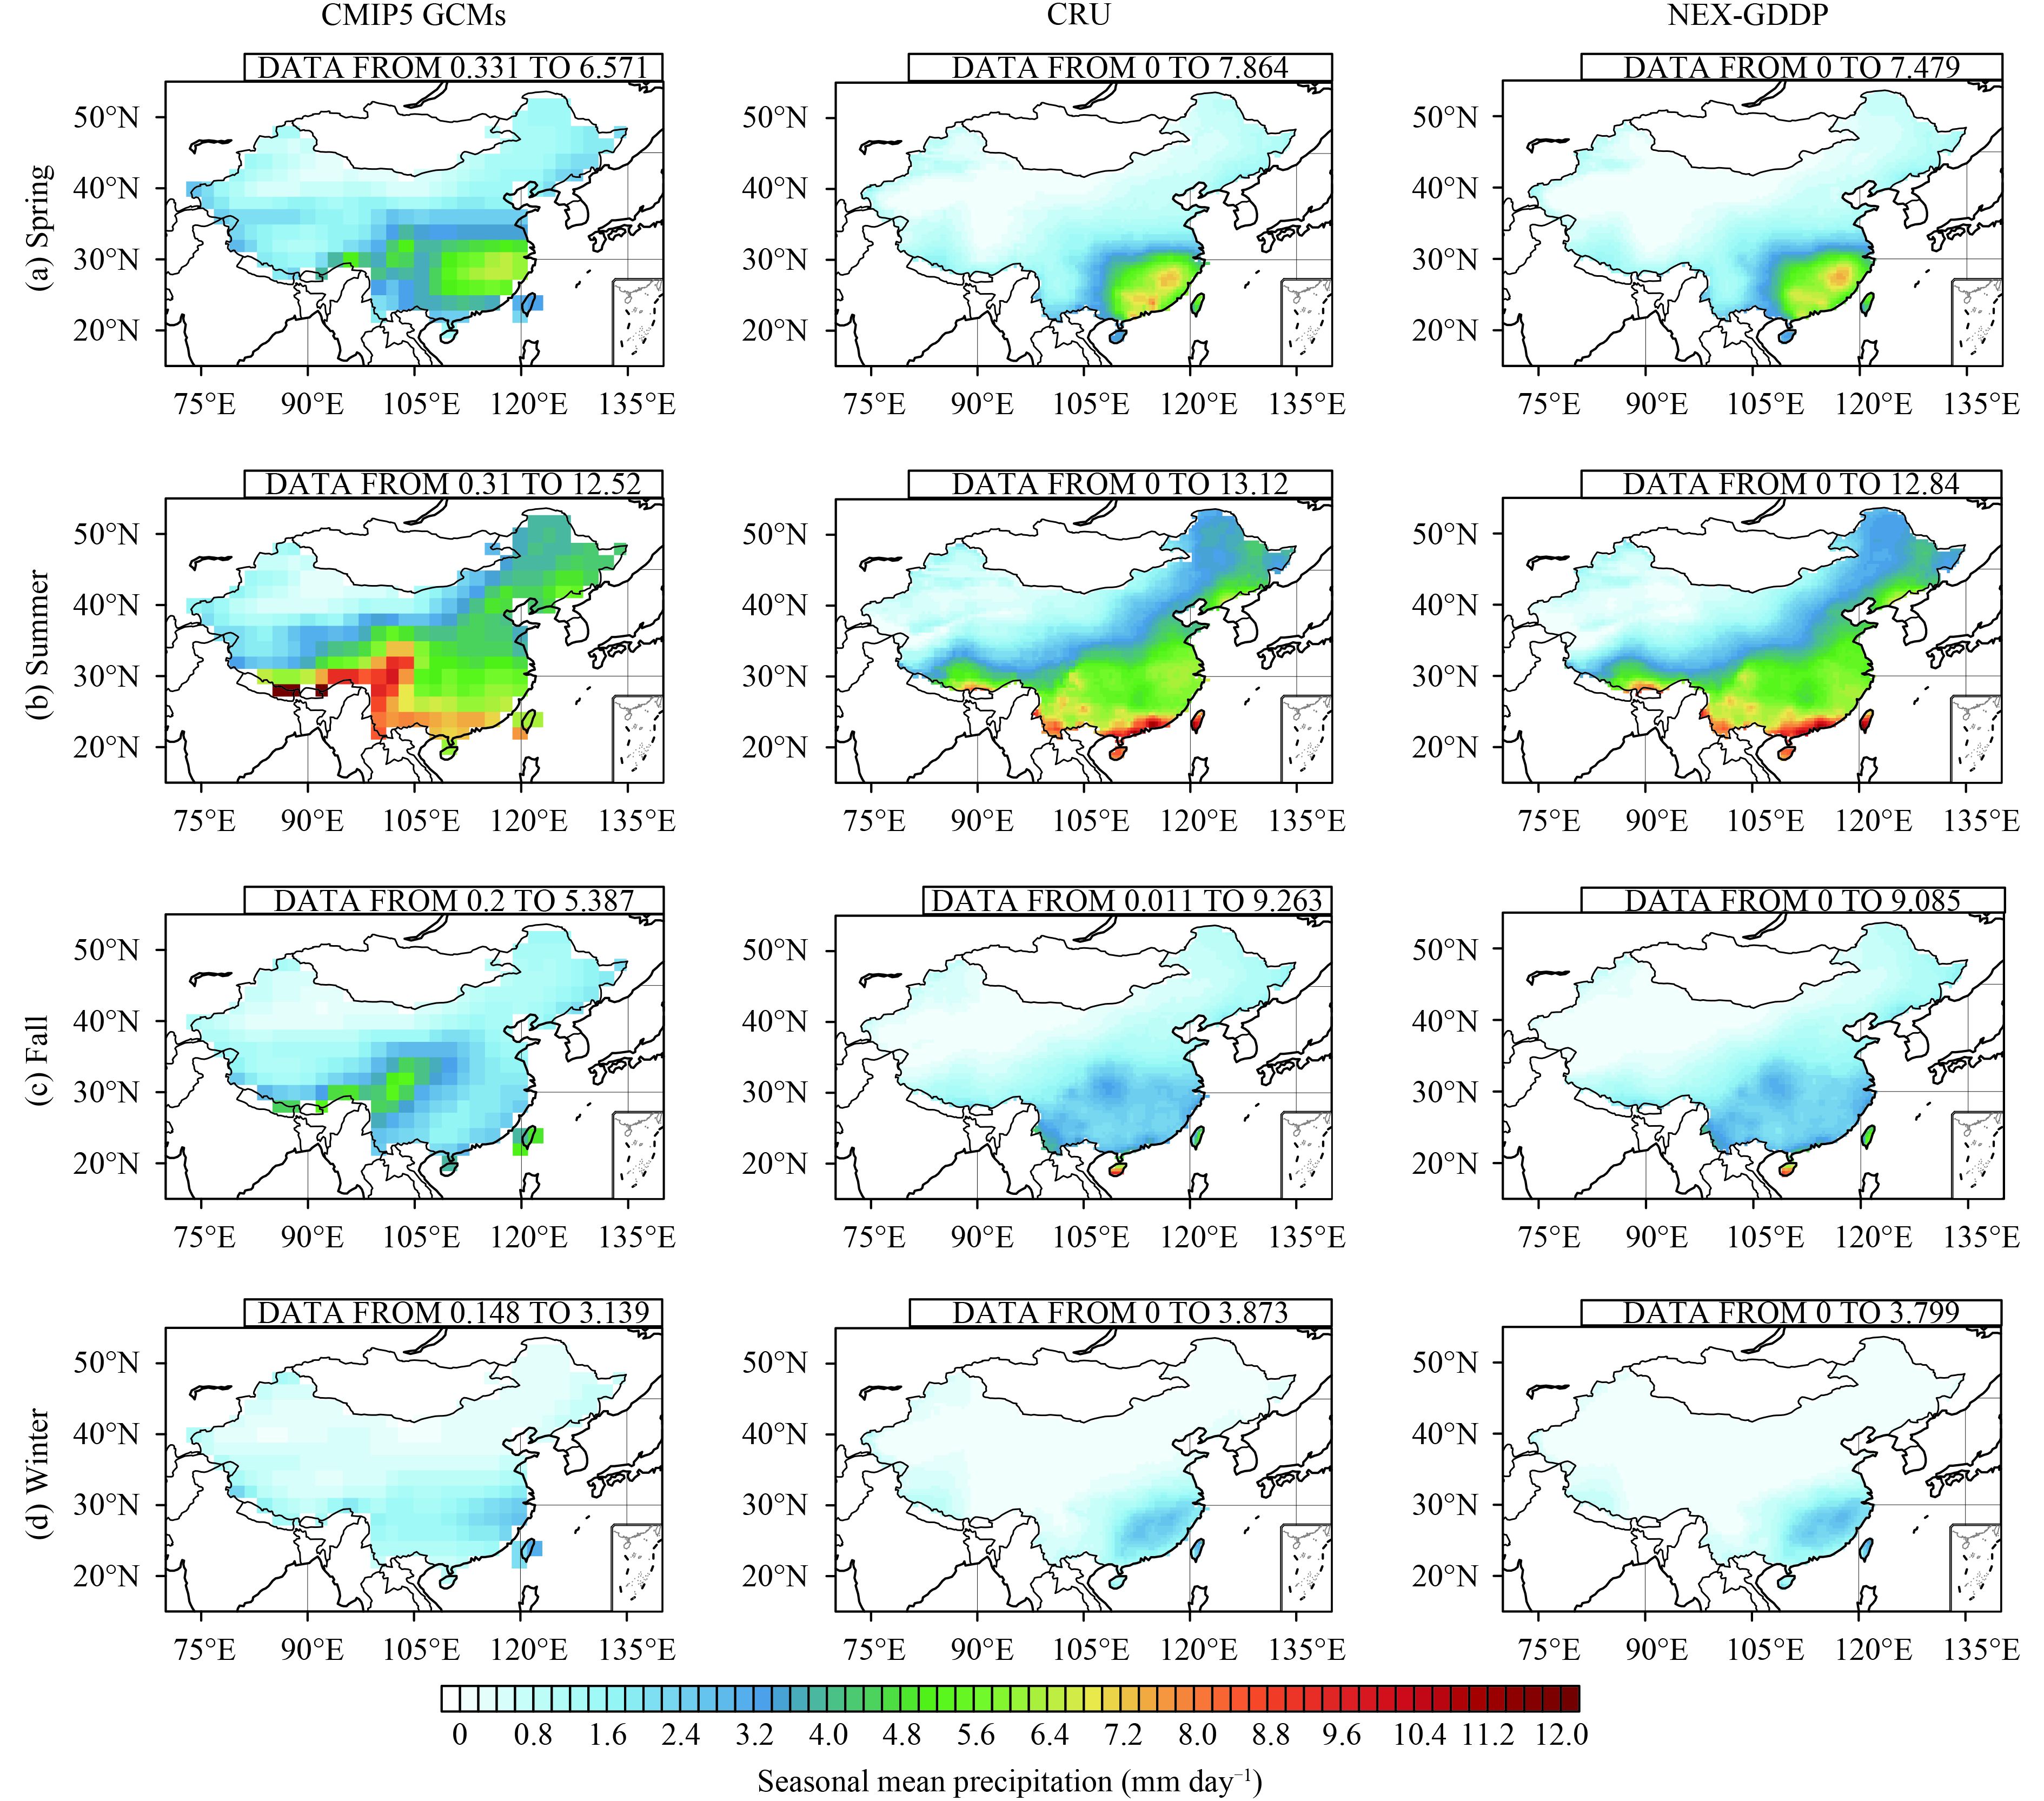
Apart from the above extremes of temperature and precipitation, we also investigate the seasonal mean of daily averaged temperature and precipitation from NEX-GDDP, CRU, and GCMs, as shown in Figs. 4 and 5, respectively. For the daily mean temperature (Fig. 4), it is apparent that the warm bias in winter and the cold bias in summer, by comparing GCMs to NEX-GDDP, are still there. NEX-GDDP presents a spatial pattern and absolute values that are highly consistent with those in observations. The bias in the two transition seasons, March to May and September to November, is relatively small and negligible. It should be noted that the Sichuan basin, a highly populous area, might be one region with large biases in the GCMs, but is captured well in NEX-GDDP. We recommend that any user with a focus on this area should use NEX-GDDP data rather than GCM outputs. For the summertime daily mean precipitation (Fig. 5), similarly, we can see that NEX-GDDP successfully reproduces the spatial pattern shown in observations for each of the four seasons. In particular, the large bias found in June–August and September–November in the GCMs over eastern Tibet and western Sichuan basin, might be linked to the defects in the representation of terrain. NEX-GDDP significantly reduces this bias and gives a better monsoonal precipitation pattern, i.e., the Meiyu belt, than the GCMs.
|
| Fig. 4 Seasonal mean of daily averaged temperature (°C), defined as (Tmax +Tmin) / 2, where Tmax and Tmin are daily maximum and minimum temperature, respectively, in NEX-GDDP (right column), CRU-TS (middle column), and CMIP5 (left column). The climatology is derived for the period 1980–2005. |
|
| Fig. 5 Seasonal mean of precipitation (mm day–1) in NEX-GDDP (right column), CRU-TS (middle column), and CMIP5 (left column). The climatology is derived for the period 1980–2005. |
The ability of NEX-GDDP in capturing temperature extremes can be largely attributed to its high resolution. In fact, grid averaged temperature does not help capture the local sub-grid maximum and/or minimum, and a coarser horizontal resolution results in a larger bias. This explains the more accurate and reliable estimation of temperature in NEX-GDDP than in the CMIP GCMs, as compared to observations. The improvements offered by NEX-GDDP in terms of precipitation can be attributed to both its grid resolution and implicit topographic correction. GCMs suffer from their incorrect representation of terrain and tend to overestimate precipitation around Southwest China (Yu et al., 2000). NEX-GDDP, however, avoids this through its cutting-edge downscaling algorithm, which effectively restores the precipitation back to that observed.
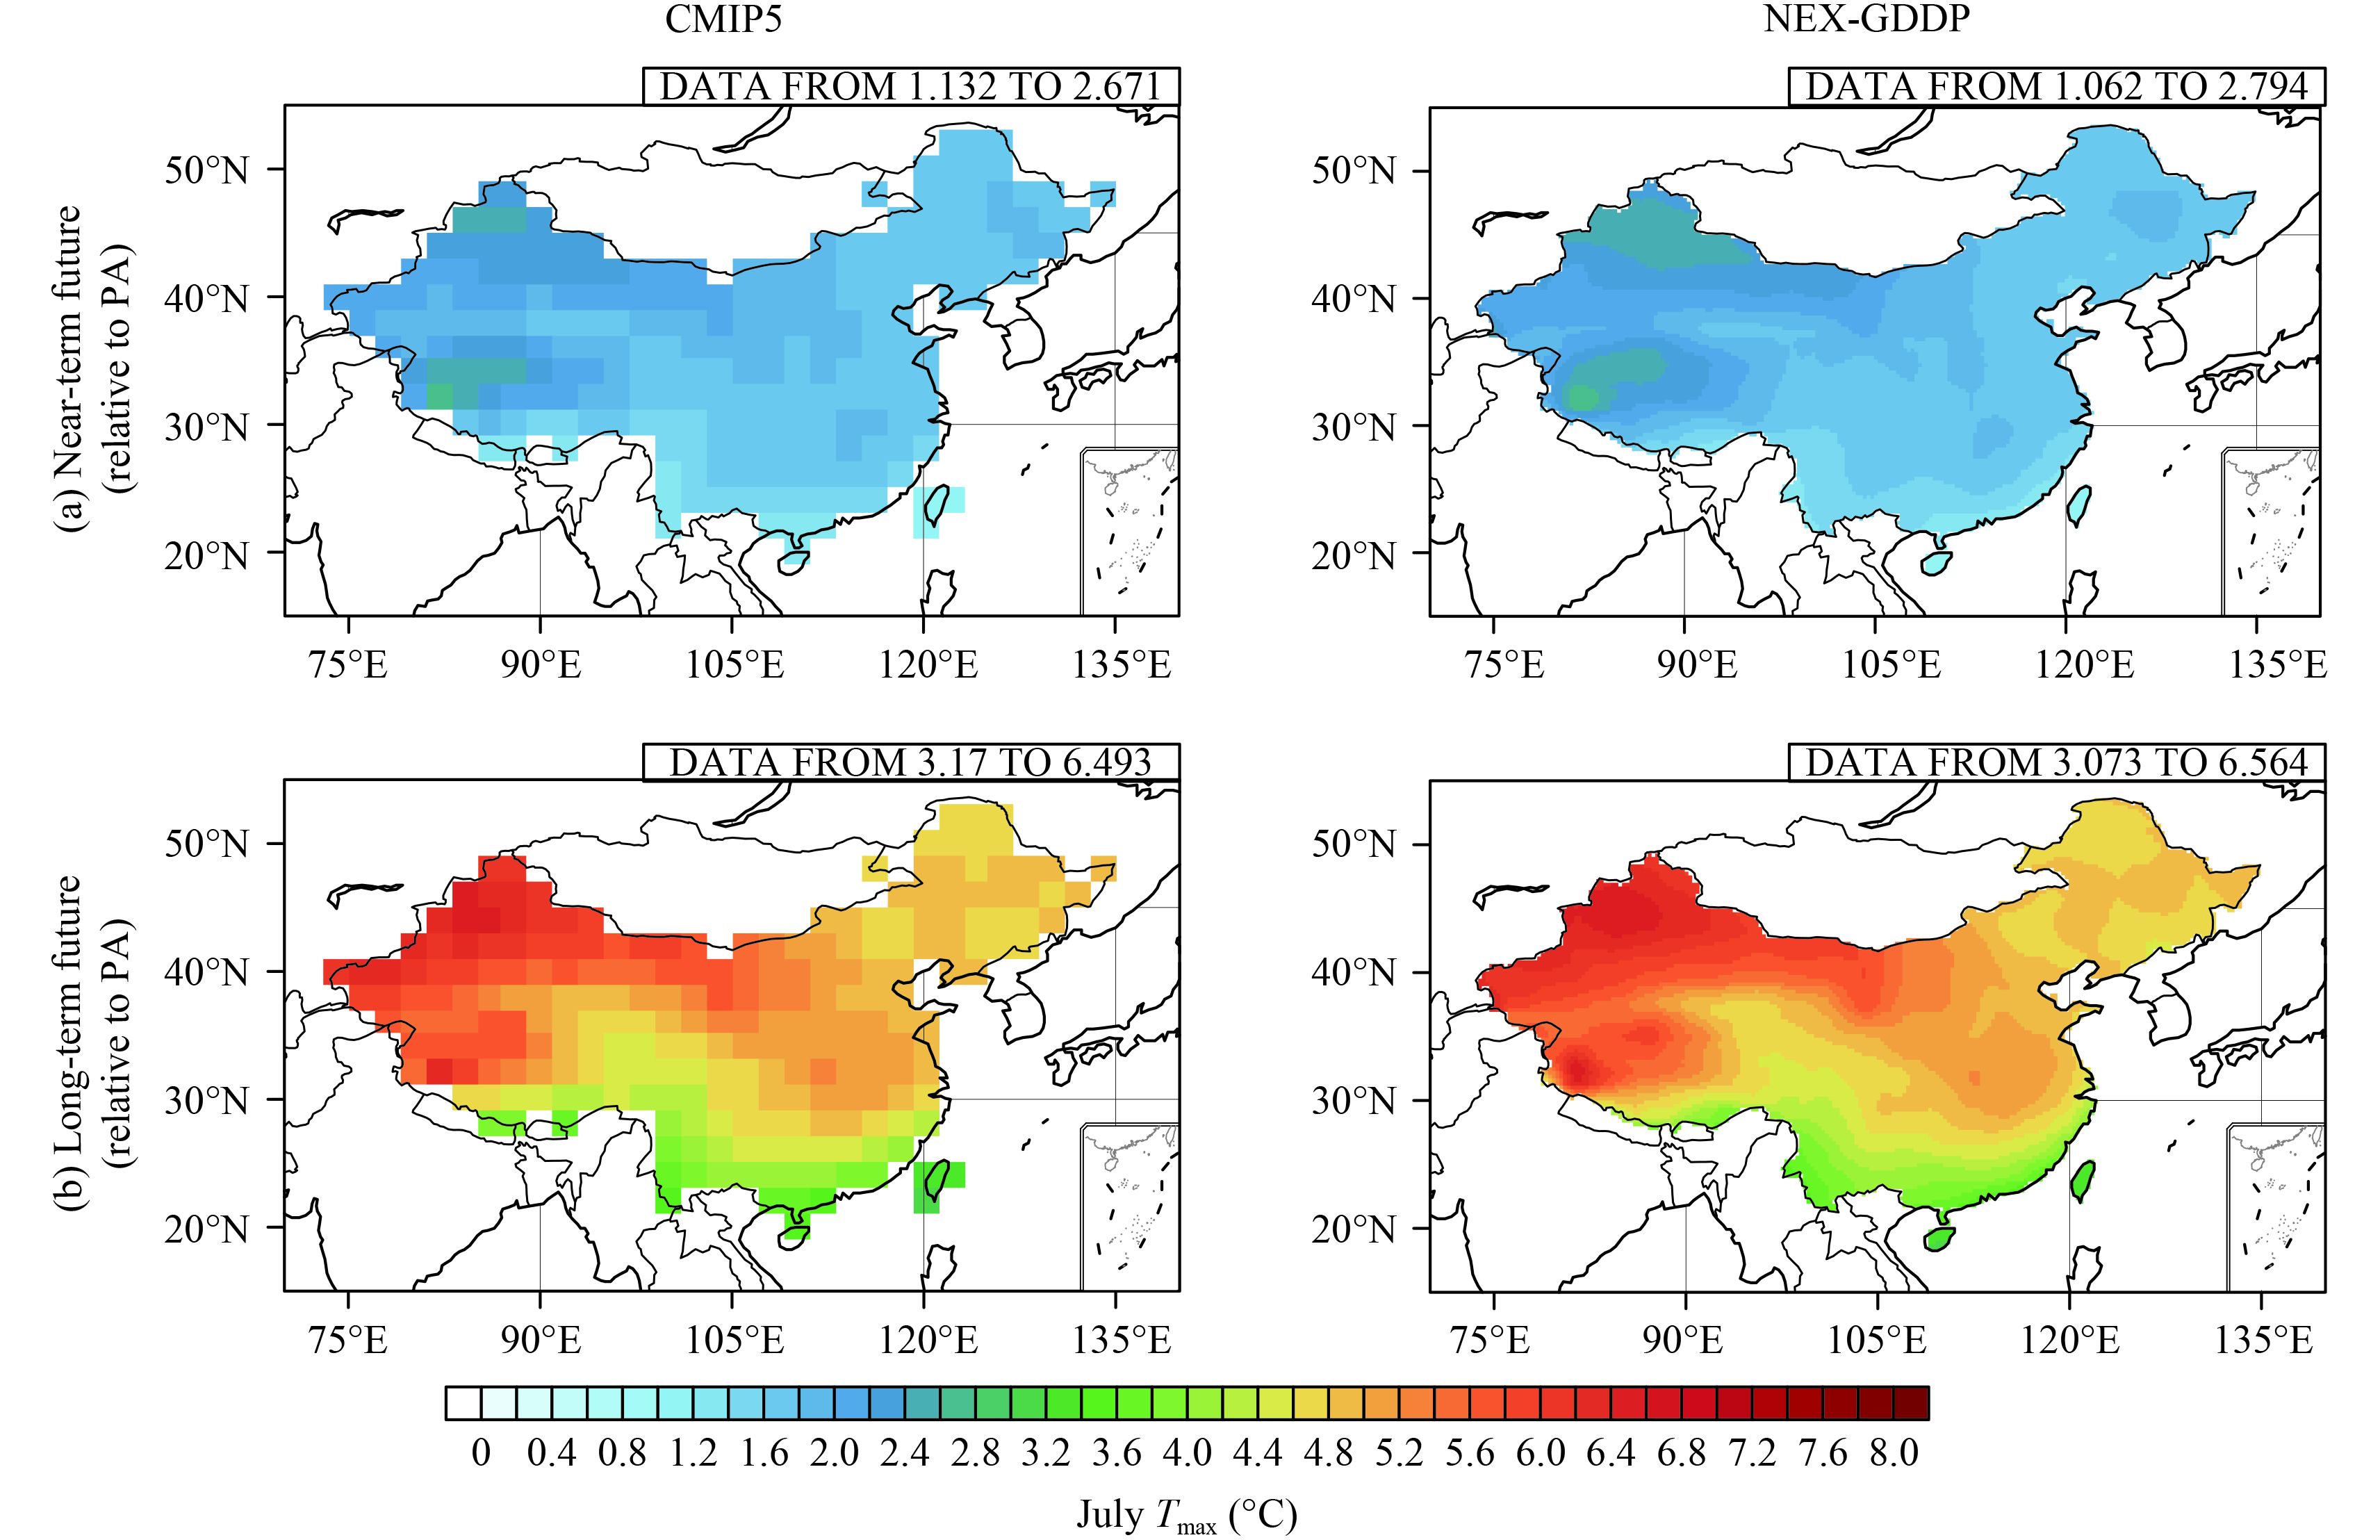
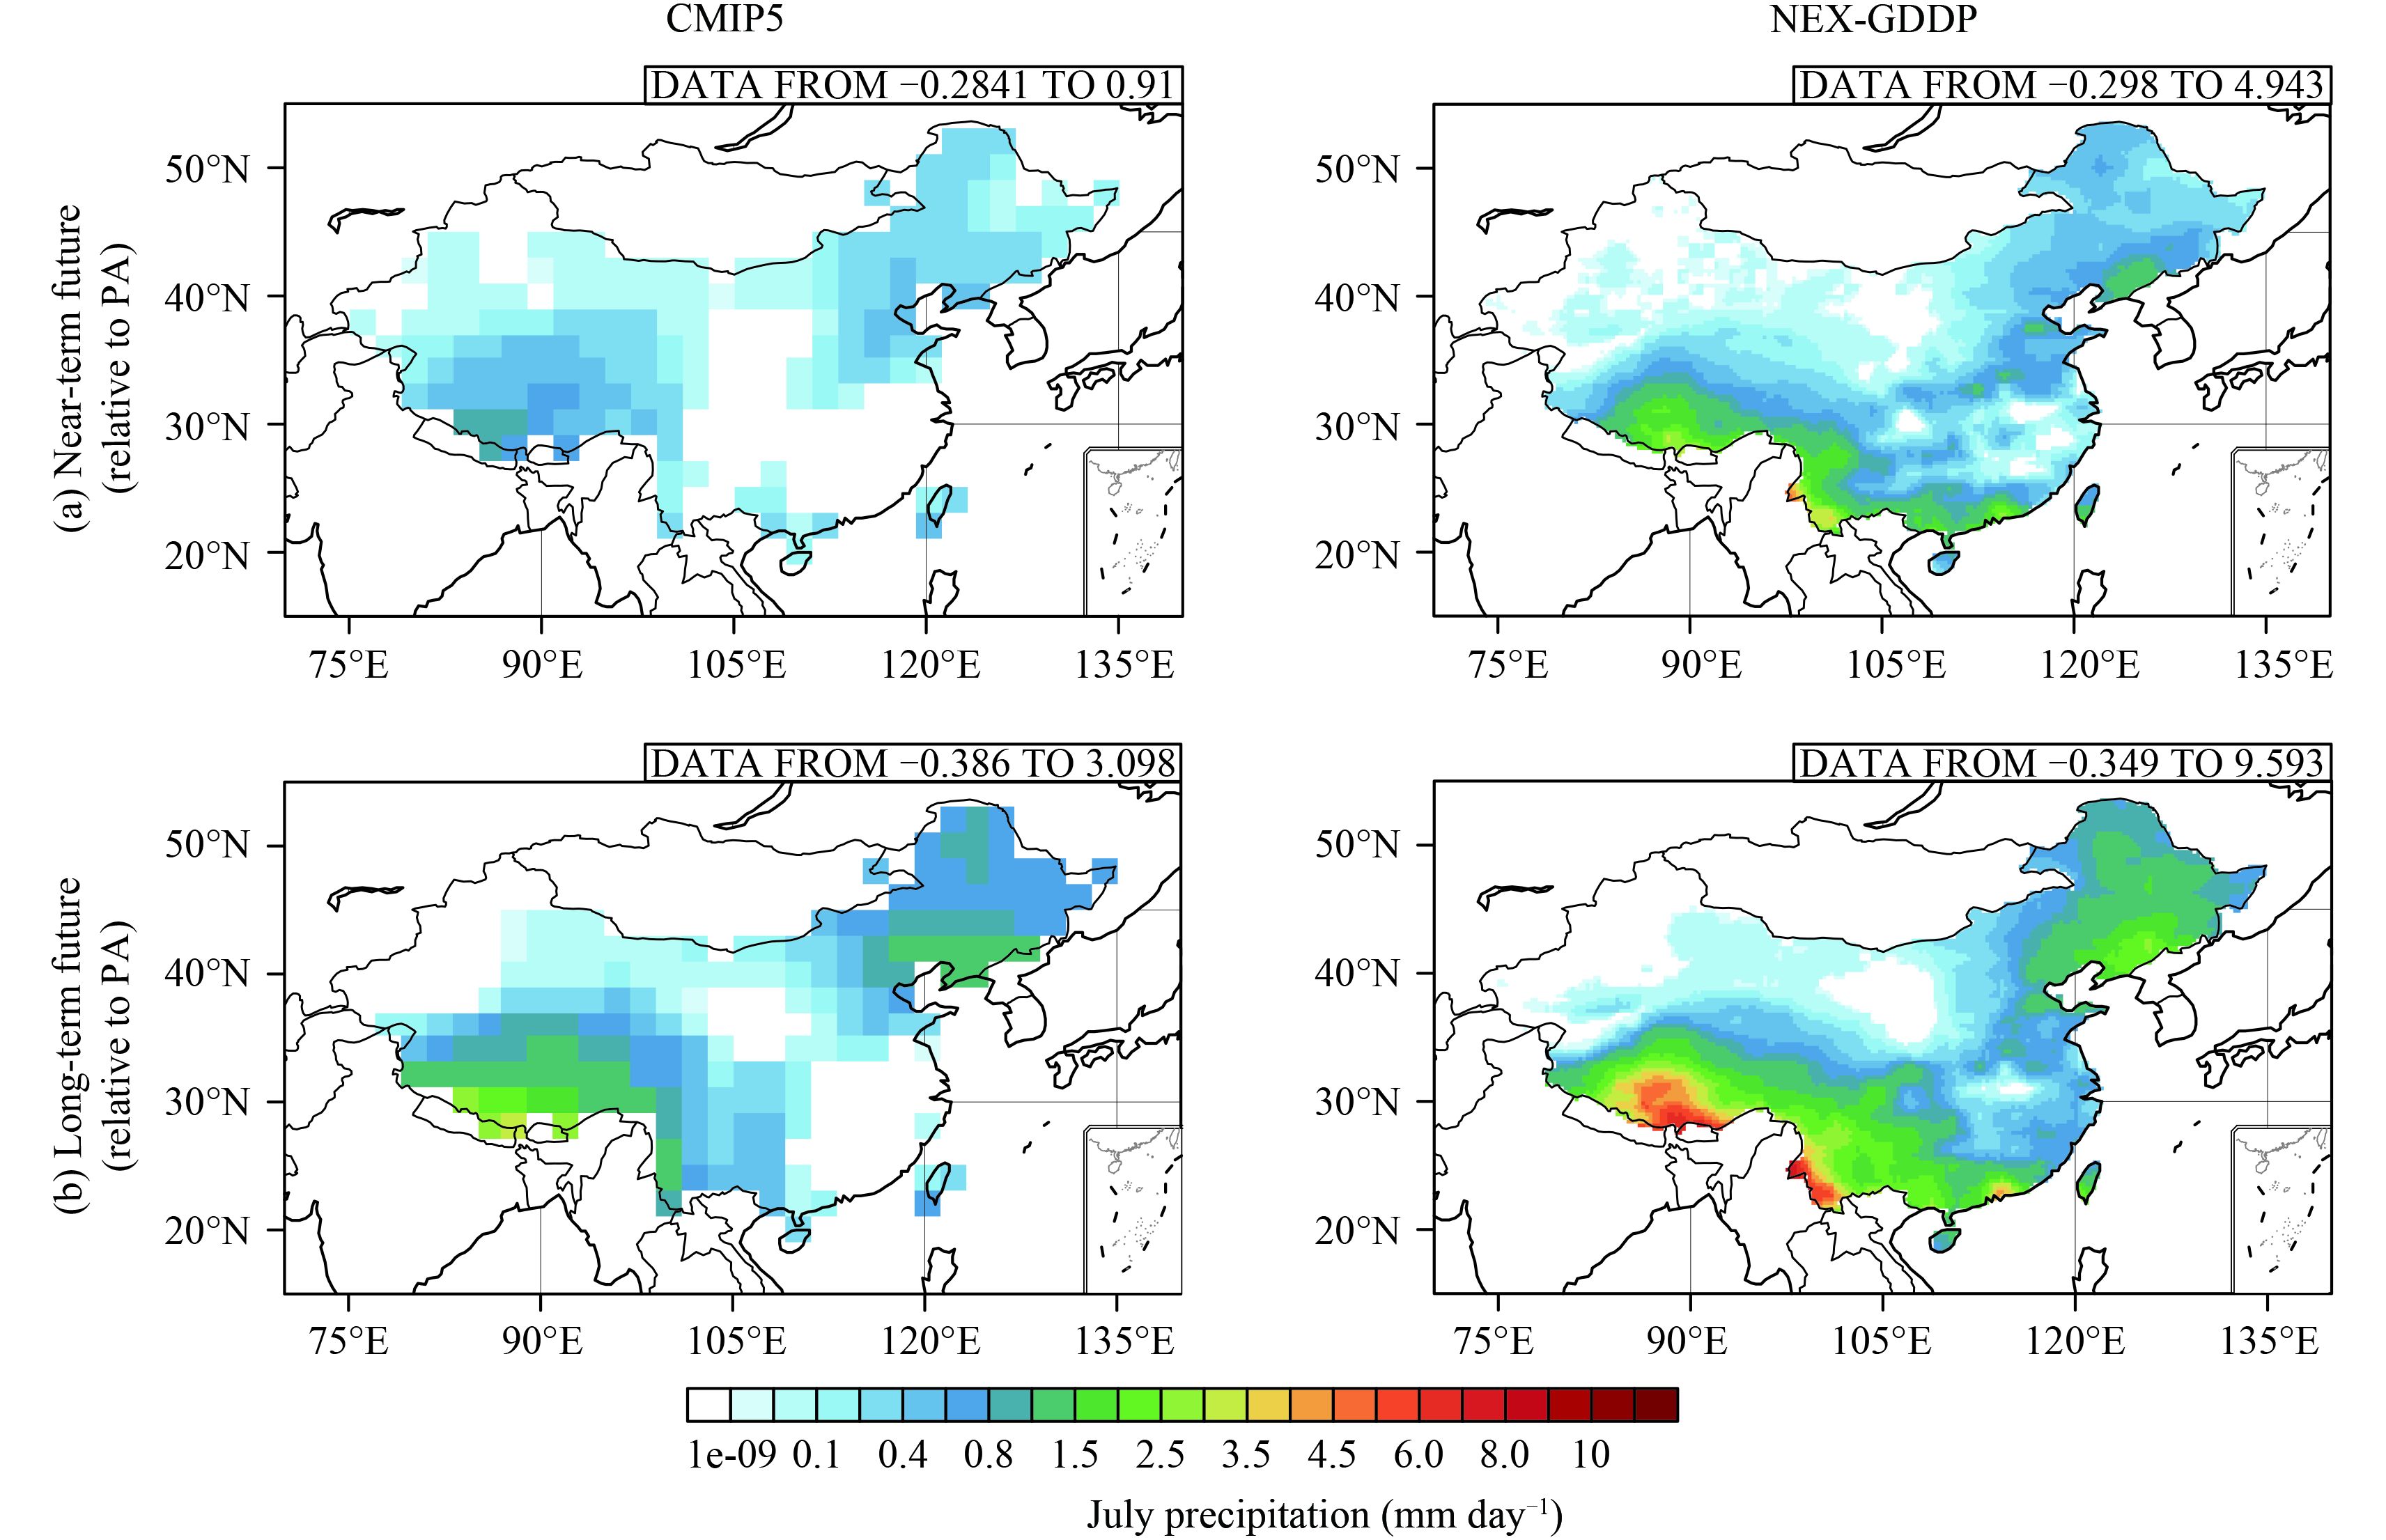
4 Near- and long-term projectionWe expect the high-resolution downscaled NEX-GDDP dataset, a data source that reproduces the past climatology, to also be able to deliver a more accurate projection of China's future climate than CMIP5 GCMs.Figure 6 shows the time series of three whole-China averaged variables (daily minimum temperature in January, daily maximum temperature in July, precipitation in July) for the period 1980–2100 (covering PA, NF, and LF), form NEX-GDDP (red) and CMIP5 GCMs (blue). For better comparison, the CRU data are also marked as a black line. The shading in light red and blue indicates one standard deviation, as the spread of uncertainty from the 21 models in NEX-GDDP and CMIP5.Figures 7,8, and 9 show spatial distributions of these variables in NF and LF relative to PA, which provide clues in terms of where NEX-GDDP is able to bring new information over and above that based on GCM projections. The combined results shown in Figs. 6–9 provide a picture as to the progress made by NEX-GDDP, as compared with CMIP5 GCMs, in projecting China's future climate.

|
| Fig. 6 Time series of whole-China averaged (a) daily minimum temperature (Tmin; °C) in January, (b) daily maximum temperature (Tmax; °C) in July, and (c) precipitation (mm day–1) in July, in NEX-GDDP (red) and CMIP5 (blue). The observed data (CRU) are marked as a black line for the period 1980–2014. The light red/blue shading indicates one standard deviation of model-to-model variance. |

|
| Fig. 7 The increment of daily minimum temperature (Tmin; °C) in January in (a) NF (near-term future, 2025–50) and (b) LF (long-term future, 2075–2100), relative to PA (past 26 years, 1980–2005), according to CMIP5 (left) and NEX-GDDP (right). |
|
| Fig. 8 The increment of daily maximum temperature (Tmax; °C) in July in (a) NF (near-term future, 2025–50) and (b) LF (long-term future, 2075–2100) relative to PA (past 26 years, 1980–2005), according to CMIP5 (left) and NEX-GDDP (right). |
|
| Fig. 9 The increment of precipitation (mm day–1) in July in (a) NF (near-term future, 2025–50) and (b) LF (long-term future, 2075–2100) rela-tive to PA (past 26 years, 1980–2005), according to CMIP5 (left) and NEX-GDDP (right). |
The key improvements in the future projections of NEX-GDDP over CMIP5 GCMs include significantly reduced model–observation mean bias during PA, as well as the inter-model variance during NF and LF.
For daily minimum temperature in January (Fig. 6a), the average result of the GCMs underestimates the whole-China average by 1°C, with the associated model-to-model spread being from 2.5°C around the year 2000 to 3°C at the end of this century. NEX-GDDP exhibits not only a close-to-observation estimation of China's average during PA, with bias of less than 0.5°C, but also an evidently reduced model-to-model spread at no more than half the level of that of CMIP5. The only discrepancy is that the observed high-frequency interannual variability cannot be reproduced by NEX-GDDP, such as the cold winters of 2009–12, because no interannual information (forcing) was imposed in CMIP5 and thus not passed down through the statistical downscaling process. Actually, the global warming hiatus during the last decade is missed in all CMIP5 simulations. Thus, we cannot expect statistically downscaled data to reproduce this internal variability, unless another prediction approach with explicit interannual-to-decadal formulations is incorporated (Qi et al., 2016). Overall, China's wintertime warming will reach 2°–3°C in NF and 5°–6°C in LF, which is consistent with the trend estimated by CMIP5 GCMs. The prominent warming areas lie in West China, including Xinjiang, Qinghai, Tibet, and Inner Mongolia, as well as Northeast China, with the extremes exceeding 8°C at the end of this century (Fig. 7).
For daily maximum temperature in July (Fig. 6b), we can see similar improvements: NEX-GDDP simultaneously reduces the observed mean bias and model-to-model spread, as compared to GCMs. The warming increment follows the same strength as the wintertime value. More heat waves with temperature greater than 28°C can be expected at the end of this century, which might threaten human health and affect people's outdoor activities. The distinct warming areas are located in Northwest China, especially Xinjiang, and North China, with the extremes exceeding 7°C (Fig. 8).
The situation for daily precipitation in July (Fig. 6c) differs somewhat with that for temperature. As compared to CMIP5 GCMs, NEX-GDDP just reduces the mean bias during PA, but significantly alters the model-to-model variance. Moreover, NEX-GDDP exhibits a trend of having more precipitation [0.8 mm day–1 (100 yr)–1], accounting for a 20%–25% increment, whereas this value is just 10% in CMIP5's estimate. In the same way, NEX-GDDP cannot reproduce the interannual variability of hydrological cycle, such as the record-breaking flood that happened in the Yangtze River in 1998. Overall, more summertime monsoonal precipitation in China, in particular over Northeast China and Southwest China (Fig. 9), can be expected in the coming decades. Meanwhile, the Yangtze River delta, previously a flood region, as well as Northwest China, might gradually experience an anomalous arid trend.
In general, NEX-GDDP reduces the mean bias and model-to-model variance for the future projection, which lowers the uncertainties arising from the CMIP5 GCMs in projecting China's future climate at large scales. Moreover, NEX-GDDP achieves far more than just national-scale mean information. As discussed in the next section, NEX-GDDP is able to deliver more detailed information on regional-to-local scales.
5 Added information on the regional scaleNEX-GDDP, as a statistically downscaled dataset with extremely high resolution, can tell us more on regional to local scales, which might be quite useful for those climate-related communities in particular. Hence, it is necessary to test its availability and confirm this advantage, as compared to assessments based on CMIP5 GCMs. In this section, for a couple of key cities, we compare NEX-GDDP's temperature extremes with those of CMIP5 GCMs, and check the future changes in summertime precipitation extremes over three key delta regions.
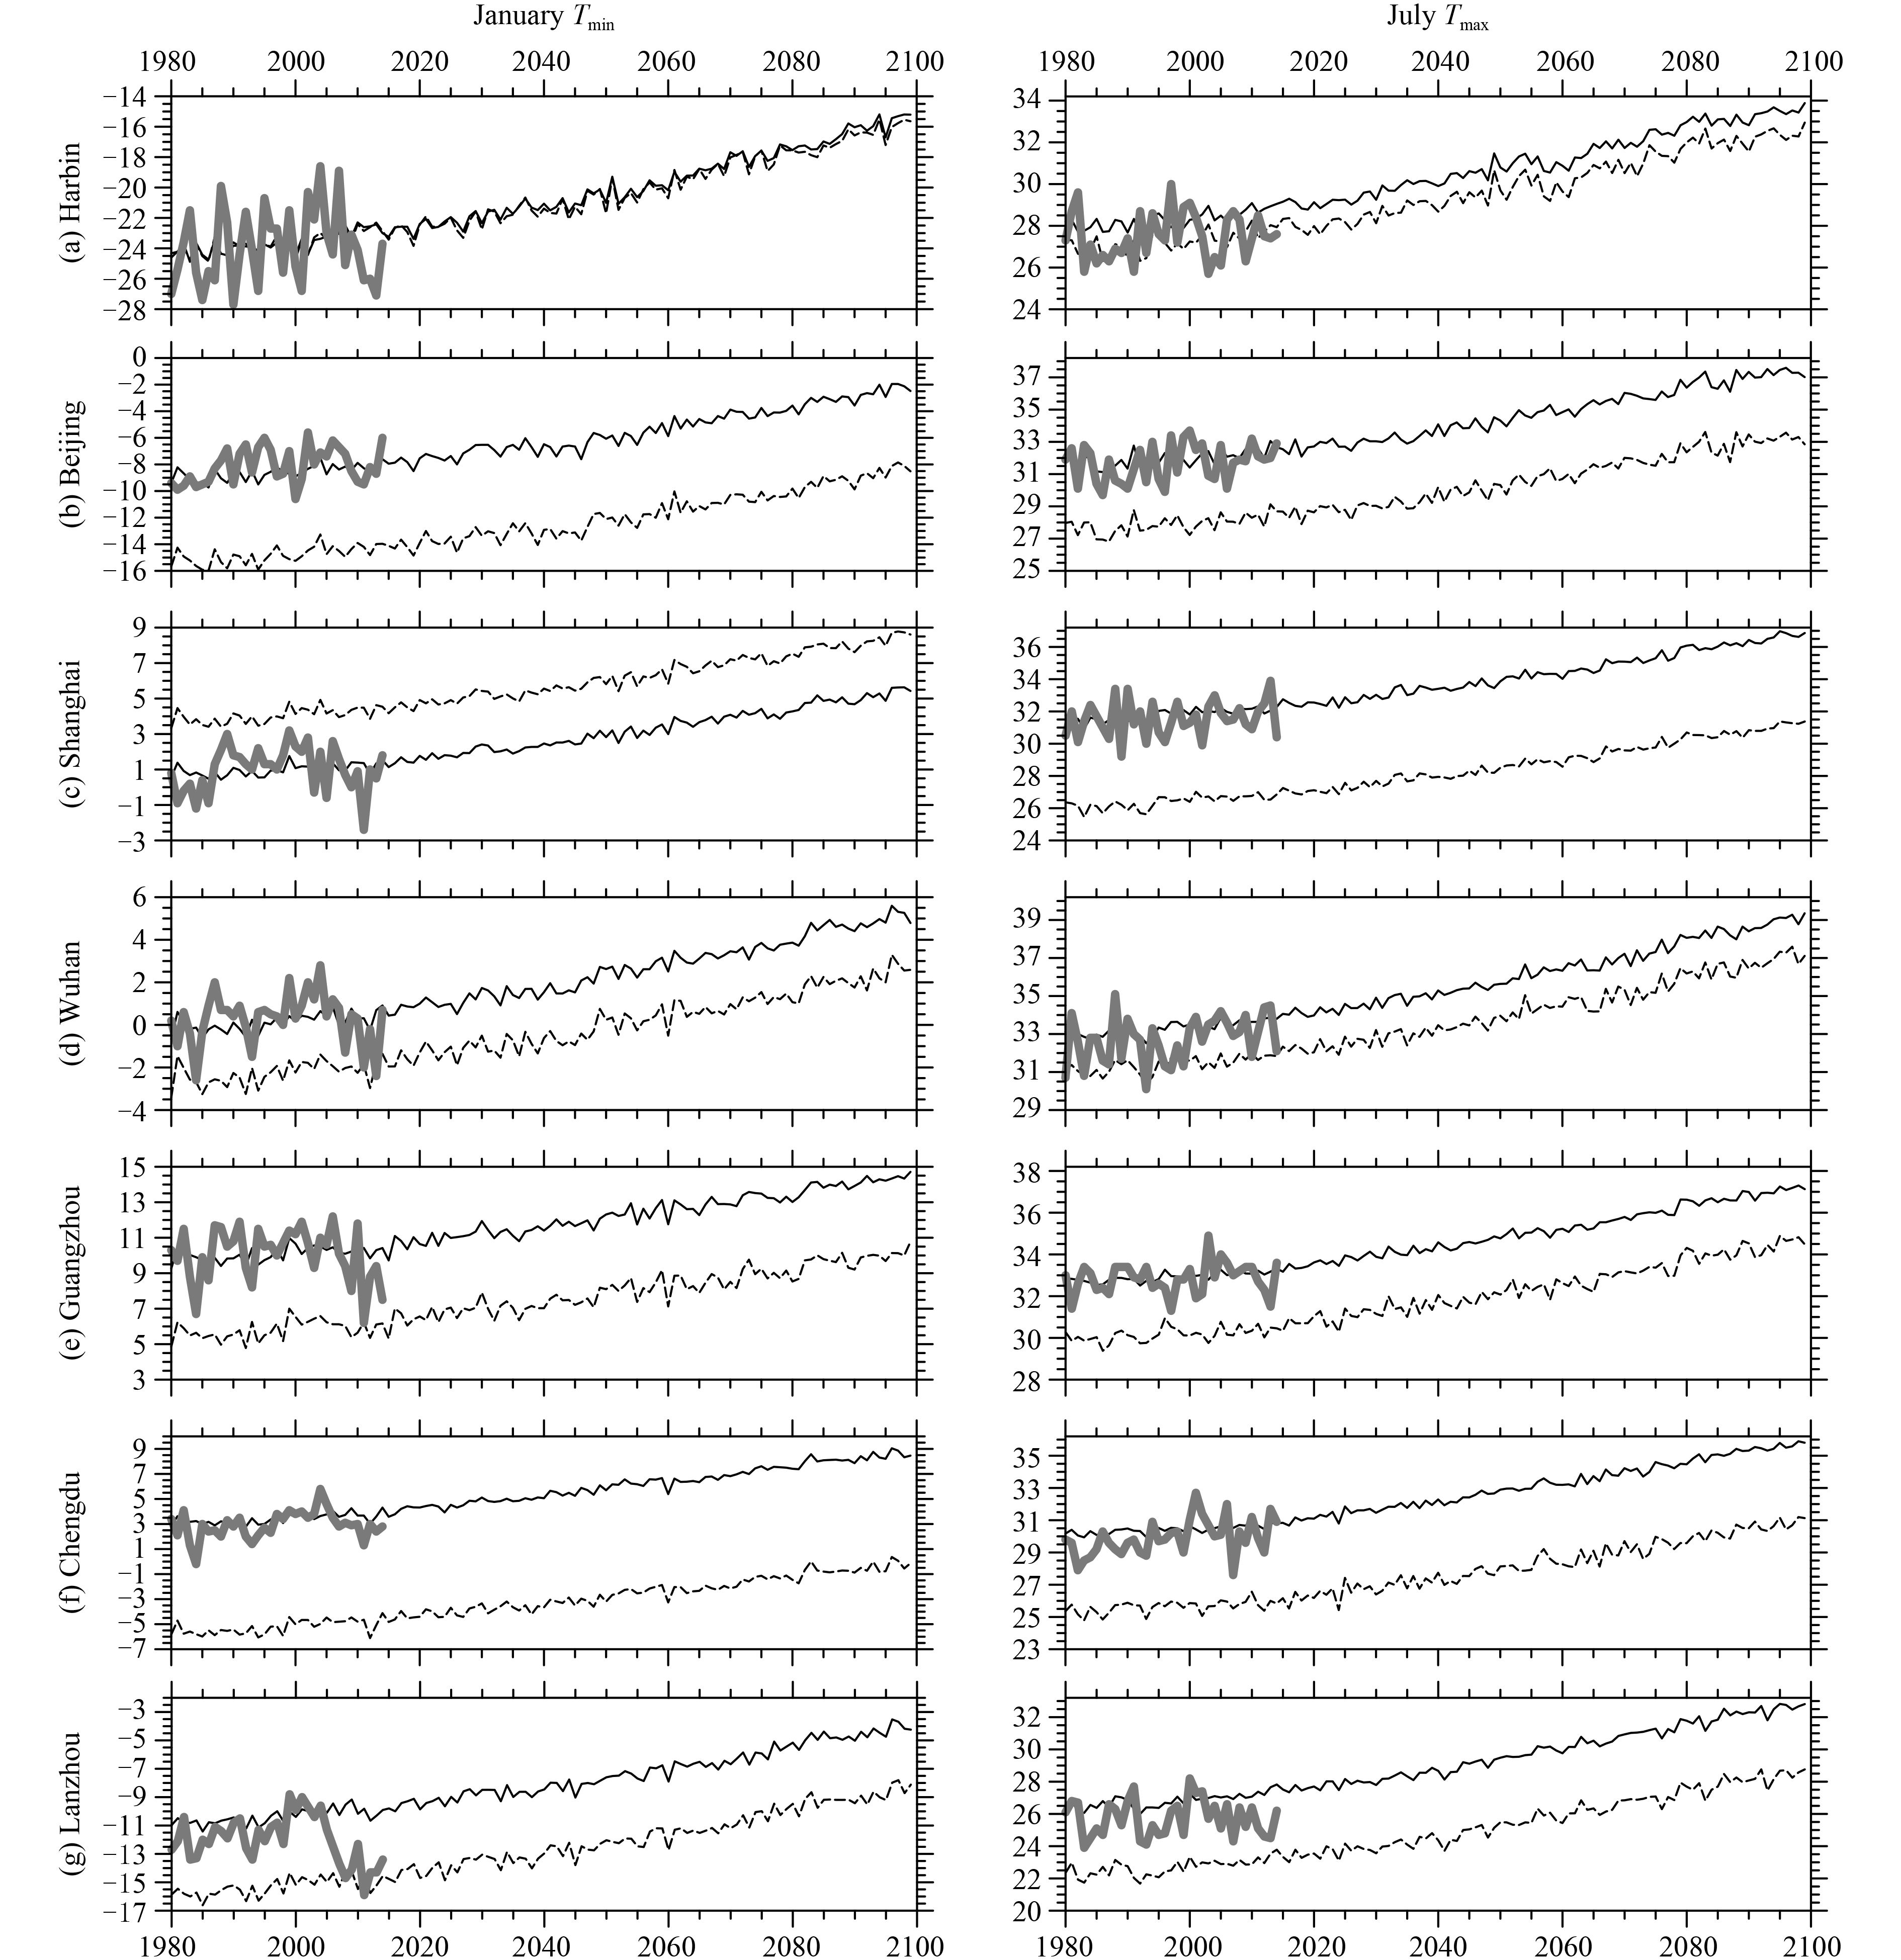
Considering both spatial representativeness of the temperature field and density of population, we select seven major cities across China: Harbin, Beijing, Shanghai, Wuhan, Guangzhou, Chengdu, and Lanzhou.Figure 10 shows the time series of daily minimum temperature in January and daily maximum temperature in July according to NEX-GDDP and CMIP5 GCMs, for the period 1980–2100. In general, NEX-GDDP presents an evidently more accurate estimate than GCMs during the past decades, as compared to observations. For better understanding the improvements offered by NEX-GDDP over the GCMs with respect to long-term climate change at the city level, an atlas of daily maximum/minimum temperature for 160 key cities is provided in the supplementary material (also available at http://dx.doi.org/10.7910/ DVN/PFU0QN). We conclude that the downscaled NEXGDDP data have greater potential than the CMIP5 models to provide city-scale climatic information, by simultaneously correcting the mean state to that of observations and maintaining the long-term trend proposed by GCMs. The conventional CMIP5 GCM projections reasonably estimate the long-term climatic response to anthropogenic warming in a grid averaged manner (above 200 km), but fail to present further details at finer scales.
|
| Fig. 10 Time series of daily minimum temperature (Tmin; °C) in January (left column) and daily maximum temperature (Tmax; °C) in July (right column), in NEX-GDDP (solid line) and CMIP5 (dashed line), on the city scale. Seven major cities are selected: (a) Harbin; (b) Beijing; (c) Shanghai; (d) Wuhan; (e) Guangzhou; (f) Chengdu; and (g) Lanzhou. The observed data (CRU) are marked as bold gray lines, for the period 1980–2014. |
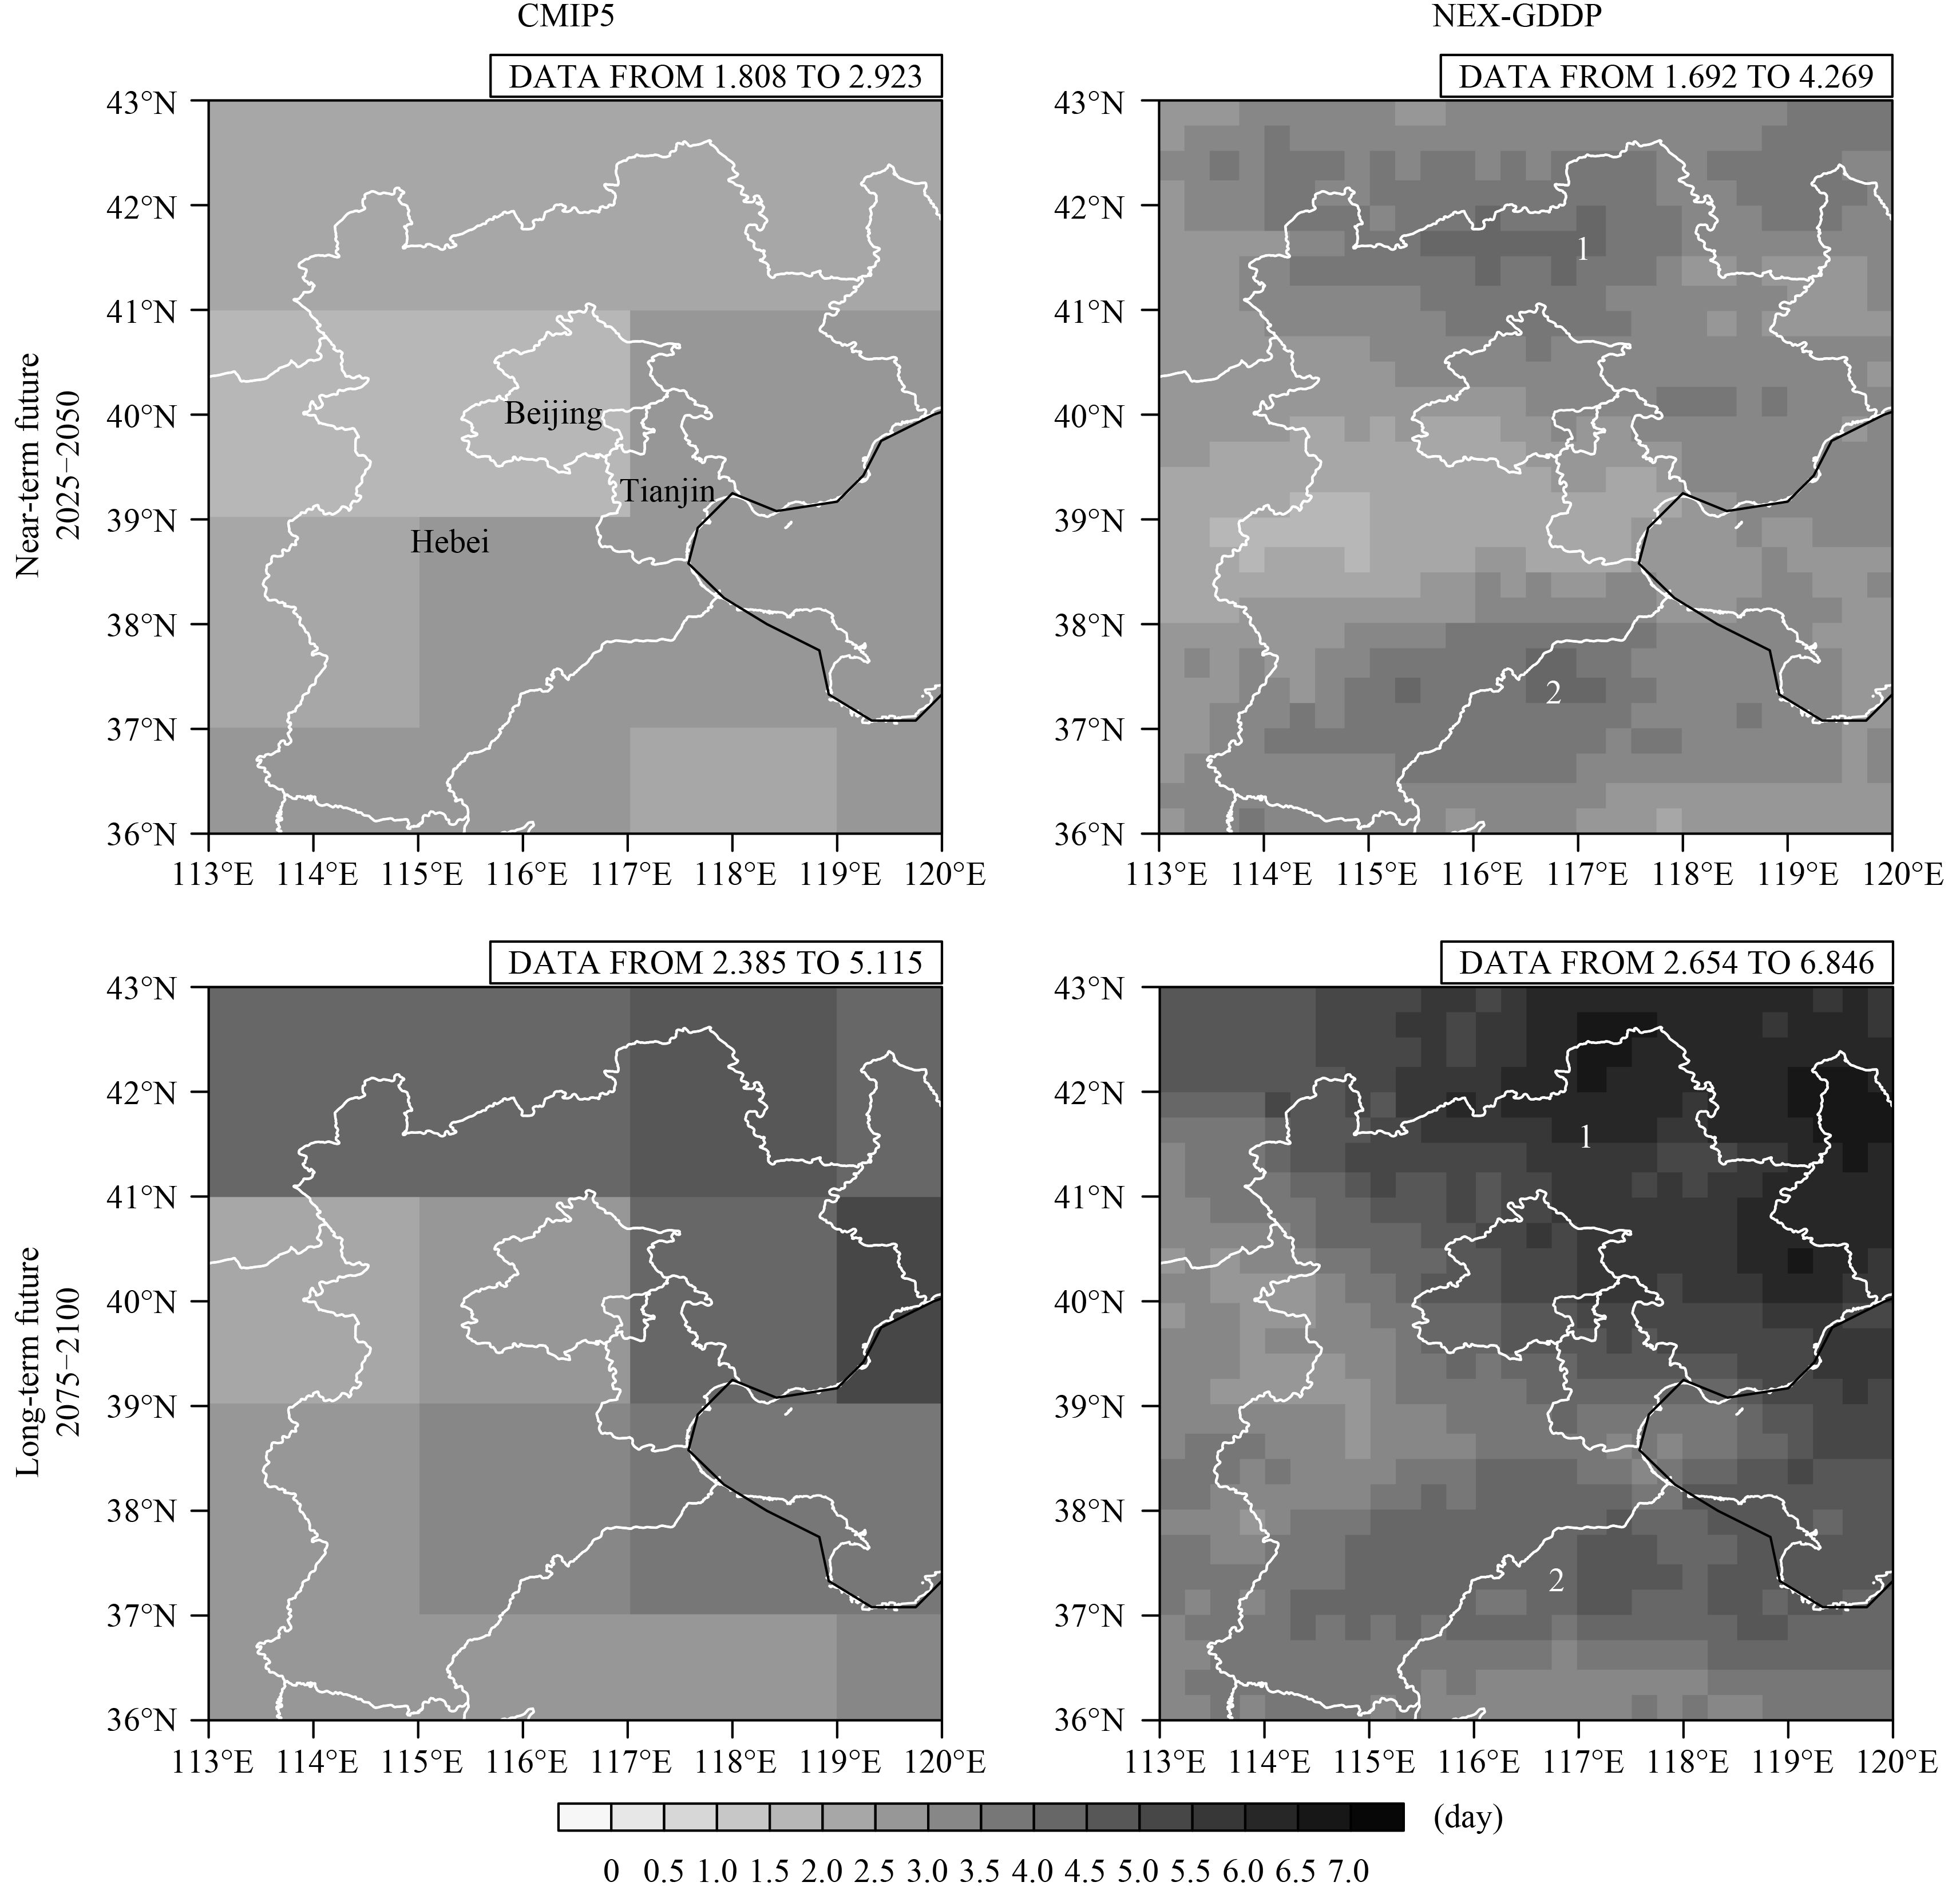
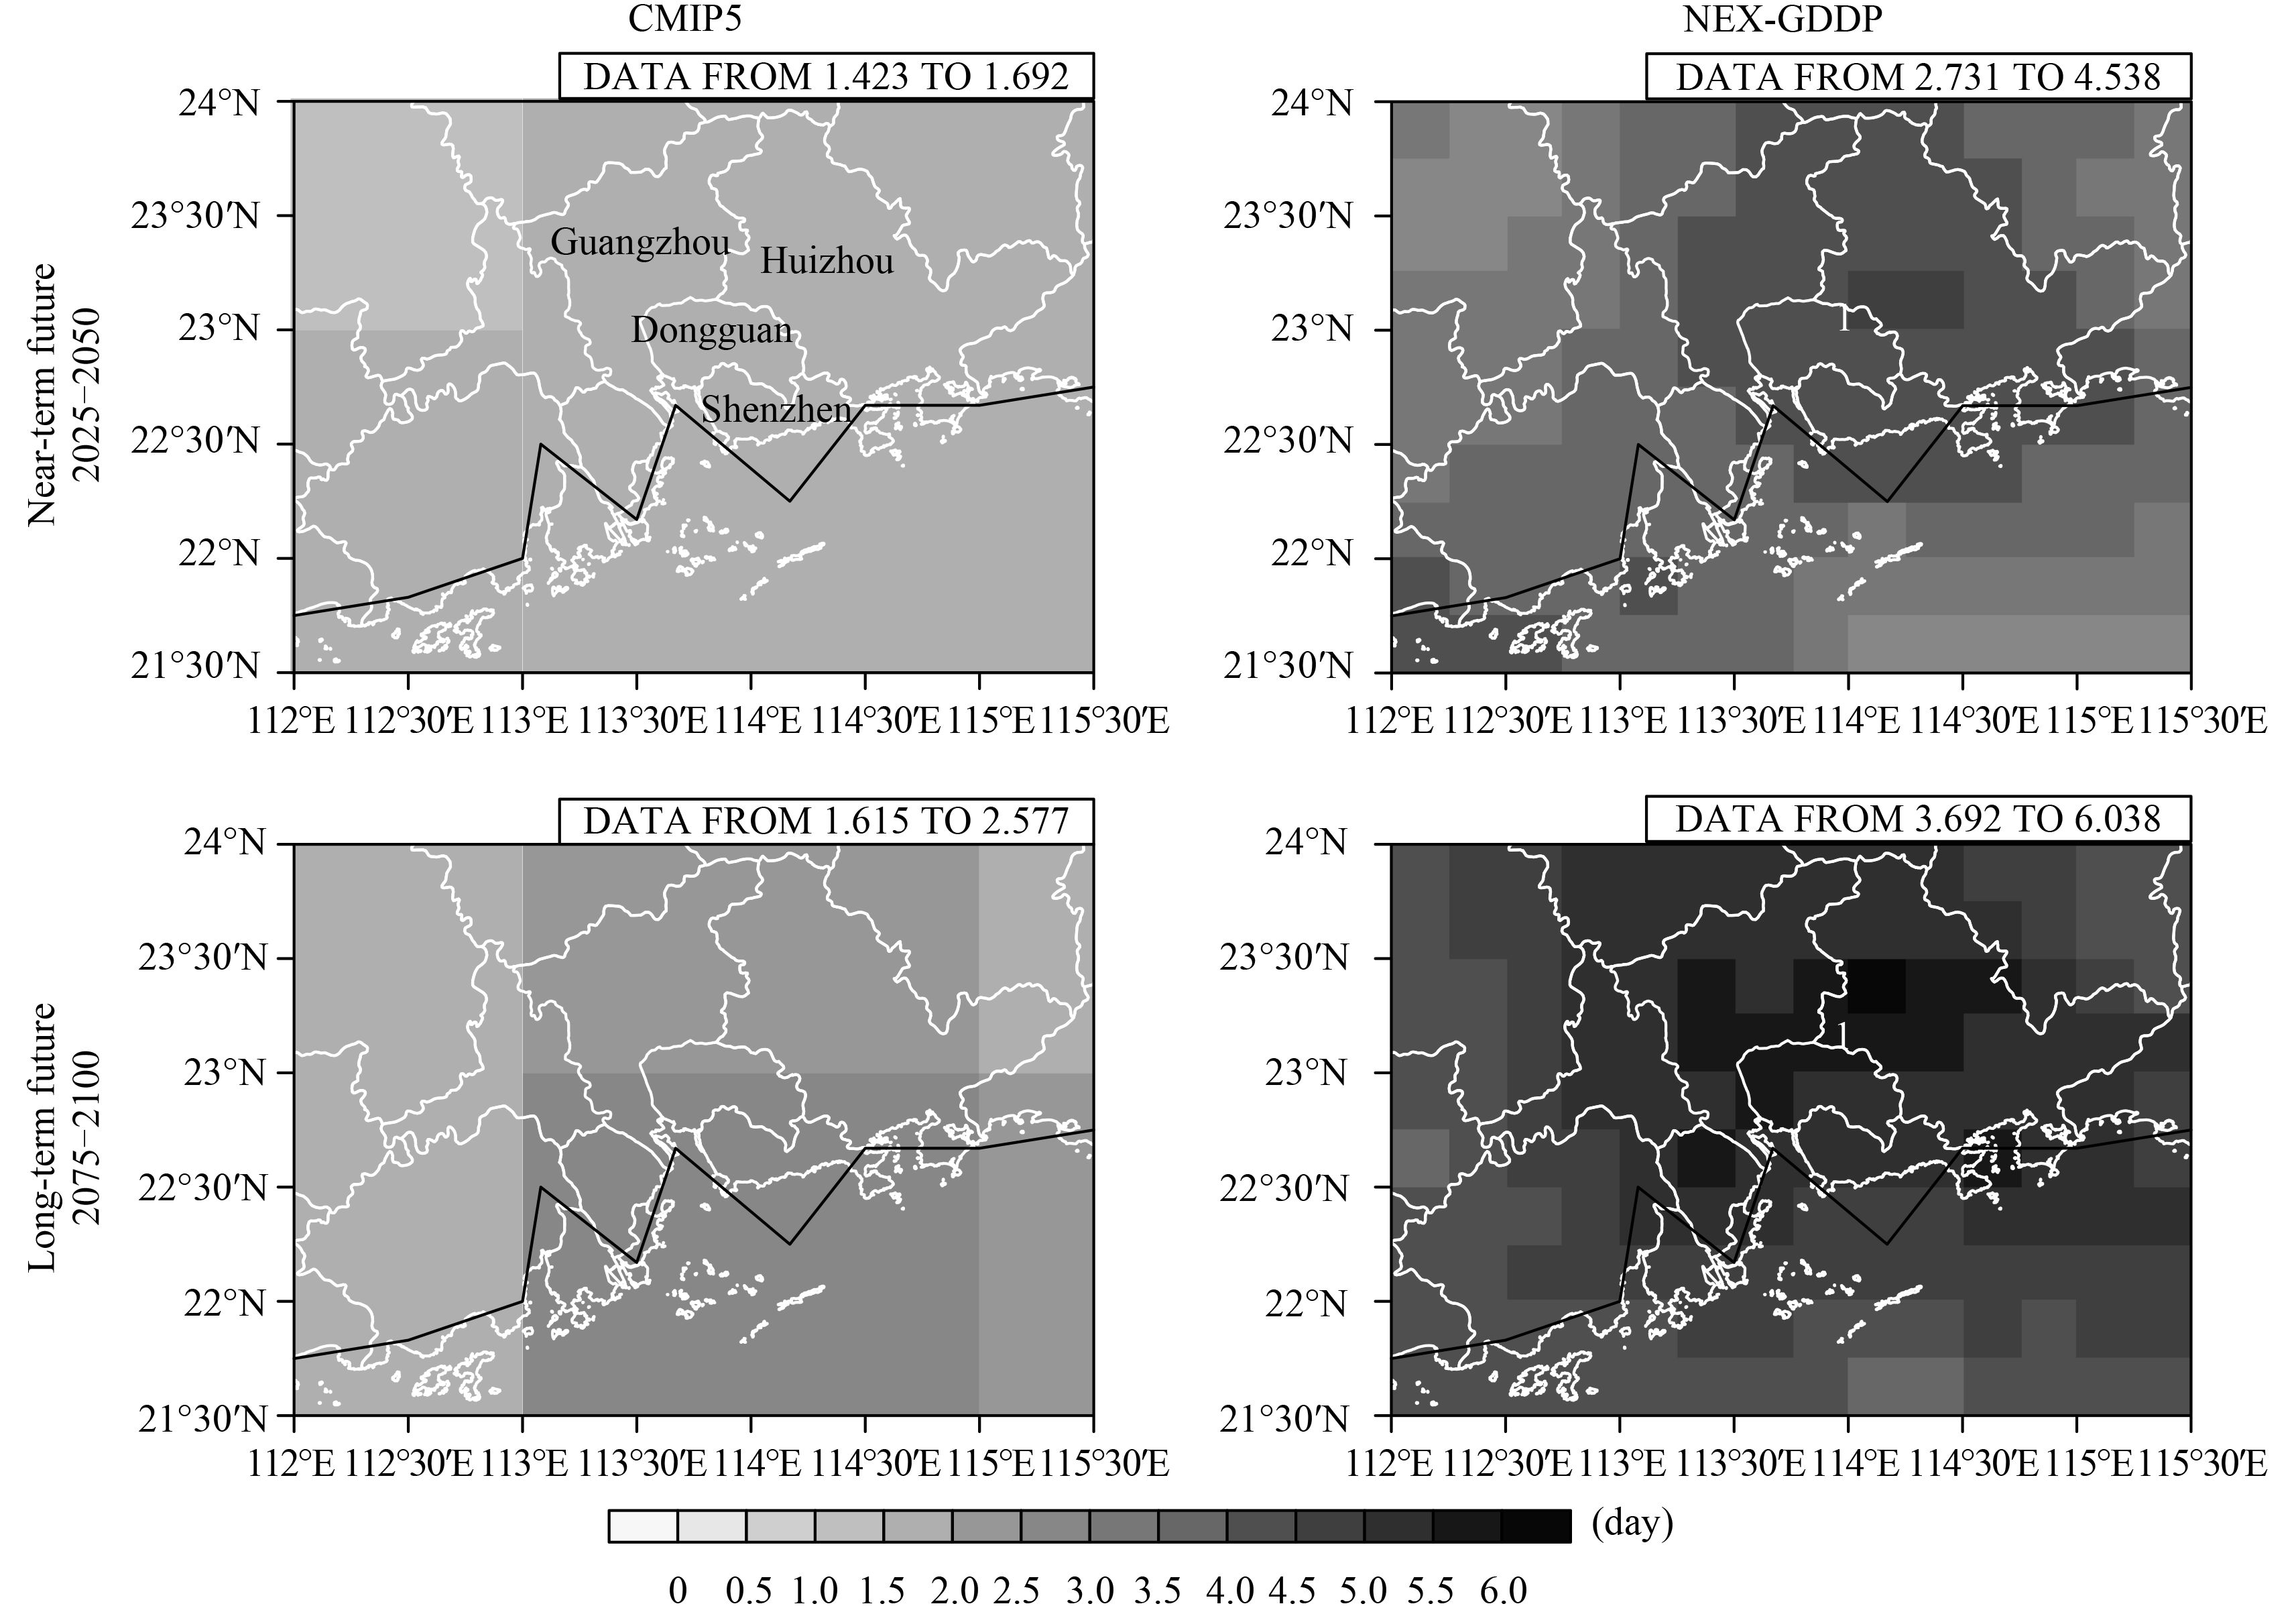
Extreme precipitation is another strong indicator that links regional climate change to people's daily activities, agricultural plans, and disaster prevention. Here, we take three vital delta regions in China as examples (the Bohai area, Yangtze River delta, and Pearl River delta) to investigate the possibility of deriving projection information on precipitation extremes from NEX-GDDP data. We define an extreme precipitation event as a day with daily averaged precipitation greater than two standard deviations of the five-day running averaged climatological rainfall in PA (1980–2005). Thus,Figs. 11–13 show the number of July precipitation extremes in the three delta areas during NF and LF. For the Bohai area, as shown in Fig. 11, northern and southern Hebei show a greater possibility of experiencing precipitation extremes. In particular, there are more than five days a month over the northeastern part of this delta, projected by NEX-GDDP, with rainfall extremes occurring in LF. The CMIP5 GCMs are completely unable to deliver such a distinct spatial pattern, due to their coarse grid resolutions. Similarly, NEX-GDDP suggests three high-risk centers, in terms of experiencing more precipitation extremes, over the Yangtze delta (northern Nanjing city, the Huzhou–Suzhou–Shanghai belt, and the southern Zhejiang Province;Fig. 12), and only one high-risk center over the Pearl delta (the Guangzhou–Dongguan–Huizhou belt;Fig. 13). Although we have no data to validate this assessment, NEX-GDDP still provides the most up-to-date and optimized high-resolution (both spatially and temporally) reference about future rainfall extremes, by merging the observed mean and GCM-estimated long-term trend, as well as applying the implicit topographic correction. This information is more useful for policymakers in long-term agricultural and ecological planning, as well as for many other scientists across a range of backgrounds.
|
| Fig. 11 The projected number of extreme precipitation days in July over the Bohai region in NF (near-term future, 2025–50; upper panels) and LF (long-term future, 2075–2100; lower panels) in NEX-GDDP (right column) and CMIP5 (left column). An extreme day is defined as a single day with a precipitation amount greater than two standard deviations above the climatological mean of 1980–2005. Two high-risk areas with more rainfall extremes in NF and LF are marked “1” and “2.” |

|
| Fig. 12 The projected number of extreme precipitation days in July over the Yangtze delta in NF (near-term future, 2025–50; upper panels) and LF (long-term future, 2075–2100; lower panels) in NEX-GDDP (right column) and CMIP5 (left column). An extreme day is defined as a single day with a precipitation amount greater than two standard deviations above the climatological mean of 1980–2005. Three high-risk areas with more rainfall extremes in NF and LF are marked “1”, “2”, and “3.” |
|
| Fig. 13 The projected number of extreme precipitation days in July over the Pearl delta in NF (near-term future, 2025–50; upper panels) and LF (long-term future, 2075–2100; lower panels) in NEX-GDDP (right column) and CMIP5 (left column). An extreme day is defined as a single day with a precipitation amount greater than two standard deviations above the climatological mean of 1980–2005. The high-risk area with more rainfall extremes in NF and LF is marked as “1.” |
NEX-GDDP, as a new-generation statistically downscaled climate dataset, offers considerable improvements over CMIP5 GCM hindcasts and projections at regional-to-local scales, with an unchanged global long-term increment. In particular, the improvements over CMIP5 GCMs are mainly in three aspects: (1) better statistics on past climatology, as compared with observations; (2) more reliable near-term and long-term projection, with a more accurate range of absolute values and smaller inter-model spread, as compared with CMIP5 GCMs; and (3) provision of added value at regional-to-local scales, over and above that provided by GCM outputs. In short, NEX-GDDP has great potential to become a widely-used high-resolution dataset for future projection and a benchmark for other climate change related studies.
NEX-GDDP significantly reduces the biases in the climatology of daily minimum and maximum temperature, as well as daily total precipitation, in terms of the spatial distribution and extremes across China (Figs. 3–5). The mean bias of 1980–2005 averaged January minimum temperature (July maximum temperature) is reduced from 1.1°C (1.3°C) to 0°C. The mean bias of July precipitation is reduced from 1.0 mm day–1 down to 0.2 mm day–1. In particular, NEX-GDDP successfully fixes the spurious precipitation center over Southwest China, which is a common terrain-induced error in GCM outputs.
NEX-GDDP largely reduces the biases of near-term and long-term projections in GCMs in terms of the range of absolute values and inter-model variance (Figs. 6–9). The increment of January minimum temperature in NF varies from below 1°C over South China to above 2.5°C over Northeast China and southern Tibet; whereas, July maximum temperature mainly increases over Xinjiang, western Tibet, western Inner Mongolia, and North China. The increment of July precipitation in NF (LF) centers on the southern part of Northeast China and the southern parts of Southwest China and Tibet, with an anomaly of more than 1 mm day–1 (3 mm day–1).
NEX-GDDP provides not only a seamless time series from the past 50 years to the future 100 years, but also much added value at regional-to-local scales. We investigate the possibility of using NEX-GDDP at finer scales by checking the temperature extremes at the city scale (Fig. 10) and the probability of precipitation extremes for three key deltas in China (Figs. 11–13). We conclude that NEX-GDDP evidently corrects the extremes of January (July) temperature for seven typical cities across China, ranging from 0°C (1°C) at Harbin to more than 8°C (5°C) at Chengdu (Shanghai). For precipitation extremes, we speculate that northern Hebei, the belt from southern Jiangsu to Shanghai, and the Guangzhou–Dongguan–Huizhou belt, are high-risk areas in terms of their probability of experiencing heavy rainfall in both NF and LF.
Compared to CMIP5 GCMs, NEX-GDDP provides the research community with a better tool and a new chance to explore China's climate change in the future, with reliable estimation at finer resolutions. We hope more scientists from a diverse range of disciplines, such as hydrology and water resource management, agricultural planning, and ecological and environmental engineering, choose to employ NEX-GDDP to obtain China's detailed potential environmental changes in the near and distant future.
Acknowledgements . We thank Ms. Qingzhao Zhu and Mr. Wengui Liang for helpful discussions.
| S. An, X. Wu Z., P. Li G., et al ,2015: Global monsoon dynamics and climate change. Annual Review of Earth and Planetary Sciences , 43 , 29–77. |
| P. V. Ayar, M. Vrac, S. Bastin, et al ,2016: Intercomparison of statistical and dynamical downscaling models under the EURO- and MED-CORDEX initiative framework: Present climate evaluations. Climate Dyn. , 46 , 1301–1329. |
| Y. H. Ding, J. C. L. Chan ,2005: The East Asian summer monsoon: An overview. Meteor. Atmos. Phys. , 89 , 117–142. |
| R. Grose Ekström, P. H. Whetton M. ,2015: An appraisal of downscaling methods used in climate change research. Wiley Interdisciplinary Reviews: Climate Change , 6 , 301–319. |
| L. J. Fan, C. B. Fu, D. L. Chen ,2005: Review on creating future climate change scenarios by statistical downscaling techniques. Adv. Earth Sci. , 20 , 320–329. |
| L. J. Fan, C. B. Fu, D. L. Chen ,2007: Estimation of local temperature change scenarios in North China using statistical downscaling method. Chinese J. Atmos. Sci. , 31 , 887–897. |
| Rockel Feser, von Storch F., et al ,2011: Regional climate models add value to global model data: A review and selected examples. Bull. Amer. Meteor. Soc. , 92 , 1181–1192. |
| Flato, G., J. Marotzke, B. Abiodun, et al., 2013: Evaluation of Climate Models.Climate Change 2013:The Physical Science Basis. Contribution of Working Group I to the Fifth Assessment Report of the Intergovernmental Panel on Climate Change, T. F. Stocker et al., Eds., Cambridge University Press, Cambridge, United Kingdom and New York, NY, USA. |
| C. B. Fu, S. Y. Wang, Z. Xiong, et al ,2005: Regional climate model intercomparison project for Asia. Bull. Amer. Meteor. Soc. , 86 , 257–266. |
| X. J. Gao, Y. Shi, F. Giorgi ,2011: A high resolution simulation of climate change over China. Sci. China Earth Sci. , 54 , 462–472. |
| F. Giorgi ,1990: Simulation of regional climate using a limited area model nested in a general circulation model. J. Climate , 3 , 941–963. |
| M. Gutiérrez, San-Martín J., Brands D., et al ,2013: Reassessing statistical downscaling techniques for their robust application under climate change conditions. J. Climate , 26 , 171–188. |
| Kundzewicz, Z. W., L. J. Mata, N. W. Arnell, et al., 2007: Freshwater resources and their management.Climate Change 2007:Impacts,Adaptation and Vulnerability. Contribution of Working Group II to the Fourth Assessment Report of the Intergovernmental Panel on Climate Change, M. L. Parry et al., Eds., Cambridge University Press, Cambridge, UK. |
| J.-W. Lee, S.-Y. Hong, E.-C. Chang, et al ,2014: Assessment of future climate change over East Asia due to the RCP scenarios downscaled by GRIMs-RMP. Climate Dyn. , 42 , 733–747. |
| L. R. Leung, L. O. Mearns, F. Giorgi, et al ,2003: Regional climate research: Needs and opportunities. Bull. Amer. Meteor. Soc. , 84 , 89–95. |
| Y. H. Liu, W. D. Guo, J. M. Feng, et al ,2011: A summary of methods for statistical downscaling of meteorological data. Adv. Earth Sci. , 26 , 837–847. |
| C. M. Liu, W. B. Liu, G. B. Fu, et al ,2012: A discussion of some aspects of statistical downscaling in climate impacts assessment. Adv. Water Sci. , 23 , 427–437. |
| S. Y. Liu, W. Gao, X.-Z. Liang ,2013: A regional climate model downscaling projection of China future climate change. Climate Dyn. , 41 , 1871–1884. |
| D. Maraun, F. Wetterhall, A. M. Ireson, et al ,2010: Precipitation downscaling under climate change: Recent developments to bridge the gap between dynamical models and the end user. Rev. Geophys. , 48 , RG3003. |
| E. P. Maurer, H. G. Hidalgo ,2008: Utility of daily vs. monthly large-scale climate data: An intercomparison of two statistical downscaling methods. Hydrology and Earth System Sciences , 12 , 551–563. |
| L. O. Mearns, I. Bogardi, F. Giorgi, et al ,1999: Comparison of climate change scenarios generated from regional climate model experiments and statistical downscaling. J. Geophys. Res. , 104 (D6) , 6603–6621. |
| Meehl, G. A., T. F. Stocker, W. D. Collins, et al., 2007: Global climate projections.Climate Change 2007:The Physical Science Basis. Contribution of Working Group I to the Fourth Assessment Report of the Intergovernmental Panel on Climate Change, S. D. Solomon et al., Eds., Cambridge University Press, Cambridge, UK and New York, NY, USA. |
| M. Meinshausen, S. J. Smith, K. Calvin, et al ,2011: The RCP greenhouse gas concentrations and their extensions from 1765 to 2300. Climatic Change , 109 , 213–241. |
| J. S. Pal, F. Giorgi, X. Q. Bi, et al ,2007: Regional climate modeling for the developing world: The ICTP RegCM3 and RegCNET. Bull. Amer. Meteor. Soc. , 88 , 1395–1409. |
| C. Y. Park, S.-K. Min, D. Lee, et al ,2016: Evaluation of multiple regional climate models for summer climate extremes over East Asia. Climate Dyn. , 46 , 2469–2486. |
| R. A. Pielke, R. L. Wilby ,2012: Regional climate downscaling: What's the point?. EOS , 93 , 52–53. |
| Y. J. Qi, C. Qian, Z. W. Yan ,2016: An alternative multi-model ensemble mean approach for near-term projection. Int. J. Climatol. . DOI:10.1002/joc.4690 |
| J. Sheffield, G. Goteti, E. F. Wood ,2006: Development of a 50-yr high-resolution global dataset of meteorological forcings for land surface modeling.. J. Climate , 19 , 3088–3111. |
| Y. Shi, X. J. Gao, J. Wu, et al ,2011: Changes in snow cover over China in the 21st century as simulated by a high resolution regional climate model. Environ. Res. Lett. , 6 , 045401. |
| M. A. Sunyer, H. Madsen, P. H. Ang ,2012: A comparison of different regional climate models and statistical downscaling methods for extreme rainfall estimation under climate change. Atmos. Res. , 103 , 119–128. |
| K. E. Taylor, R. J. Stouffer, G. A. Meehl ,2012: An overview of CMIP5 and the experiment design. Bull. Amer. Meteor. Soc. , 93 , 485–498. |
| B. Thrasher, E. P. Maurer, C. McKellar, et al ,2012: Technical note: Bias correcting climate model simulated daily temperature extremes with quantile mapping. Hydrology and Earth System Sciences , 16 , 3309–3314. |
| B. Thrasher, J. Xiong, W. L. Wang, et al ,2013: Downscaled climate projections suitable for resource management. EOS , 94 , 321–323. |
| R. L. Wilby, T. M. L.Wigley ,1997: Downscaling general circulation model output: A review of methods and limitations. Progress in Physical Geography , 21 , 530–548. |
| A. W. Wood, E. P. Maurer, A. Kumar, et al ,2002: Long-range experimental hydrologic forecasting for the eastern United States. J. Geophys. Res. , 107 , ACL 6-1–ACL 6-15. |
| A. W. Wood, L. R. Leung, V. Sridhar, et al ,2004: Hydrologic implications of dynamical and statistical approaches to downscaling climate model outputs. Climatic Change , 62 , 189–216. |
| J. Gao Wu, L Xu J., et al ,2015: Regional climate change and uncertainty analysis based on four regional climate model simulations over China. Atmos. Oceanic Sci. Lett. , 8 , 147–152. |
| Y. K. Xue, Z. Janjic, J. Dudhia, et al ,2014: A review on regional dynamical downscaling in intraseasonal to seasonal simulation/prediction and major factors that affect downscaling ability. Atmos. Res. , 147-148 , 68–85. |
| R. C. Yu, L. Wei, X. H. Zhang, et al ,2000: Climatic features related to eastern China summer rainfalls in the NCAR CCM3. Adv. Atmos. Sci. , 17 , 503–518. |
 2017, Vol. 31


