The Chinese Meteorological Society
Article Information
- ZHANG Yaocun, CHEN Jiao . 2017.
- Characterizing the Winter Concurrent Variation Patterns of the Subtropical and Polar-Front Jets over East Asia. 2017.
- J. Meteor. Res., 31(1): 160-170
- http://dx.doi.org/10.1007/s13351-016-6094-y
Article History
- Received July 8, 2016
- in final form September 12, 2016
In the upper troposphere and lower stratosphere over East Asia, there are two branches of narrow and strong jet streams with large horizontal and vertical wind shears, which are referred to as the East Asian subtropical jet (EASJ) and polar-front jet (PFJ) or eddy-driven jet. These two jet streams comprise an important system that affects the weather and climate in the East Asian monsoon region (Tao et al., 1958;Ye and Zhu, 1958;Ye et al., 1958;Gao et al., 1962;Lu et al., 2013;Huang et al., 2014;Wang and Zhang, 2015). It is important to investigate the variation features of these jet streams to improve weather forecasts and climate predictions in East Asia.
It is well known that the subtropical jet is driven by angular momentum transport from the tropics through the Hadley cell, while the PFJ is driven by baroclinic eddies. Apparently, these two jets have different driving mechanisms. In winter, the subtropical jet stream extends northeasterly from the southern side of the Tibetan Plateau to the western Pacific, and the northern PFJ prolongs eastwards from the northern side of the Tibetan Plateau and converges with the southern subtropical jet over the western Pacific, whereupon the strongest jet stream is formed (Cressman, 1981;Sheng, 1986;Zou et al., 1990). Moreover, the jet streams together occupy the frontal areas in the upper and lower atmosphere, where much atmospheric disturbance and many storms develop, leading to severe weather and climate events, such as heavy rainfall and cold surges (Hoskins and Valdes, 1990;Gao and Tao, 1991;Chang et al., 2002;Hoskins and Hodges, 2002;Ding, 2005;Bengtsson et al., 2006;Ren and Zhang, 2007;Ye and Zhang, 2014). Previous studies have focused on the individual variations of the jets and their climate effects. However, less attention has been paid to the concurrent variation between the subtropical jet and PFJ. A schematic diagram of the Northern Hemisphere winter jet stream, illustrated originally by Riehl (1962) and Palmén and Newton (1969), and then altered by Lee and Kim (2003), shows that the variations between the two jets are out-of-phase; in regions where the subtropical jet forms at a relatively lower latitude (and is presumably weak), an eddy-driven jet forms at a much higher latitude, and vice versa. As a result, in regions where the subtropical jet and PFJ are close to one another, one expects to see a single maximum in the zonal wind; while in regions where these two jets are well separated, a double maxima may be seen. As the westerly wind prevails along the subtropical jet and the PFJ, it is difficult to clearly differentiate between the two jet stream branches geographically by using the monthly or seasonal mean data (Yang et al., 2002;Mao et al., 2007;Ren et al., 2010a). Meanwhile, due to the significant transient feature of the PFJ, there are apparent changes in its intensity and location, leading to an ambiguous mean location. The PFJ's structure and its association with the subtropical jet, as well as its impact on East Asian weather and climate, remain unclear. The objective of this study, therefore, is to characterize the concurrent variation of subtropical jet and PFJ over East Asia on different timescales, and to examine the impacts of the jet concurrent variation patterns on the atmospheric circulation in mid–high latitude regions and climate anomalies in China.
The paper is organized as follows. Section 2 provides a brief introduction to the data used in this study. Section 3 describes the structure of the upper-level jet stream over East Asia. The concurrent variation relationship and modes of upper-level jet streams and the impacts on the atmospheric circulation in mid–high latitude regions and climate anomalies in China are illustrated in Section 4. Conclusions are given in Section 5.
2 DataNCEP–NCAR reanalysis data for zonal and meridional wind, geopotential height and temperature are used in this study (Kalnay et al., 1996). The time period covers 1979–2014. The horizontal resolution of the data is 2.5° latitude × 2.5° longitude, with 17 levels in the vertical direction. The daily data are converted to monthly (seasonal) or pentad means. Observational temperature and precipitation data at 724 stations, provided by the National Meteorological Information Center, are also used in this study.
3 Structure of the upper-level jet stream over East AsiaThe westerly wind in the upper troposphere and lower stratosphere is strong in the mid–high latitude regions. We examine the westerly wind speed distribution at upper levels.Figure 1 shows the wind speed distribution at the 300-hPa level in the winter season (December, January, and February). The strong wind belt with wind speed larger than 30 m s–1 is confined to a narrow extent to the west of 110°E and becomes broader to the east of 110°E. The strongest westerly wind speed is located over Northwest Pacific to the southeast of Japan, where the East Asian subtropical jet center is situated. There is a ridge area with high wind speed near 45°–60°N, though it is not the strongest wind center, which corresponds to the PFJ active areas. However, it is not easy to differentiate between the PFJ and subtropical jet in the seasonal mean field. To examine the horizontal structure of jet streams in the upper levels, the jet occurrence numbers at 300 hPa in winter are calculated. The statistical methodology in this study is the same as in Ren et al. (2010a) and Xue and Zhang (2017). The calculation is performed to determine the maximum wind speed centers over the region (10°–70°N, 60°–180°E), if the identified center satisfies the following two criteria: (1) the center wind speed is larger than 30 m s–1, and (2) the wind speed at eight grid points around the center point is less than that at the center point. If these two criteria are met, then that particular center position is determined as a jet center. This calculation is carried out by using the daily wind data in winter season, and the jet occurrence numbers at 300 hPa are obtained and illustrated in Fig. 1. It is found that there are two regions with larger jet occurrence numbers over East Asia in the winter season: one stretches from the southern Tibetan Plateau to the ocean over Japan, corresponding to the climate mean position of the subtropical westerly jet; and the other resides over the region (50°–60°N, 60°–110°E), which is the climate mean position of the PFJ. Additionally, the occurrence numbers of subtropical westerly jets are more than those of the PFJs. The jet occurs less frequently to the northern side of the Tibetan Plateau. Thus, the latitudes of the northern Tibetan Plateau are usually considered as a geographical border for the subtropical jet and PFJ (Ren et al., 2010b).

|
| Fig. 1 Climatological distribution of the occurrence numbers of the jet core (shaded) and wind speed (contours; m s–1) at 300 hPa in winter. The two regions with rectangles indicate the key areas used to define the EASJ and PFJ intensities, respectively. |
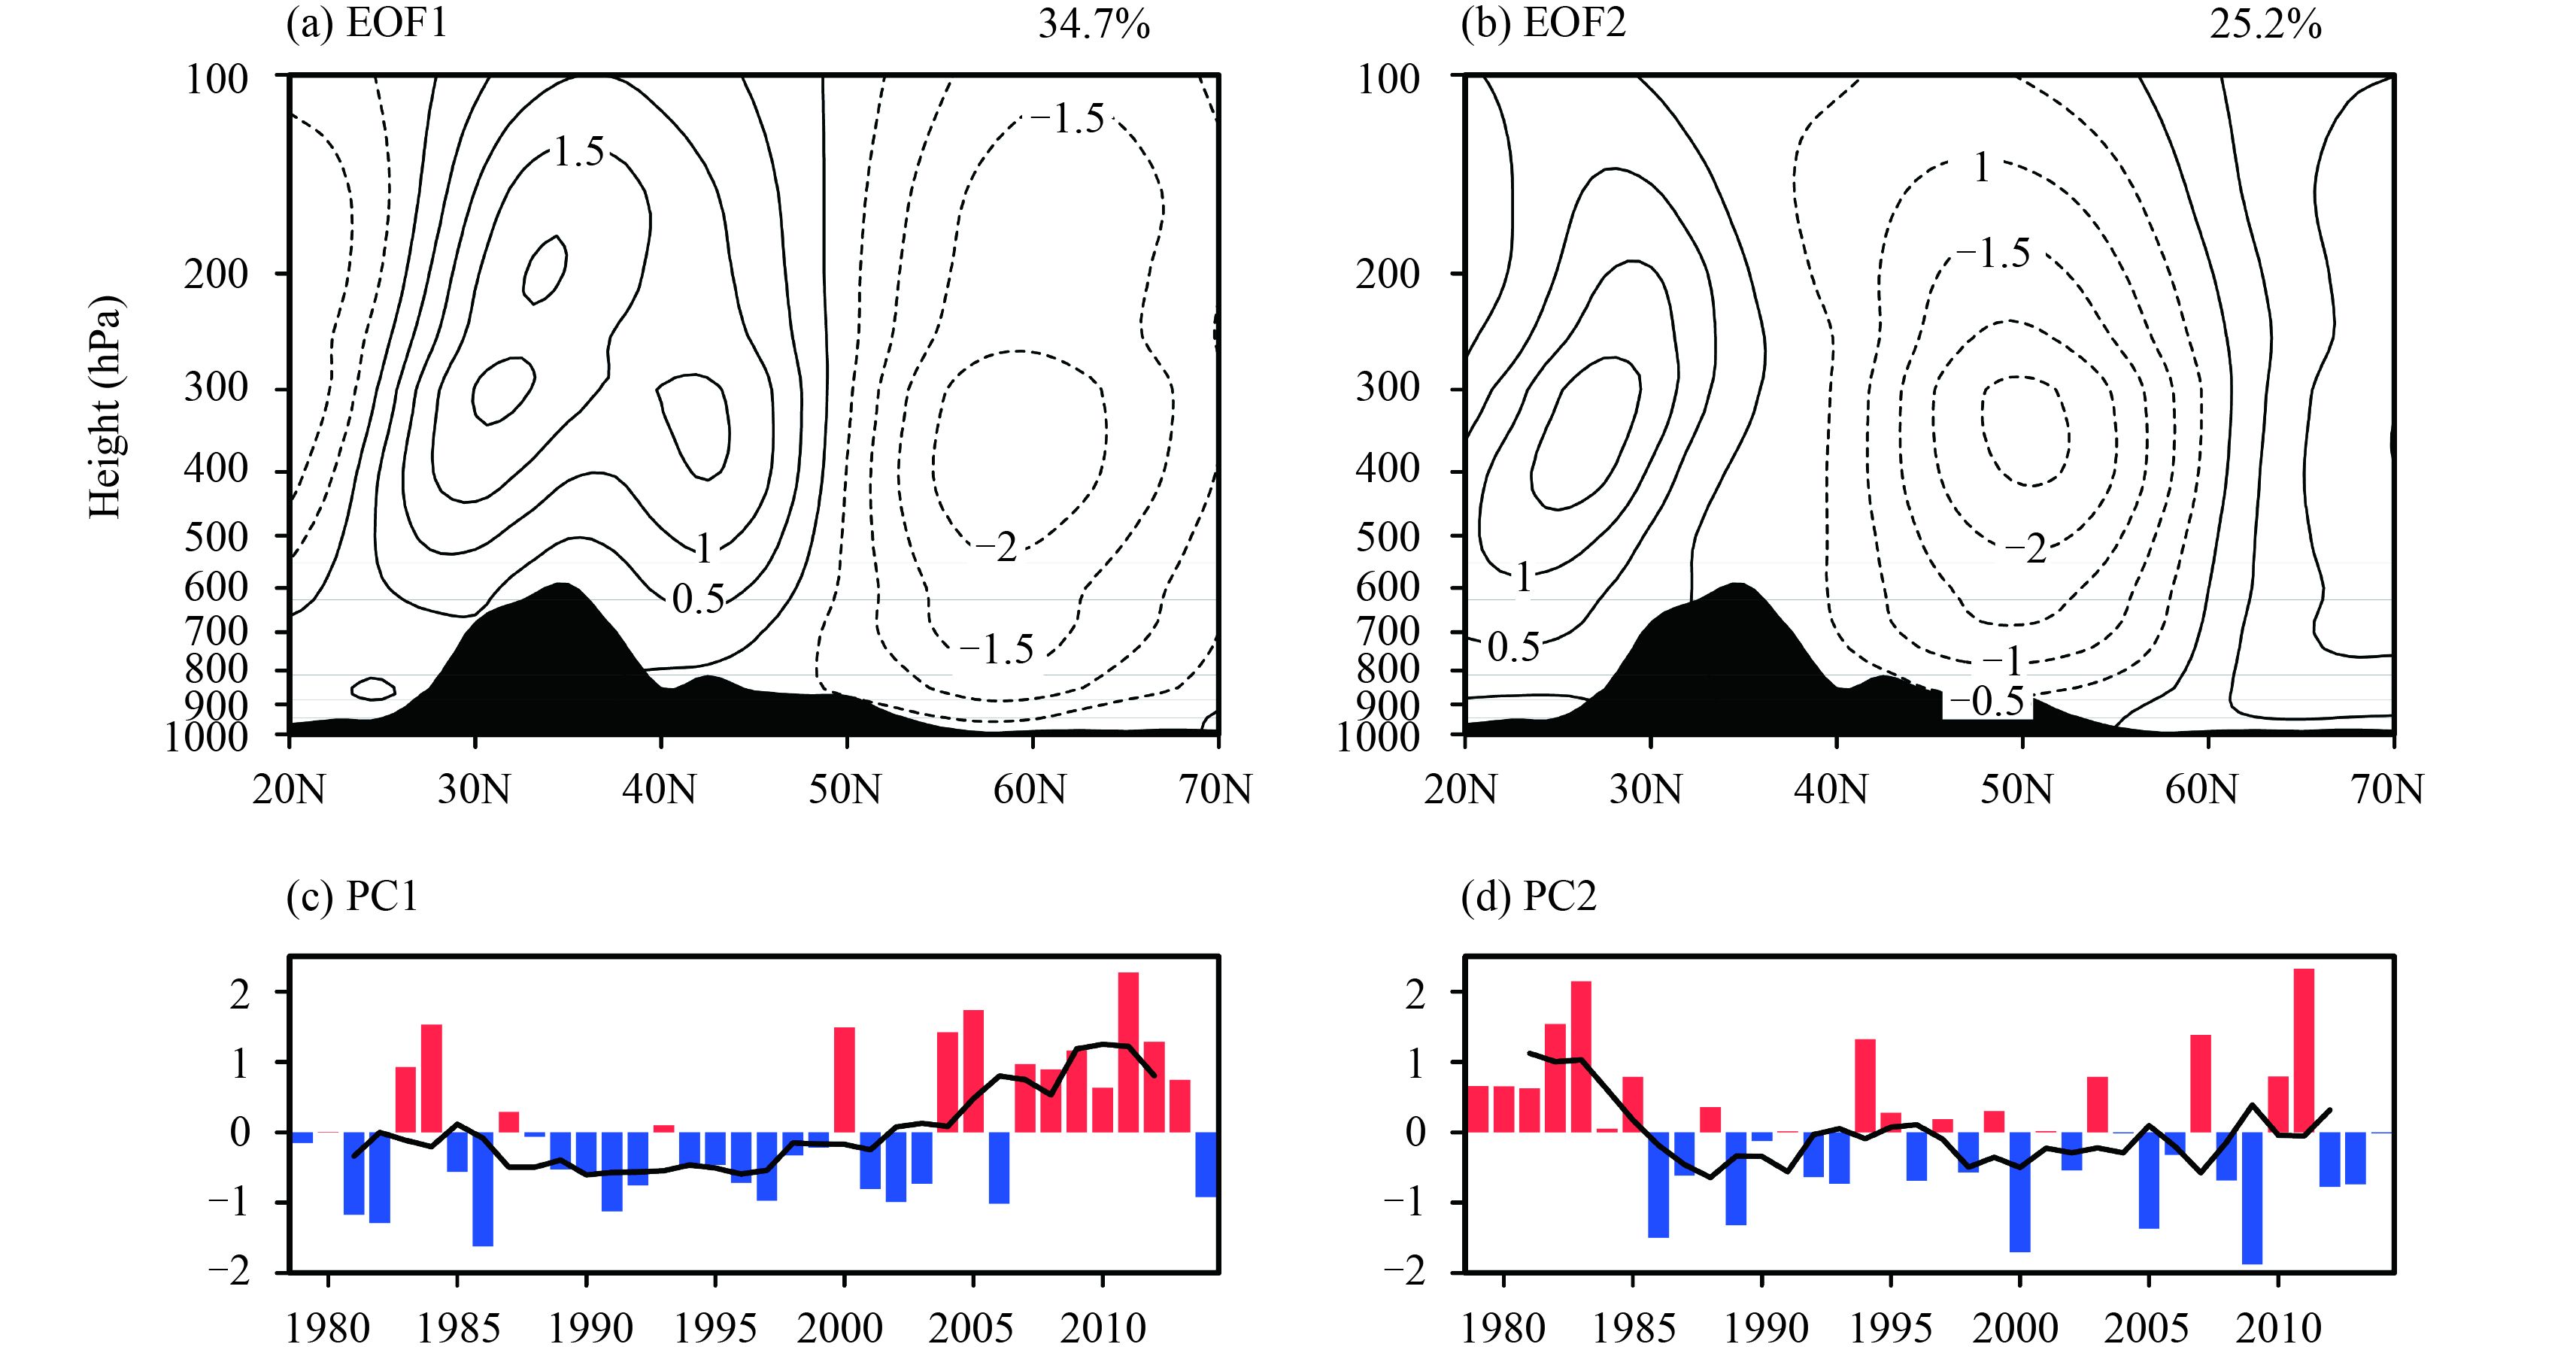
As indicated in Fig. 1, the PFJ and the subtropical jet show discernable spatial distribution patterns to the west of 120°E over the East Asian land mass. Here, we first focus on the jet variability modes over the East Asian land area on the interannual timescale and apply empirical orthogonal function (EOF) analysis to the winter zonal-mean zonal wind averaged from 70° to 100°E. The EOF analysis is performed over the region of 20°–70°N within 1000–100 hPa, with mass-weighted data of the same contribution to the total variance (Thompson and Wallace, 2000).Figure 2 shows the spatial patterns of the leading two modes (EOF1 and EOF2) and the corresponding time series (PC1 and PC2). The first two EOF modes explain 38.4% and 23.2% of the total variance, respectively. A dipole pattern centered at the PFJ dominates the EOF1 mode (Fig. 2a), with maximum out-of-phase anomalies along 35° and 60°N, respectively. Therefore, the first leading mode implies meridional movement of the PFJ. Meanwhile, there is also a dipole pattern around the subtropical jet, with negative anomalies to the south of 25°N. However the north/south shift of the subtropical jet exhibits less significance, considering that its intensity is steadier and stronger than the PFJ (Fig. 1). Thus, EOF1 depicts the meridional displacement of the two jets, which is consistent with the strengthened westerly wind over subtropical areas. The second leading mode (Fig. 2b) has two anomaly centers located along the subtropical jet and PFJ, respectively, representing the out-of-phase variation in the intensity between the two jets. It is notable that EOF2 depicts a large relative change in the strength of the PFJ than the subtropical jet due to apparent diversity of climatological intensity between the two jets. The first two leading modes reflect the concurrent variation of the PFJ and the subtropical jet, which is associated with the atmospheric internal variability over the East Asian land mass. The corresponding time series of EOF1 (Fig. 2c) and EOF2 (Fig. 2d) both show notable interdecadal variability. PC1 experiences an interdecadal change from negative phase to positive phase in the early 2000s, while PC2 undergoes positive phases before the mid 1980s, followed by negative phases with some interannual variations.
|
| Fig. 2 (a, b) EOF modes of zonal wind averaged from 70° to 100°E and (c, d) the corresponding time series in winter. The percentages denote the explained variance of each mode. The black shaded area indicates the terrain. |
To characterize the jet intensity variations and further detect the concurrent relationships of the subtropical jet and PFJ over the East Asian land mass on different timescales, we select two key areas over the two jets, marked in Fig. 1. Considering both the features of wind velocity and the occurrence frequency of jet cores in winter, two regions over 25°–30°N, 70°–100°E and 50°–60°N, 70°–100°E are defined as the key areas for the EASJ and PFJ, respectively. Therefore, the seasonal mean EASJ and PFJ intensities are identified as the averaged wind speed at 300 hPa over the respective regions in winter. Since the wind speed of the EASJ is much larger than that of the PFJ, the time series of the normalized EASJ and PFJ intensity are shown in Fig. 3. Clearly, both the intensities of the EASJ and PFJ show a significant interannual variability, and the correlation coefficient is –0.35, implying a notably out-of-phase variation between the PFJ and the subtropical jet.

|
| Fig. 3 Normalized time series of PFJ and EASJ intensity in winter. |
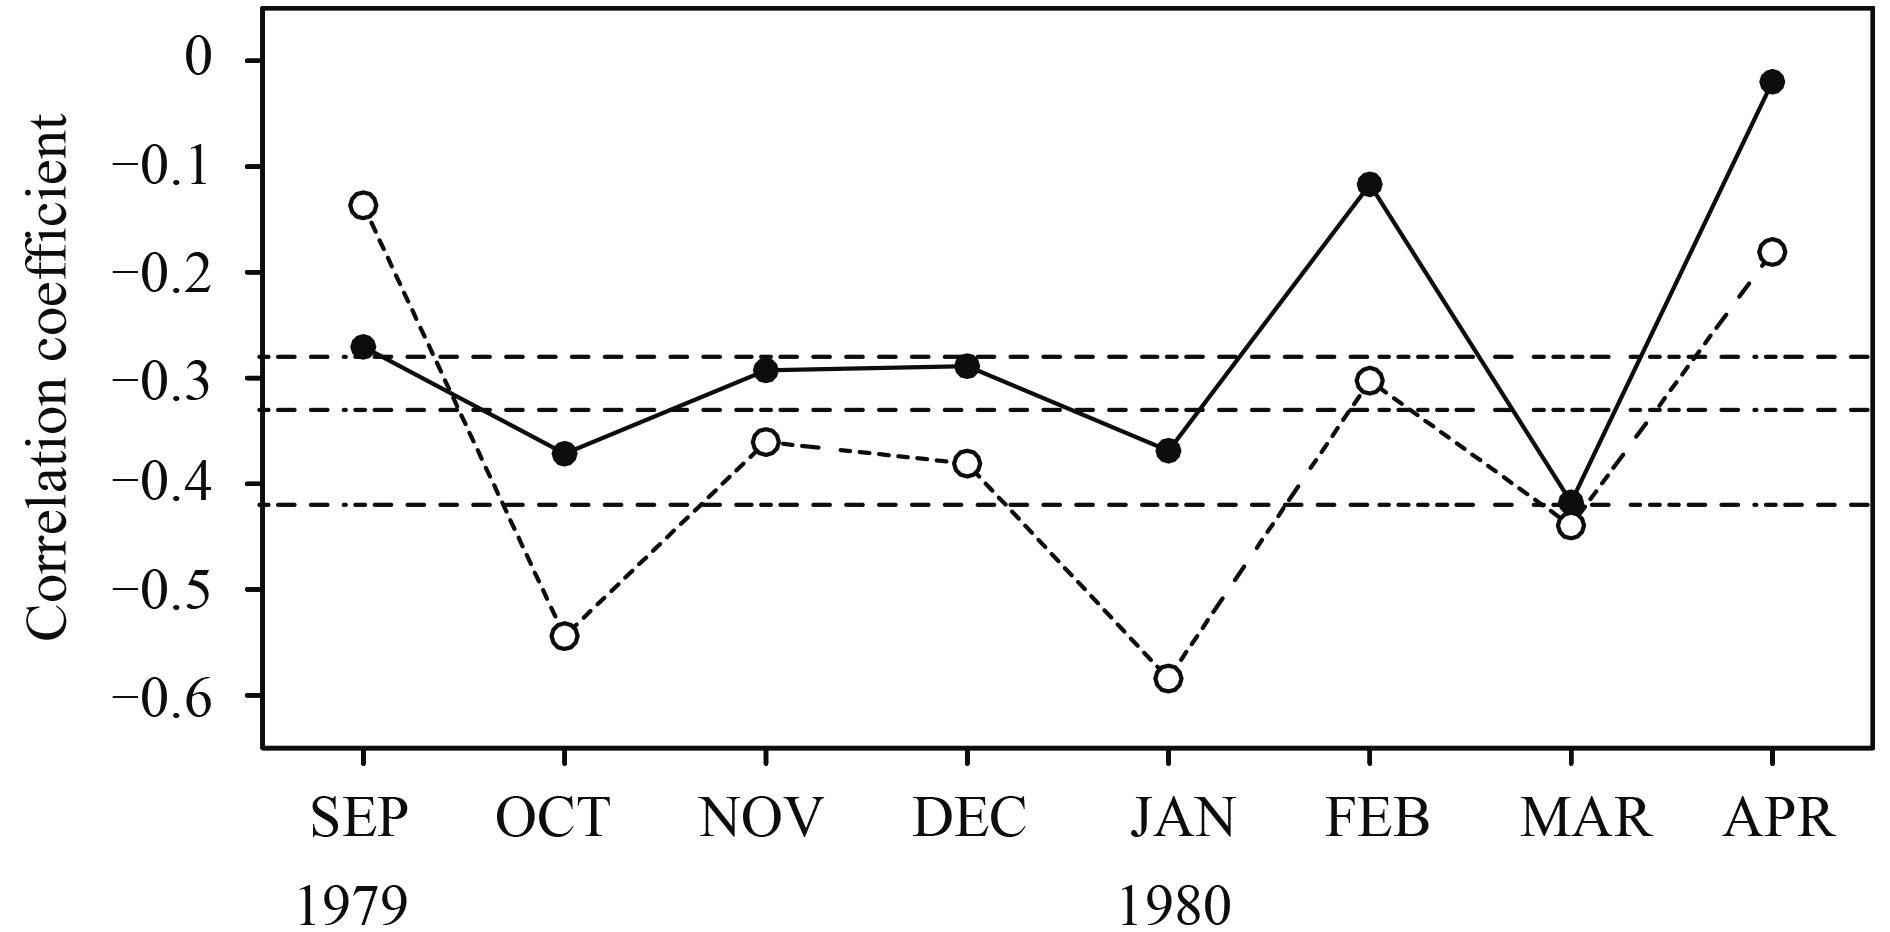
Figure 4 displays the correlation coefficients between the PFJ and EASJ wind intensity on the subseasonal timescale. We also calculate the correlations of meridional wind intensity of the two jets due to the strong meridional component of the PFJ. The results show overall significant negative correlation between the two jets during the cold season, especially in January and October. Meanwhile, in February, the out-of-phase variation is remarkable, implying in-phase variation besides negative correlation.
|
| Fig. 4 Correlation coefficients between the PFJ and EASJ on the subseasonal timescale. The solid and dashed lines indicate the correlation coefficients for the total wind speeds and meridional wind speeds in the PJF and EASJ key regions, respectively. |
To detect the concurrent variation relationships of the two jets from the perspective of the synoptic scale, we calculate the daily intensity of the EASJ and PFJ using regional daily averaged wind anomalies at 300 hPa in the selected key areas, respectively. In order to obtain the lead–lag correlation between the EASJ and PFJ every year, we lengthen the wintertime to 120 days from 16 November to 15 March (and 14 March in leap years). Based on the time series of daily EASJ intensity in winter (from 1 December to 28 February), the lagged correlation between daily PFJ and EASJ intensity from 1979 to 2014 is illustrated in Fig. 5. The daily intensities of the EASJ and PFJ are significantly correlated, with a value below –0.4, when the PFJ leads the EASJ from 15 to 0 days. This simultaneous and preceding out-of-phase variation between PFJ and EASJ intensity prevails from the 1990s to the early 2010s, with interdecadal and interannual variability, and with sparse leading in-phase variations around 1986 and the late 1990s. When we focus on 3–15-day lagged correlation, the significant values are fewer and mainly exhibit notably interannual change. The leading out-of-phase variation between PFJ and EASJ intensity may be related to Rossby wave propagation, and the possible mechanisms need further study in future work.

|
| Fig. 5 Lagged correlation between the daily intensity of the PFJ (polar-front jet) and the EASJ (East Asian subtropical jet) in winter from 1979 to 2014. The negative (positive) values on the ordinate indicate that the PFJ precedes (lags) the EASJ. The shaded areas denote correlation coefficients exceeding the 95% confidence level, based on the Student's t-test. |
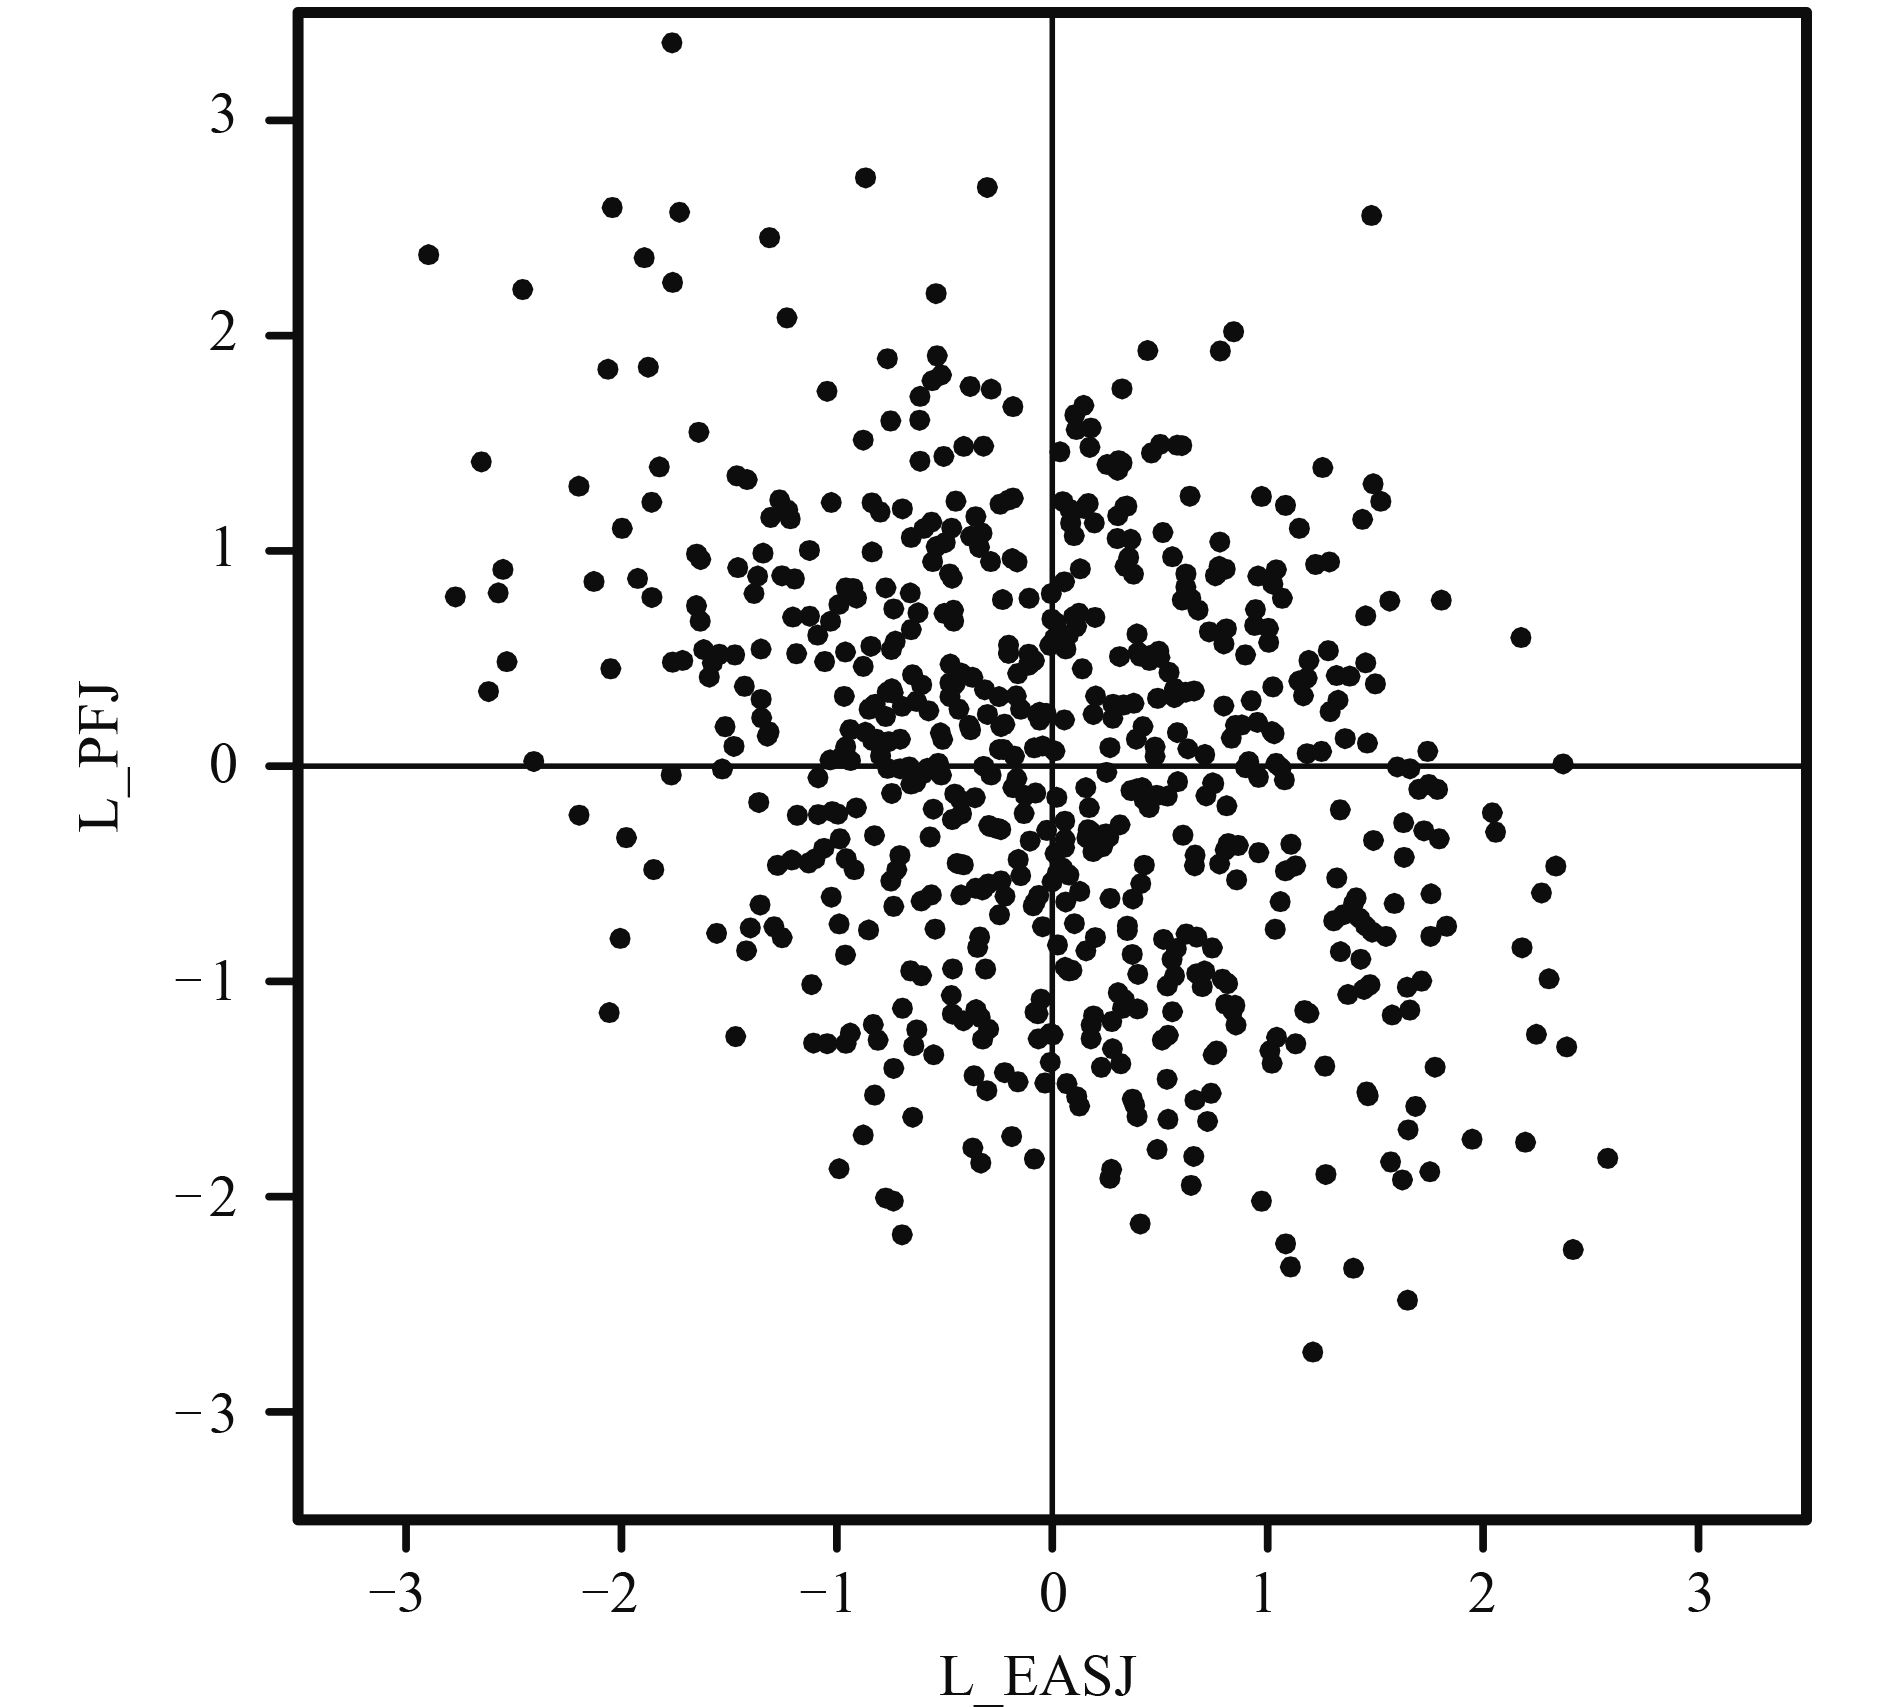
To investigate the concurrent effects of the EASJ and PFJ, different configurations of the two jets are identified in this study. Similarly, we define pentad intensity indices for the EASJ (I_EASJ) and PFJ (I_PFJ) using pentad mean wind anomalies at 300 hPa. In addition, the normalized values are used.Figure 6 presents the pentad EASJ intensities versus PFJ intensities, and the correlation coefficient between them is –0.30, at the 5% significance level. This reveals that an intensified (weakened) PFJ is simultaneously correlated with a weakened (intensified) EASJ, which shows remarkable concurrent relationships of the two jets, i.e., out-of-phase and in-phase variations.
|
| Fig. 6 Pentad intensity index for the PFJ (polar-front jet; I_PFJ) versus that for the EASJ (East Asian subtropical jet; I_EASJ) in winter during 1979–2014. |
Based on various intensity changes of the EASJ and PFJ, four configurations are identified as follows: (1) Strong EASJ–strong PFJ configuration (I_EASJ ≥ 0.5 and I_PFJ ≥ 0.5; denoted by SS); (2) strong EASJ–weak PFJ configuration (I_EASJ ≥ 0.5 and I_PFJ ≤ –0.5; denoted by SW); (3) weak EASJ–strong PFJ configuration (I_EASJ ≤ –0.5 and I_PFJ ≥ 0.5; denoted by WS); and (4) weak EASJ–weak PFJ configuration (I_EASJ ≤ –0.5 and I_PFJ ≤ –0.5; denoted by WW) (Li and Zhang, 2014;Huang et al., 2015). There are 44, 85, 86, and 39 pentads corresponding to the abovementioned four situations, respectively, during wintertimes of 1979–2014. Clearly, the out-of-phase variation is found to be more common than the in-phase variation.
The characteristics of the composite winter temperature anomalies in China with different configurations of the EASJ and PFJ are shown in Fig. 7. For the SS situation (Fig. 7a), obvious negative temperature anomalies appear over Tibet, Qinghai Province, and most areas of southern China, whereas notable positive temperature anomalies are located in northern China. For the SW pattern (Fig. 7b), a significant cold situation occurs in most regions of China, except sparse positive values over southwest areas. The pattern of temperature anomalies for the WS situation (Fig. 7c) is nearly opposite to that for the SW situation, indicating positive temperature anomalies over China, except in southwest areas. For the WW situation (Fig. 7d), there are anomalous warm conditions in the northeast, as well as western and southern China, while cold conditions mainly exist over Inner Mongolia and Shandong Peninsula.

|
| Fig. 7 Composite winter temperature anomalies (℃) over China in the (a) strong EASJ–strong PFJ configuration, (b) strong EASJ–weak PFJ configuration, (c) weak EASJ–strong PFJ configuration, and (d) weak EASJ–weak PFJ configuration. |
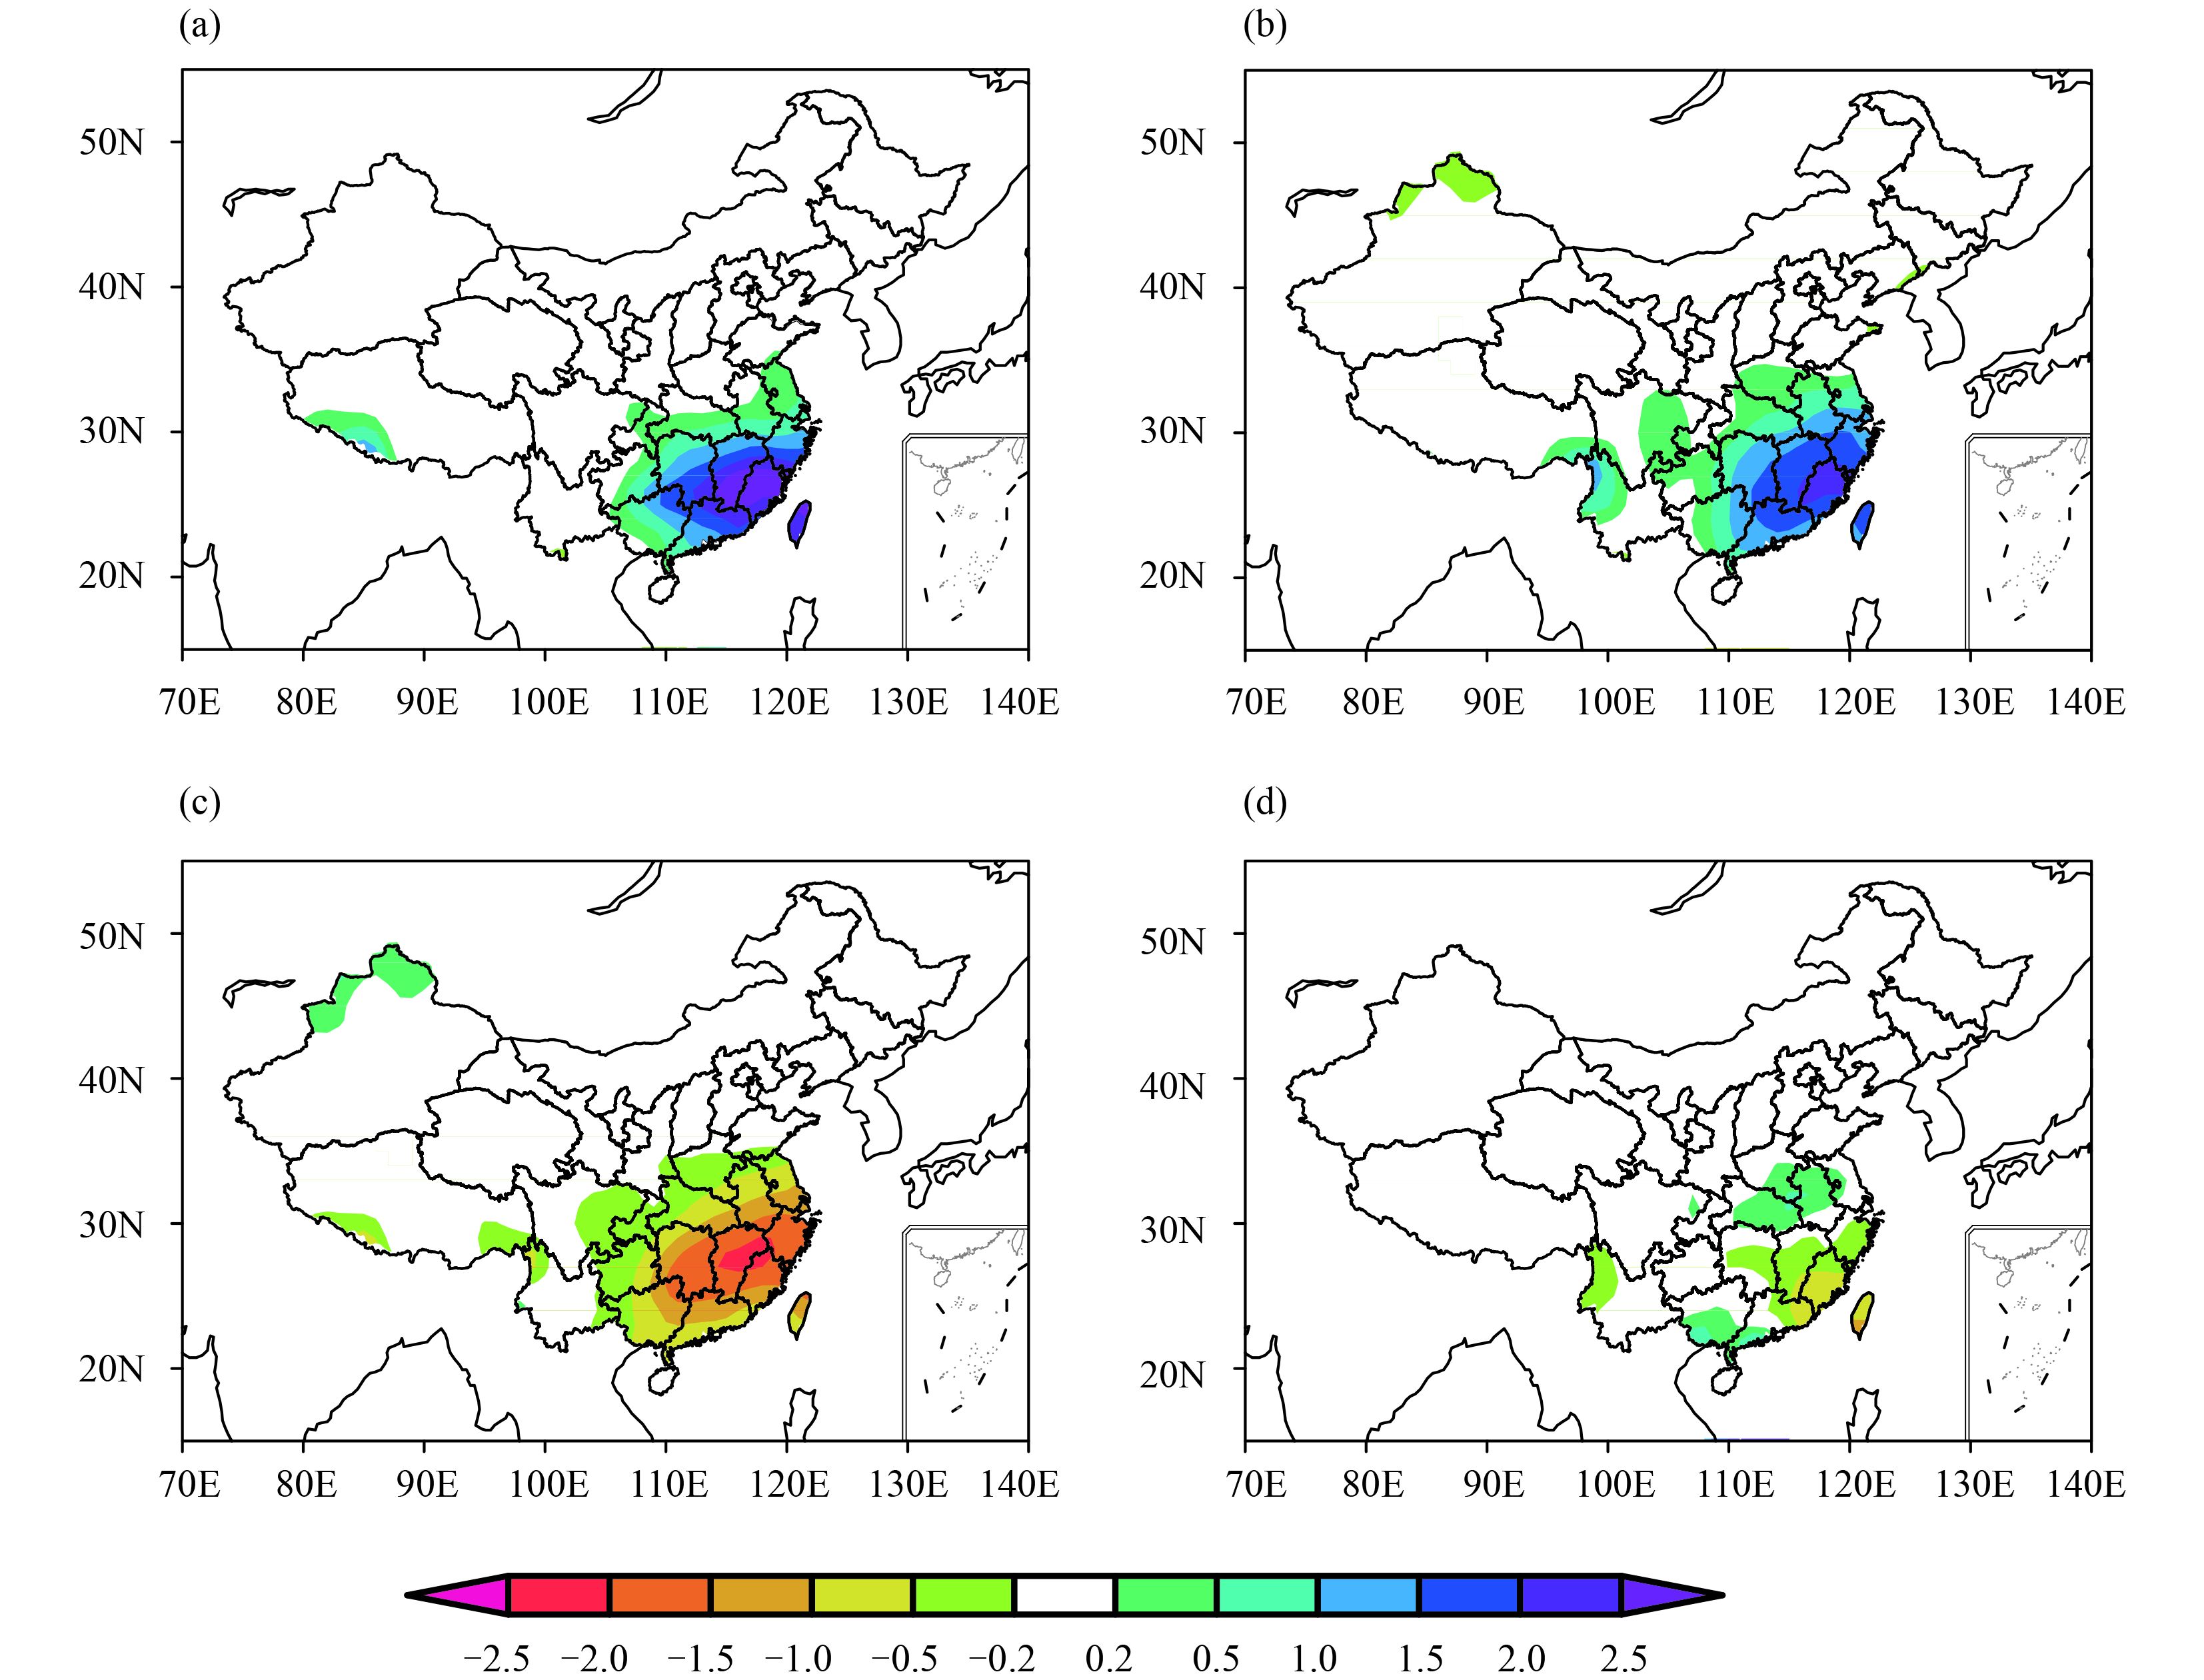
The rainfall mainly concentrates in southern China, since little precipitation occurs in the northern areas in winter.Figure 8 displays the spatial distributions of precipitation anomalies over China under different configurations of the EASJ and PFJ.Figure 8a shows clearly that positive precipitation anomalies appear in southern China, with the maximum rainfall belt located around 25°N when the EASJ and PFJ are both strong. The spatial pattern is similar to Fig. 8a when the EASJ is strong and the PFJ is weak (Fig. 8b), with a slightly eastward maximum center. The opposite of Fig. 8b is true under the weak EASJ–strong PFJ configuration in Fig. 8c. However, the composite distribution for the weak EASJ and PFJ is quite different from the others, and exhibits small negative anomalies in southern China compared to Fig. 8c. There are also tiny positive anomalies near the Yangtze River valley and southern coast. The complicated rainfall anomaly patterns in southern China can be explained by the concurrent variation configurations between the two jets.
|
| Fig. 8 As in Fig. 7, but for precipitation anomalies (mm day–1) over China . |
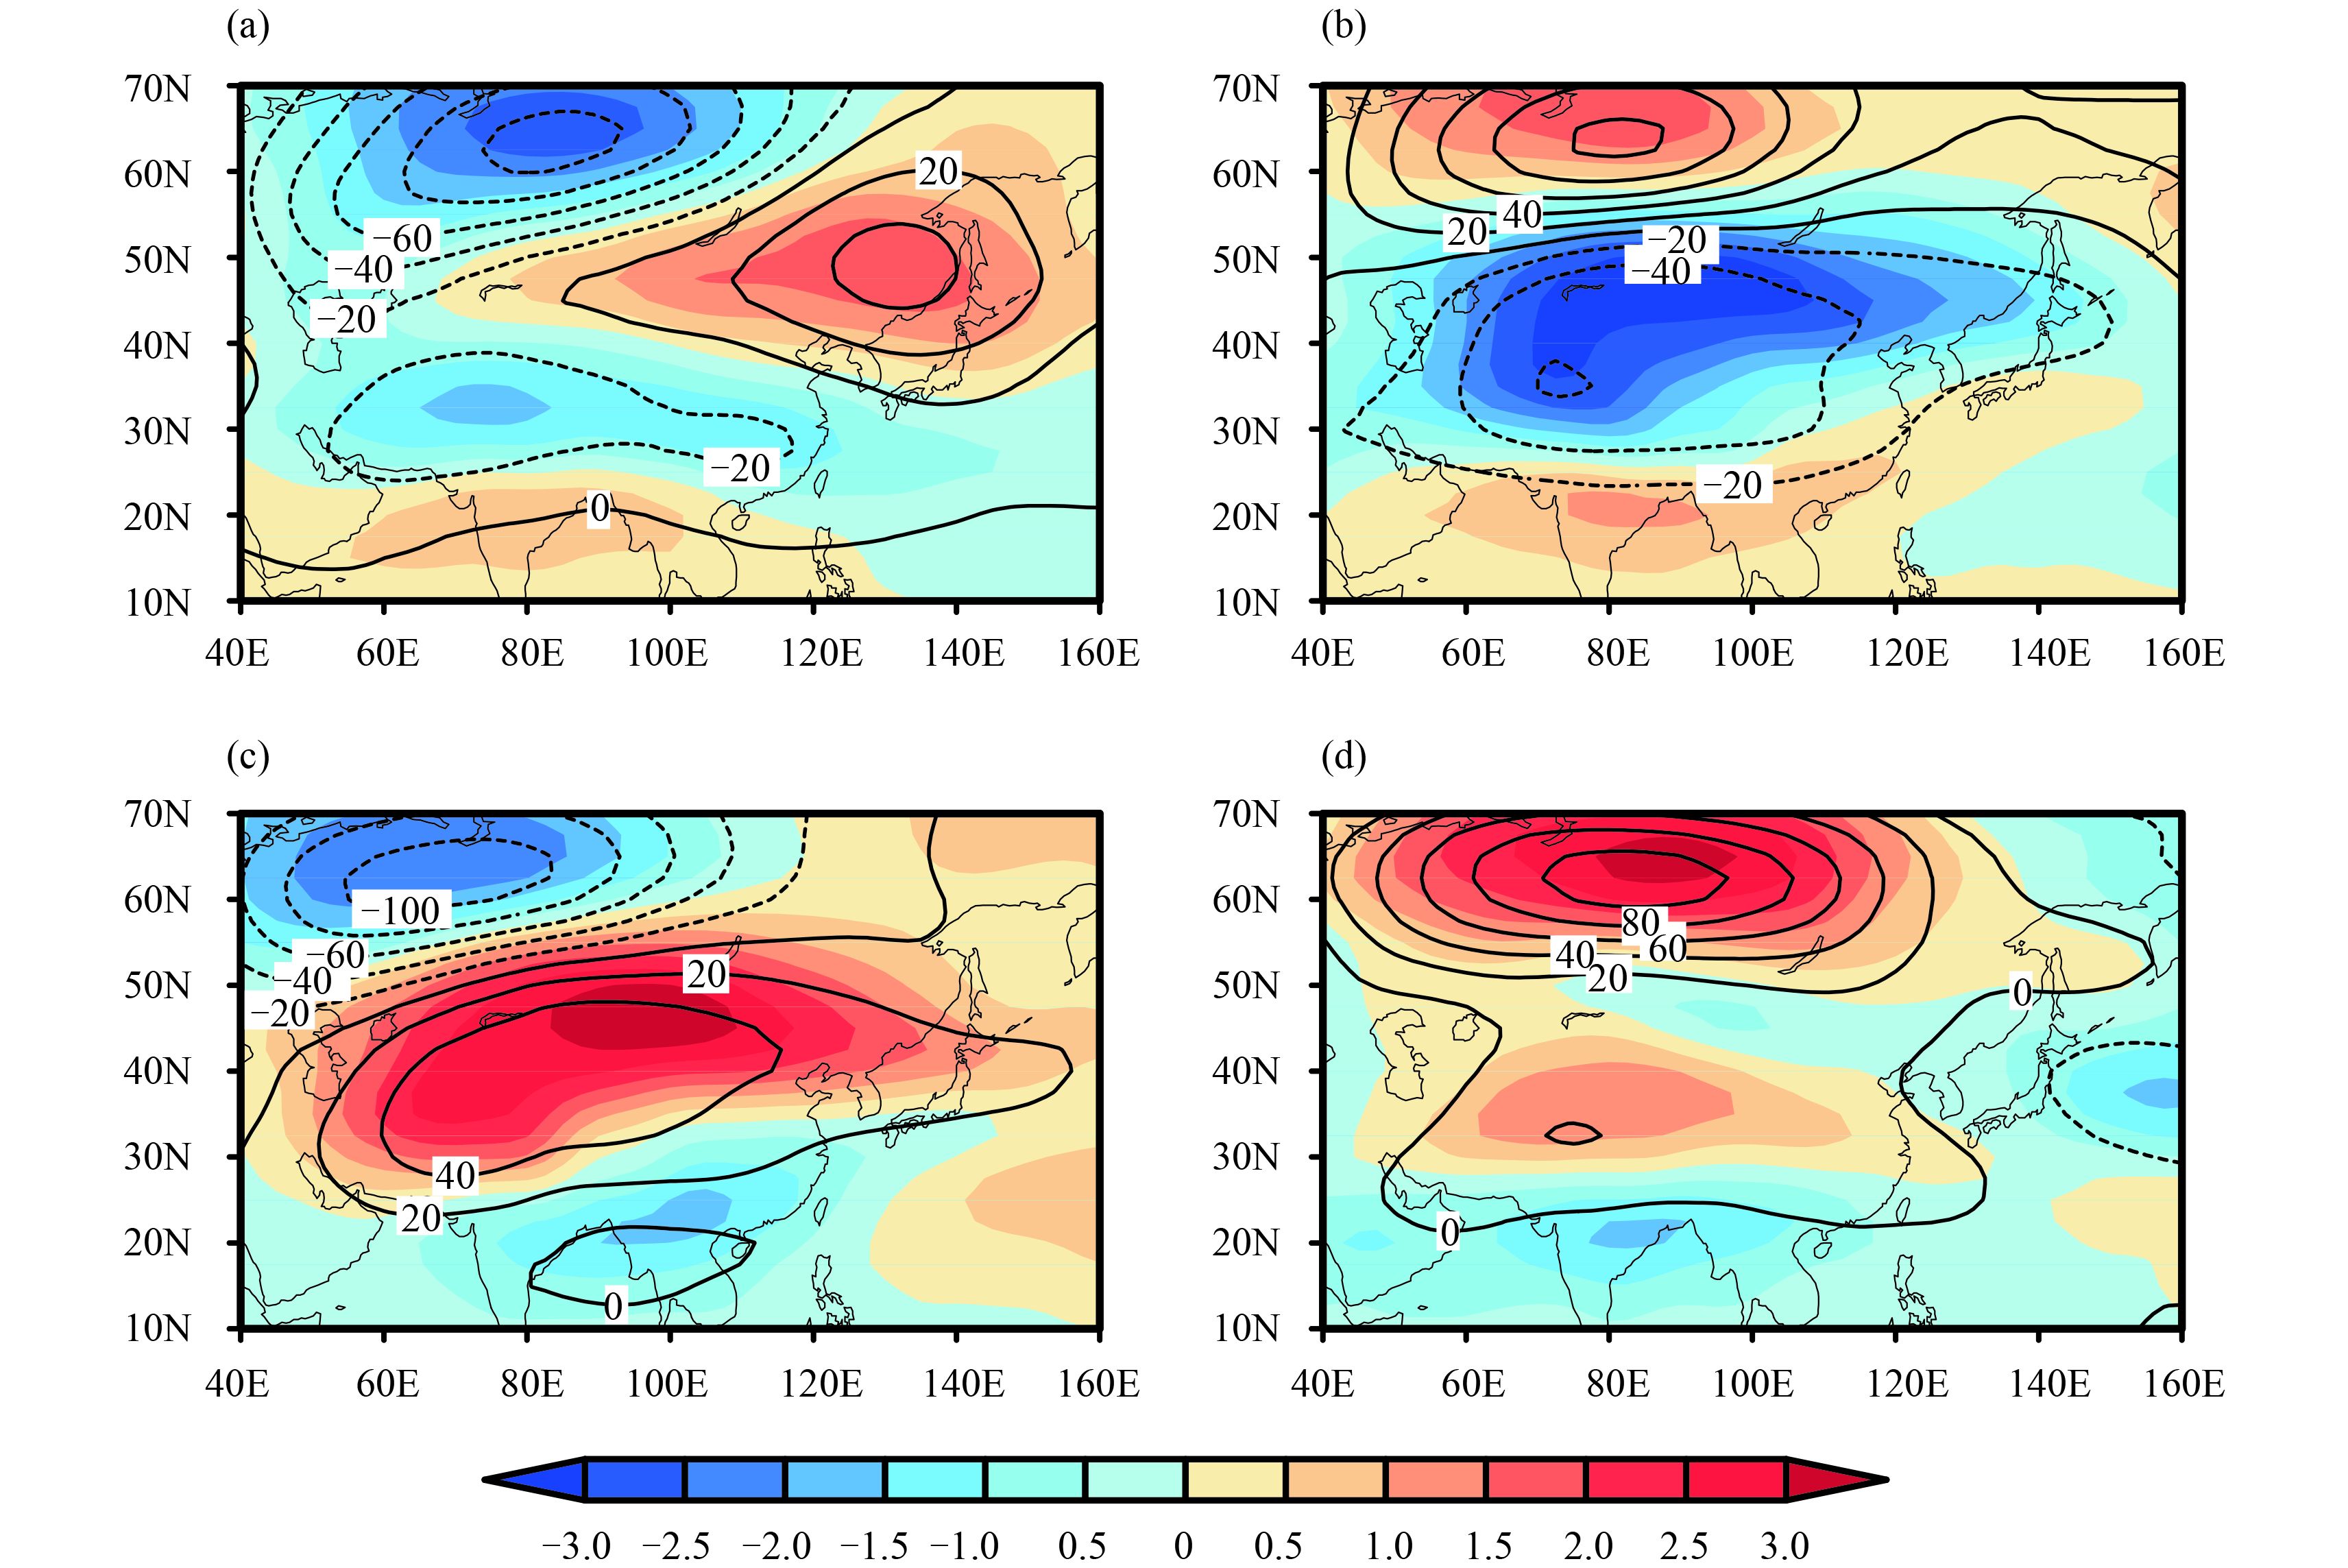
The spatial distributions of geopotential height anomalies at 500 hPa with different configurations of the EASJ and PFJ show large differences (Fig. 9). For the SS configuration of the two jets, synoptic circulation in the mid–high latitudes shows a northwest–southeast tilted dipole: a negative anomaly appears over Siberia, and a positive anomaly to the east of Lake Baikal. There is also a relatively weak negative anomaly located over the Iran and Tibetan Plateau. The composite geopotential height anomalies under the two out-of-phase configurations in Figs. 9b and 9c exhibit completely contrary features, with opposite geopotential height anomalies centered around 65° and 45°N, respectively. As for the SW pattern, a substantial anomalous positive geopotential height occupies the polar region, while a notable negative anomaly dominates the midlatitude regions between 30° and 50°N. The positive anomaly over low latitudes is relatively weak. For the WS situation, opposite geopotential height anomalies occupy the land mass of East Asia, compared to Fig. 9b. For the WW situation, the mid–high latitude region of Asia is controlled mostly by positive anomalies, as the negative anomaly between is weak and located eastward to the ocean. The corresponding air temperature anomalies at 500 hPa under different configurations of the EASJ and PFJ are also presented in Fig. 9. Certainly, the distribution of composite air temperature anomalies is consistent with the distribution of geopotential height anomalies: a positive geopotential height anomaly leads to a positive air temperature anomaly, and vice versa. The geopotential height and air temperature anomalies represent the background circulation for precipitation and surface temperature in China.
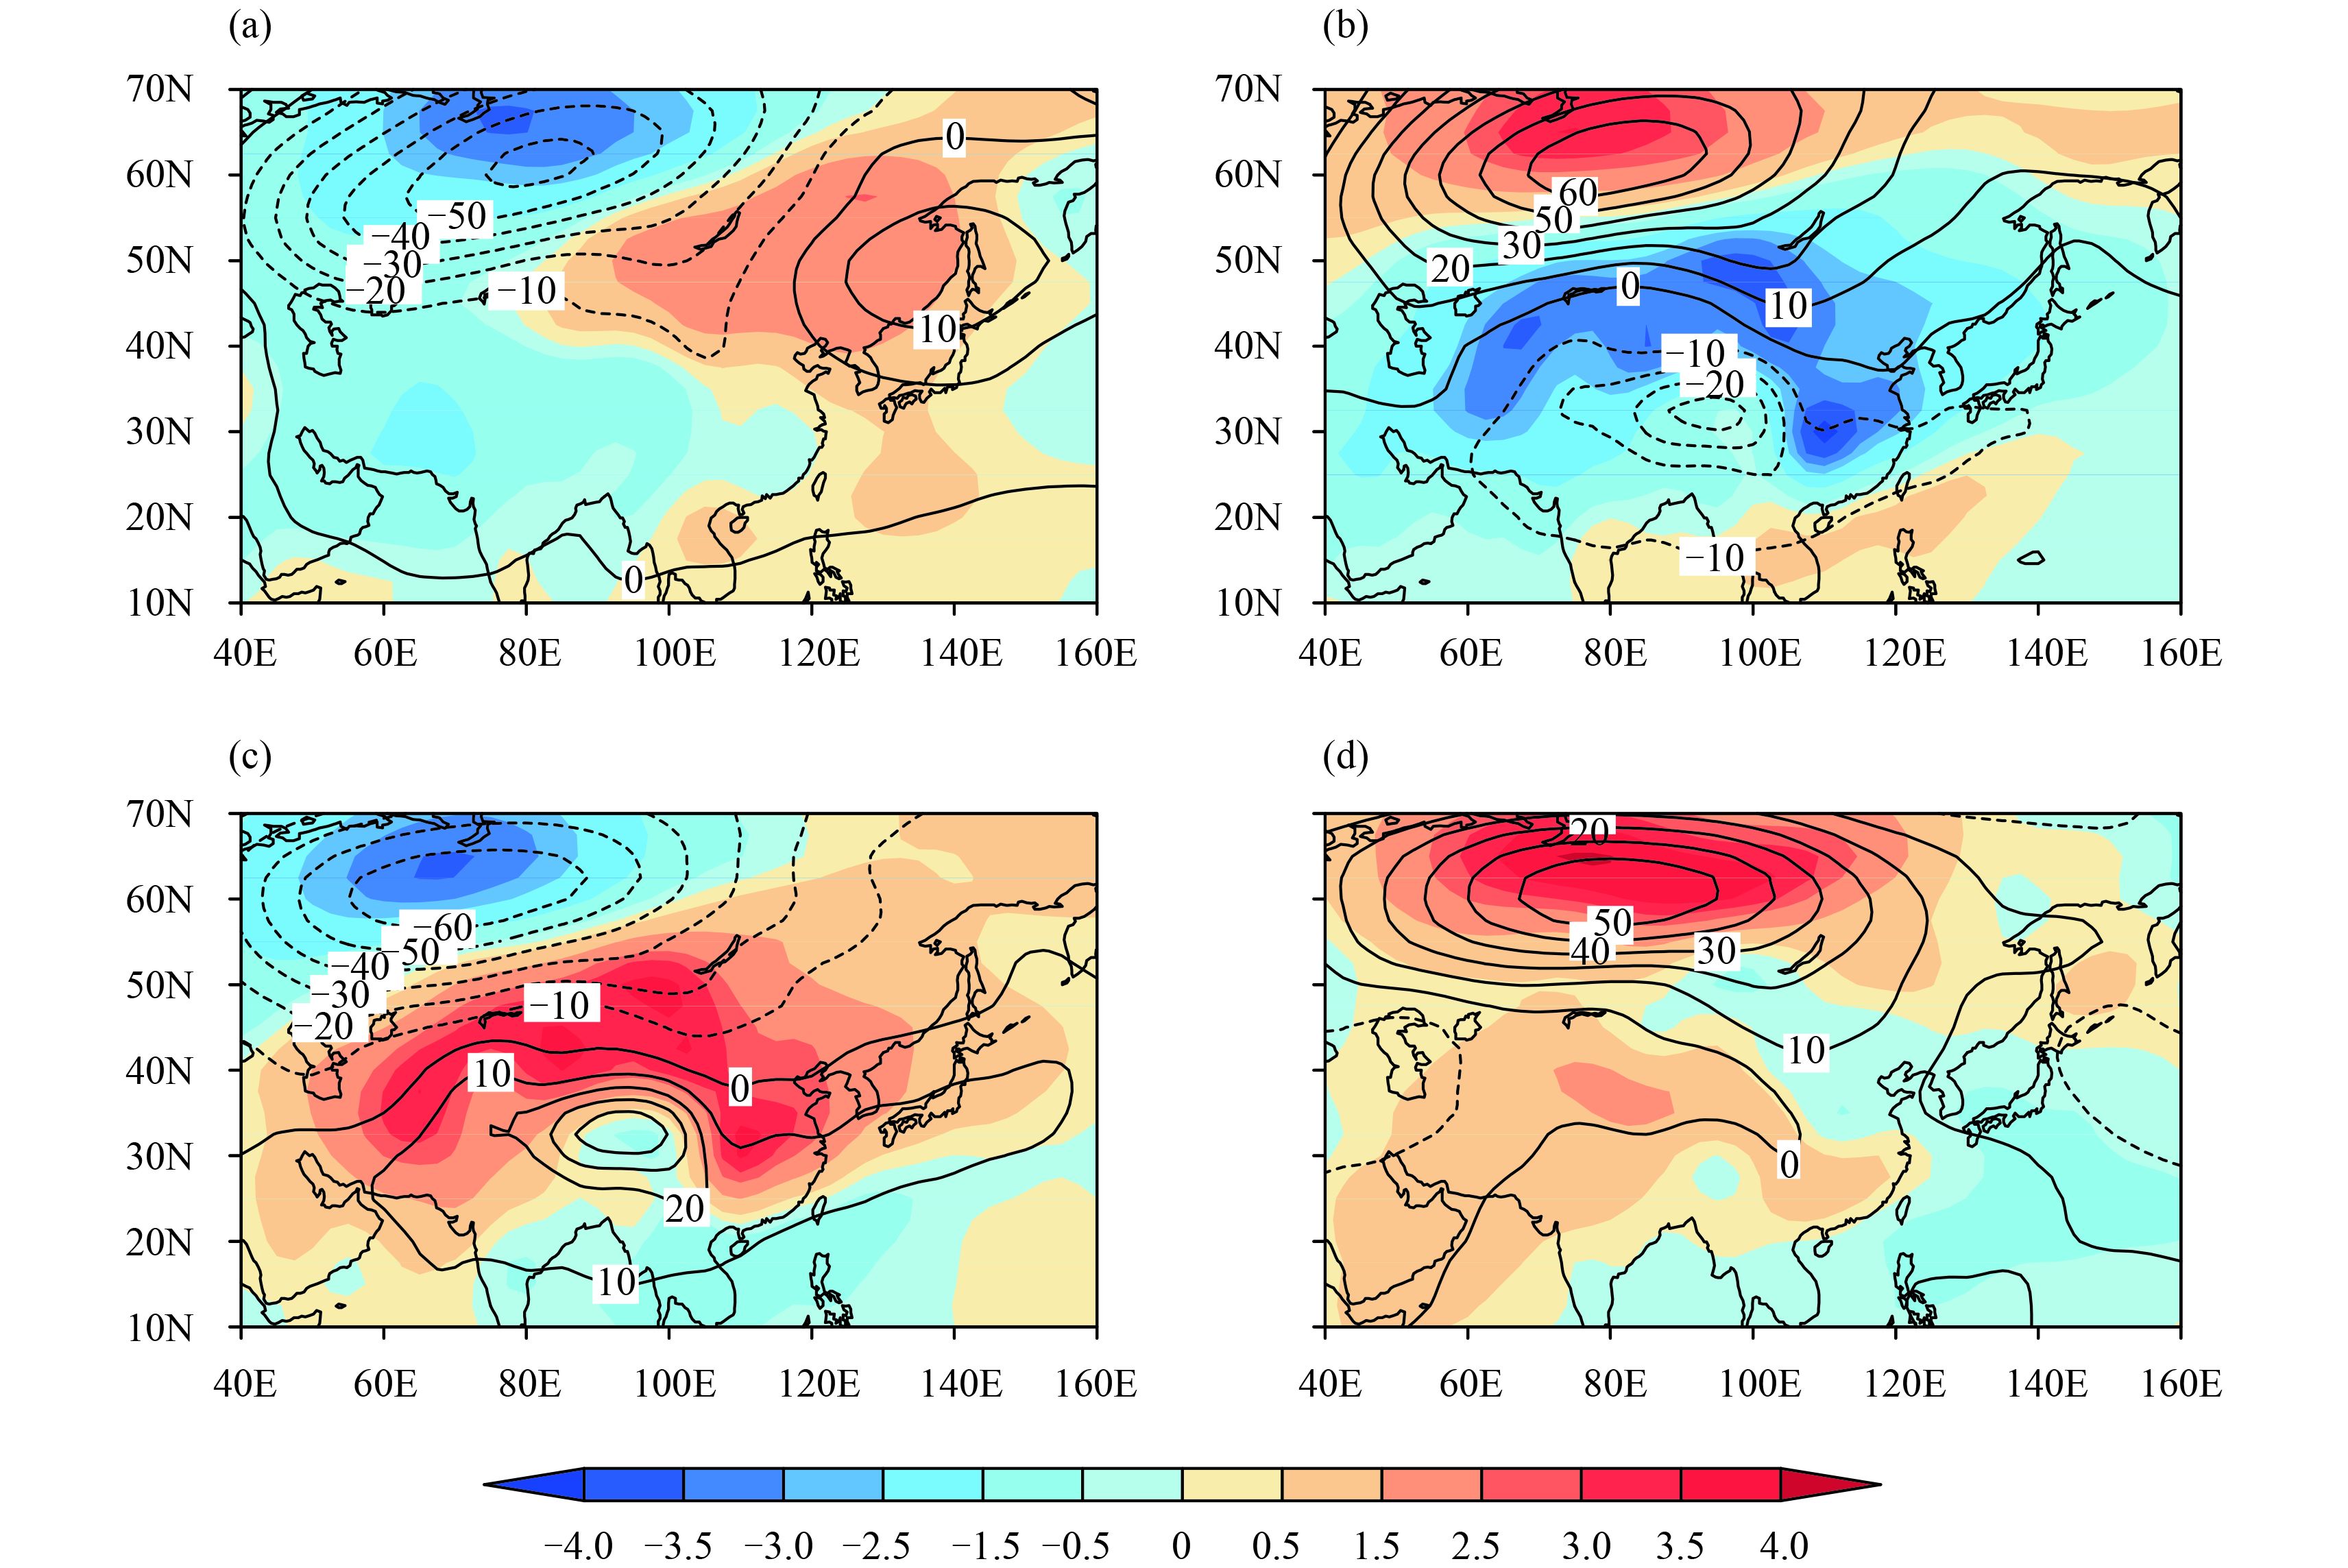
Figure 10 is the same as Fig. 9, but the composite distributions with different configurations are calculated at the lower level of 850 hPa. It generally shows the same characteristics as at 500 hPa, apart from the temperature anomaly centers are located off to the northwest of the geopotential height anomaly centers.
|
| Fig. 9 Composite geopotential height anomalies (contours; m) and air temperature anomalies (shaded; ℃) at 500 hPa in the (a) strong EASJ–strong PFJ configuration, (b) strong EASJ–weak PFJ configuration, (c) weak EASJ–strong PFJ configuration, and (d) weak EASJ–weak PFJ configuration. |
|
| Fig. 10 As in Fig. 9, but for 850 hPa. |
As documented in a number of previous studies, the East Asian jet streams are associated with significant transient eddy activities (Xiao and Zhang, 2012,2015;Liao and Zhang, 2013;Luo and Zhang, 2015;Xue and Zhang, 2017). To investigate the features of the synoptic-scale transient eddy activity (STEA) under different configurations of the EASJ and PFJ, the eddy kinetic energy (Ke) is calculated to measure the STEA using the synoptic-scale filtered data (Liao and Zhang, 2013). The formulation is
| ${K_{\rm e}} = \frac{1}{2}\left( {u{'^2} + v{'^2}} \right),$ |
where u and v denote the zonal and meridional wind velocities, respectively, and the primes denote 2.5–8-day band-pass filtering.
Figure 11 depicts the horizontal distributions of the STEA at 300 hPa in winter under different configurations of the EASJ and PFJ. For the SS condition, when both the jets are strong, there are two significant positive STEA anomaly centers located over the East European Plain and eastward to the Sea of Okhotsk and Japan, with a narrow band between them. The regions to the north and south of the narrow band are controlled by negative STEA anomalies. The positive anomalies along 30°N are restricted to the west of 80°E. For the SW situation, a vigorous negative STEA anomaly branch dominates East Asian mid and high latitudes and the western Pacific, expanding southeastward from the polar-front zone to the subtropical jet center over the ocean. Yet, there is a weak positive anomaly branch along 30°N west of 100°E, corresponding to a strong EASJ. When the EASJ is weak and PFJ is strong, the negative anomalies in Fig. 11b change to positive, and vice versa. For the WW situation, there are two negative anomalies over the East European Plain–western Siberia and North Pacific, with positive anomalies between. Apparently, a close relationship may exist between the STEA and the intensity of the jet streams, especially for the PFJ. The above results imply that significantly weakened (strengthened) STEA over polar front areas is intimately associated with a decreased (increased) intensity of the PFJ. The transient eddy activities are relatively weak in subtropical areas over the East Asian land mass.

|
| Fig. 11 Composite synoptic-scale transient eddy activity anomalies ( m–2 s–2) at 300 hPa in the (a) strong EASJ–strong PFJ configuration, (b) strong EASJ–weak PFJ configuration, (c) weak EASJ–strong PFJ configuration, and (d) weak EASJ–weak PFJ configuration. |
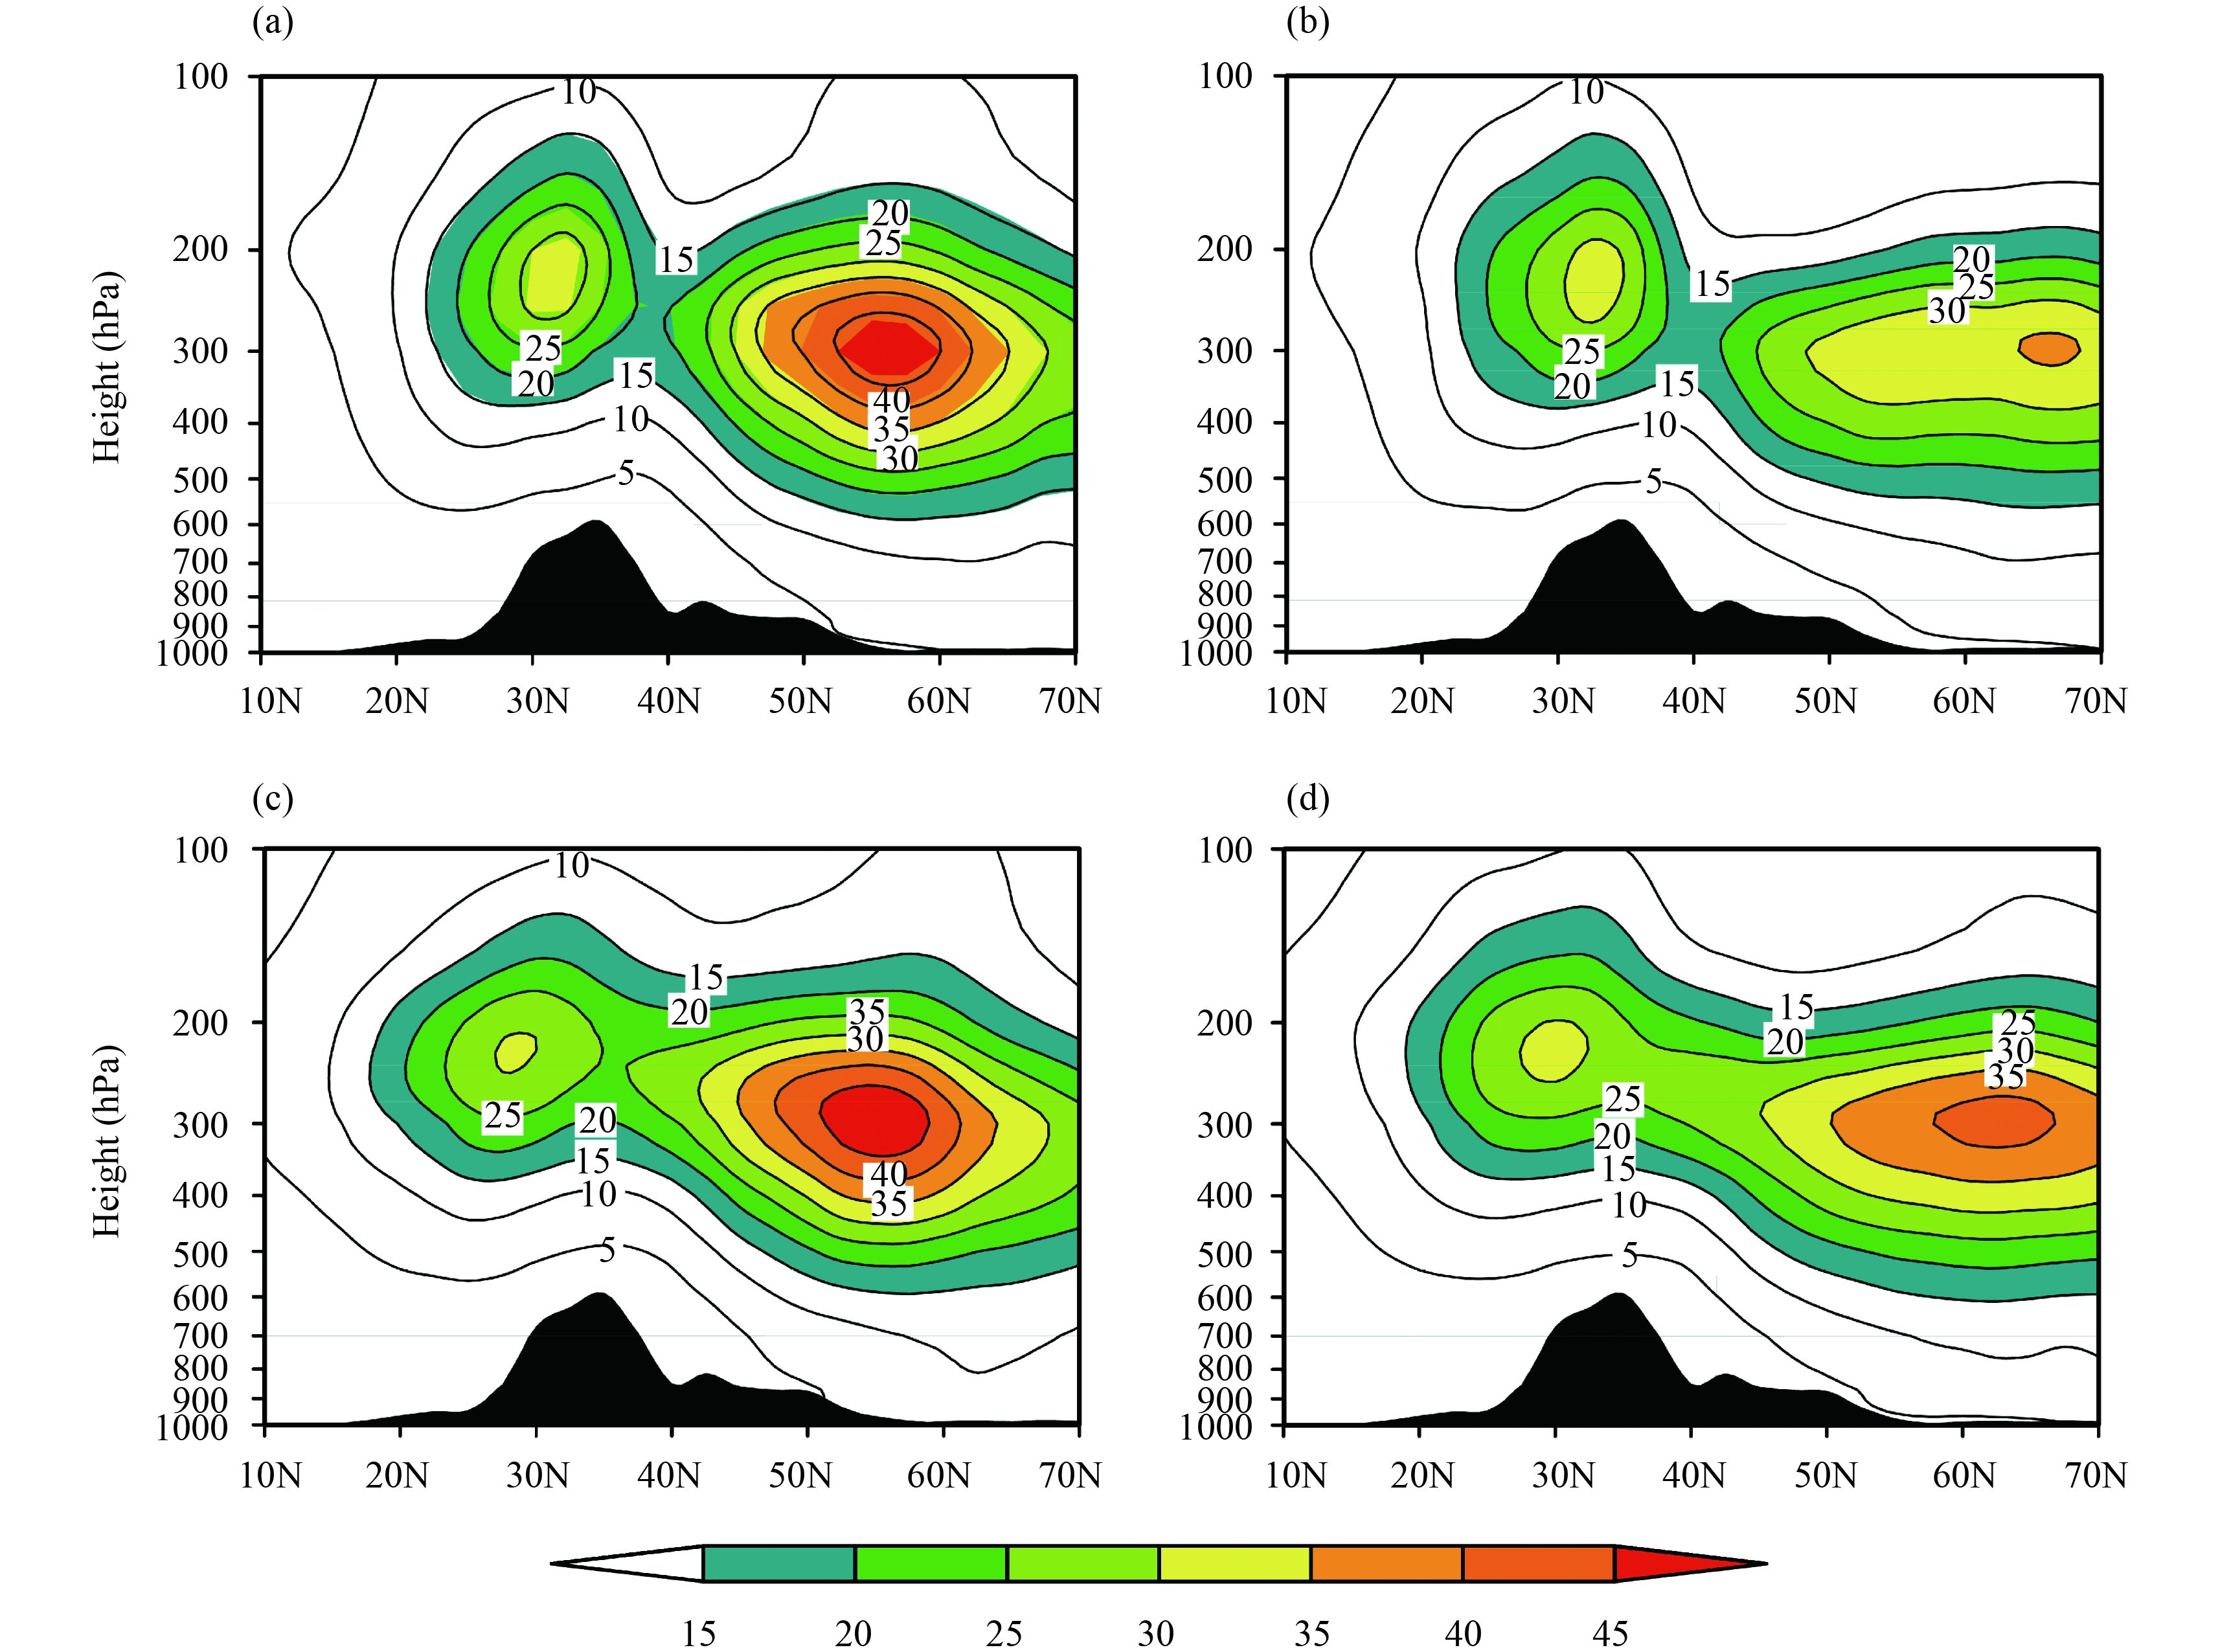
Figure 12 displays the latitude–height cross-section of the STEA averaged from 70° to 100°E with different configurations. Two separated branches of STEA with an explicit border around 38°N are found in the upper troposphere and lower stratosphere. The locations of the two STEA centers correspond to the EASJ and PFJ around 30° and 55°N, respectively, further indicating the intimate relationship between STEA and the two jets. Clearly, the STEA associated with the EASJ is weaker than that of the PFJ, except under the strong EASJ–weak PFJ configuration (Fig. 12b).
|
| Fig. 12 As in Fig. 11, but for the latitude–height cross-section of the synoptic-scale transient eddy activity (m–2 s–2) averaged from 70° to 100°E. |
This study examines the concurrent variation relationships between the EASJ and PFJ over the East Asian land mass in the winter season on different timescales, and the impacts of the jet concurrent variation patterns on the atmospheric circulation in mid–high latitude regions and climate anomalies in China, using NCEP–NCAR reanalysis data and observational data. An EOF analysis is applied to the winter zonal wind averaged from 70° to 100°E in the latitude–height cross-section. The first leading mode depicts the meridional displacement of the PFJ and EASJ, while the second mode presents the out-of-phase variation in the intensity between the two jets. Two regions over 25°–30°N, 70°–100°E and 50°–60°N, 70°–100°E are defined as the key areas for the EASJ and PFJ, respectively. The intensities of the EASJ and PFJ both show a significant interannual variability, and the correlation coefficient is –0.35. Overall, significant negative correlations are found between the two jets on the subseasonal timescale during the cold season. The daily intensities of the EASJ and PFJ are significantly correlated, with a value below –0.4 when the PFJ leads the EASJ from 15 to 0 days, prevailing from the 1990s to the early 2010s.
Four different concurrent variation configurations between the EASJ and PFJ are defined in this study, i.e., the SS, SW, WS, and WW (see Section 4.3). The out-of-phase configurations are found to be more common than the in-phase variation. These concurrent variation relationships represent the integral structure and variation features of the atmospheric general circulation over East Asia, and have significant impacts on the weather and climate. For the SS configuration, synoptic circulation in the mid–high latitudes shows a northwest–southeast tilted dipole pattern in the geopotential height field at 500 hPa: a negative anomaly appears over Siberia, and a positive anomaly exists to the east of Lake Baikal, resulting in a northern warm–southern cold situation, and positive rainfall anomalies in southern China. For the SW (WS) configuration, a substantial anomalous positive (negative) geopotential height occupies the polar region, while a notable negative (positive) anomaly dominates the midlatitude regions in the upper troposphere, resulting in a cold (warm) situation in most regions of China and positive (negative) rainfall anomalies in southern China. For the WW situation, positive geopotential height anomalies dominate East Asian regions and warm conditions exist over most areas in China, corresponding to less negative rainfall anomalies in southern China. The complicated rainfall anomaly patterns in southern China can be explained by the concurrent variation configurations between the two jets. The features of the STEA under different configurations of the EASJ and PFJ indicate a close relationship between the STEA and the intensity of the jet streams, especially the PFJ. Significantly weakened (strengthened) STEA over the polar front area is intimately associated with a decreased (increased) intensity of the PFJ. The transient eddy activities are relatively weak in subtropical areas over the East Asian land mass.
In this study we only identify the concurrent variation relationships between the EASJ and PFJ over the East Asian region in the winter season on different timescales, and examine the impacts of the jet concurrent variation patterns on the atmospheric circulation in mid–high latitude regions and climate anomalies in China. The mechanisms associated with the concurrent variation relationships between the two jets need to be studied in future work. In addition, the concurrent pattern of the subtropical jet and PFJ differs in different years. This interannual variability of the concurrent variation between the two jets is related to the interannual change of climate anomalies in China, which also requires further study.
Acknowledgments . We would like to thank the two anonymous reviewers for their insightful and detailed comments and suggestions. We also extend our gratitude to the editors for their efforts in improving this paper.
| L. Bengtsson, K. I. Hodges, E. Roeckner ,2006: Storm tracks and climate change. J. Climate , 19 , 3518–3543. |
| E. K. M. Chang, S. Lee, K. L. Swanson ,2002: Storm track dynamics. J. Climate , 15 , 2163–2183. |
| G. P. Cressman ,1981: Circulations of the West Pacific jet stream. Mon. Wea. Rev. , 109 , 2450–2463. |
| ,2005: Advanced Synoptic Meteorology. Beijing: China Meteorological Press . |
| ,1962: Some Problems about East Asian Monsoon. Beijing: Science Press . |
| S. T. Gao, S. Y. Tao ,1991: The lower layer frontogenesis induced by the acceleration of upper jet stream. Chinese J. Atmos. Sci. , 15 , 11–21. |
| B. J. Hoskins, P. J. Valdes ,1990: On the existence of storm-tracks. J. Atmos. Sci. , 47 , 1854–1864. |
| B. J. Hoskins, K. I. Hodges ,2002: New perspectives on the Northern Hemisphere winter storm tracks. J. Atmos. Sci. , 59 , 1041–1061. |
| D. Q. Huang, J. Zhu, Y. C. Zhang, et al ,2014: The different configurations of the East Asian polar front jet and subtropical jet and the associated rainfall anomalies over eastern China in summer. J. Climate , 27 , 8205–8220. DOI:10.1175/JCLI-D-14-00067.1 |
| D. Q. Huang, J. Zhu, Y. C. Zhang, et al ,2015: The impact of the East Asian subtropical jet and polar front jet on the frequency of spring persistent rainfall over southern China in 1997–2011. J. Climate , 28 , 6054–6066. DOI:10.1175/JCLI-D-14-00641.1 |
| E. Kalnay, M. Kanamitsu, R. Kistler, et al ,1996: The NCEP/NCAR 40-year reanalysis project. Bull. Amer. Meteor. Soc. , 77 , 437–471. |
| S. Lee, H. K. Kim ,2003: The dynamical relationship between subtropical and eddy-driven jets. J. Atmos. Sci. , 60 , 1490–1503. |
| L. Li, Y. C. Zhang ,2014: Effects of different configurations of the East Asian subtropical and polar front jets on precipitation during the Mei-Yu season. J. Climate , 27 , 6660–6672. DOI:10.1175/JCLI-D-14-00021.1 |
| Z. J. Liao, Y. C. Zhang ,2013: Concurrent variation between the East Asian subtropical jet and polar front jet during persistent snowstorm period in 2008 winter over southern China. J. Geophys. Res. , 118 , 6360–6373. DOI:10.1002/jgrd.50558 |
| R. Y. Lu, Z. D. Lin, Y. C. Zhang ,2013: Variability of the East Asian upper-tropospheric jet in summer and its impacts on the East Asian monsoon. Chinese J. Atmos. Sci. , 37 , 331–340. |
| X. Luo, Y. C. Zhang ,2015: The linkage between upper-level jet streams over East Asia and East Asian winter monsoon variability. J. Climate , 28 , 9013–9028. DOI:10.1175/JCLI-D-15-0160.1 |
| R. Mao, D. Y. Gong, Q. M. Fang ,2007: Influences of the East Asian jet stream on winter climate in China. J. Appl. Meteor. Sci. , 18 , 137–146. |
| ,1969: Atmospheric Circulation Systems: Their Structure and Physical Interpretation. New York: Academic Press . |
| X. J. Ren, Y. C. Zhang ,2007: Western Pacific jet stream anomalies at 200 hPa in winter associated with oceanic surface heating and transient eddy activity. Acta Meteor. Sinica , 21 , 277–289. |
| X. J. Ren, X. Q. Yang, C. J. Chu ,2010a: Seasonal variations of the synoptic-scale transient eddy activity and polar front jet over East Asia. J. Climate , 23 , 3222–3233. |
| X. J. Ren, X. Q. Yang, T. J. Zhou, et al ,2010b: Diagnostic comparison of the East Asian subtropical jet and polar-front jet: Large-scale characteristics and transient eddy activities. Acta Meteor. Sinica , 68 , 1–11. |
| Riehl, H., 1962:Jet Streams of the Atmosphere. Tech. Rep. 32, Colorado, Department of Atmospheric Science, Colorado State University, 177 pp. |
| ,1986: Pandect of Climate in China. Beijing: Science Press . |
| S. Y. Tao, Y. J. Zhao, X. M. Chen ,1958: The relationship between May-Yü in far east and the behaviour of circulation over Asia. Acta Meteor. Sinica , 29 , 119–134. |
| D. W. J. Thompson, J. M. Wallace ,2000: Annular modes in the extratropical circulation. Part I: Month-to-month variability. J. Climate , 13 , 1000–1016. |
| N. Wang, Y. C. Zhang ,2015: Connections between the Eurasian teleconnection and concurrent variation of upper-level jets over East Asia. Adv. Atmos. Sci. , 32 , 336–348. DOI:10.1007/s00376-014-4088-1 |
| C. L. Xiao, Y. C. Zhang ,2012: The East Asian upper-tropospheric jet streams and associated transient eddy activities simulated by a climate system model BCC_CSM1.1. Acta Meteor. Sinica , 26 , 700–716. DOI:10.1007/s13351-012-0603-4 |
| C. L. Xiao, Y. C. Zhang ,2015: Projected changes of wintertime synoptic-scale transient eddy activities in the East Asian eddy-driven jet from CMIP5 experiments. Geophys. Res. Lett. , 42 , 6008–6013. DOI:10.1002/2015GL064641 |
| Xue, D. K., and Y. C. Zhang, 2016: Concurrent variations in the location and intensity of the Asian winter jet streams and the possible mechanism.Climate Dyn., doi: 10.1007/s00382-016-3325-y. |
| S. Yang, K. M. Lau, K. M. Kim ,2002: Variations of the East Asian jet stream and Asian–Pacific–American winter climate anomalies. J. Climate , 15 , 306–325. |
| D. Z. Ye, S. Y. Tao, M. C. Li ,1958: The abrupt change of circulation over the Northern Hemisphere during June and October. Acta Meteor. Sinica , 29 , 249–263. |
| ,1958: Some Fundamental Problems on the Atmospheric General Circulation. Beijing: Science Press . |
| D. Ye, Y. C. Zhang ,2014: Association of concurrent variation between the East Asian polar front and subtropical jets with winter cold air activity in China. Chinese J. Atmos. Sci. , 38 , 146–158. DOI:10.3878/j.issn.1006-9895.2013.13110 |
| ,1990: Aeroclimatology. Beijing: China Meteorological Press . |
 2017, Vol. 31


