The Chinese Meteorological Society
Article Information
- ZHAO Yesi, SHI Jiangfeng, SHI Shiyuan, YU Jian, LU Huayu . 2017.
- Tree-Ring Latewood Width Based July–August SPEI Reconstruction in South China since 1888 and Its Possible Connection with ENSO. 2017.
- J. Meteor. Res., 31(1): 39-48
- http://dx.doi.org/10.1007/s13351-017-6096-4
Article History
- Received June 13, 2016
- in final form November 7, 2016
2. College of Landscape Architecture, Jiangsu Vocational College of Agriculture and Forestry, Zhenjiang 212400
South China (22.5°–30°N, 100°–120°E) is becoming vulnerable to the increased frequency of summer drought in recent decades (Liu et al., 2015;Ha et al., 2016). For example, the severe summer drought in 2013 impacted 10 provinces, 85.9 million people, and 8.0 million hectare of crops in South China, and resulted in a direct economic loss of 59.0 billion Yuan (Hou et al., 2014). To minimize the damages, it is necessary to accurately forecast summer dry events, which should be based on a full knowledge of their long-term variation and the underlying driving mechanism. El Niño–Southern Oscillation (ENSO) is an important driver of summer hydroclimate over East Asia (Huang and Wu, 1989;Zhang et al., 1999;Zhai et al., 2015). However, the relationship between preceding ENSO and summer hydroclimate has been found to be unstable in instrumental records.Chang et al. (2000) indicated that the relationship changed around 1977/78 in the southeastern coast area of China.Gao et al. (2006) pointed out that the relationship became weak from the early 1980s in eastern China.Zong et al. (2010) concluded that there were three obvious changes in the last 50 years—in the early 1960s, late 1970s, and late 1980s to early 1990s, respectively. The relationship prior to instrumental records, however, has been seldom discussed. A recent study based on a reconstructed precipi-tation series revealed an insignificant relationship from 1920 to 1940 in the lower reaches of the Yangtze River (Xu et al., 2016). How the relationship changes with time, though, is still unclear in South China.
Both historical documents and physical proxies can record past climate variations. Documentary data have been applied in the quantitative reconstruction of hydroclimate variations in South China (Chinese Academy of Meteorological Sciences, 1981;Zheng et al., 2006). However, documents from different sources often make it difficult to keep the reconstruction objective and uniform throughout the whole series, and the reconstructed hydroclimate series from historical documents needs to be verified by other physical proxies, such as tree rings (Zheng et al., 2014). With the characteristics of annual resolution, high continuity, and wide spatial distribution, tree rings have been widely applied in paleoclimate reconstruction in subtropical China in recent years. Most of the tree-ring width chronologies reveal temperature variations (Shi et al., 2010,2013,2015a;Chen et al., 2012;Duan et al., 2012,2013;Zheng et al., 2012;Cai and Liu, 2013,2016). There are only a few cases of tree-ring width based hydroclimatic reconstructions in Southeast China (Shi et al., 2015b;Chen et al., 2016a).
Several studies have indicated strong summer hydroclimate signals in tree-ring latewood width (LWW) chronologies in North America (Stahle et al., 2009;Griffin et al., 2013) and North China (Liu et al., 2004). However, LWW-based hydroclimatic reconstructions have not been reported in South China until now. Latewood is the later part of the annual growth ring, with dark color and heavy density, which forms in the mid–late growing season, during which it may record climatic information (Larson, 1969). Because LWW can be preconditioned by the adjacent earlywood width (EWW),Meko and Baisan (2001) succeeded in enhancing its climate signals in the North American monsoon region by applying an adjusted LWW (LWWadj) to remove the systematic dependence of LWW on EWW.
Old forests of Tsuga longibracteata are distributed at subalpine sites in subtropical China (Chen et al., 2015). The sharp anatomical change from earlywood to latewood (Ho et al., 1984) makes it possible to create ring-width chronologies for both latewood and earlywood, separately. In the present study, for the first time, we produced a summer hydroclimate reconstruction based on the LWWadj of T. longibracteata in South China, and explored its linkage with ENSO, over the past 127 years.
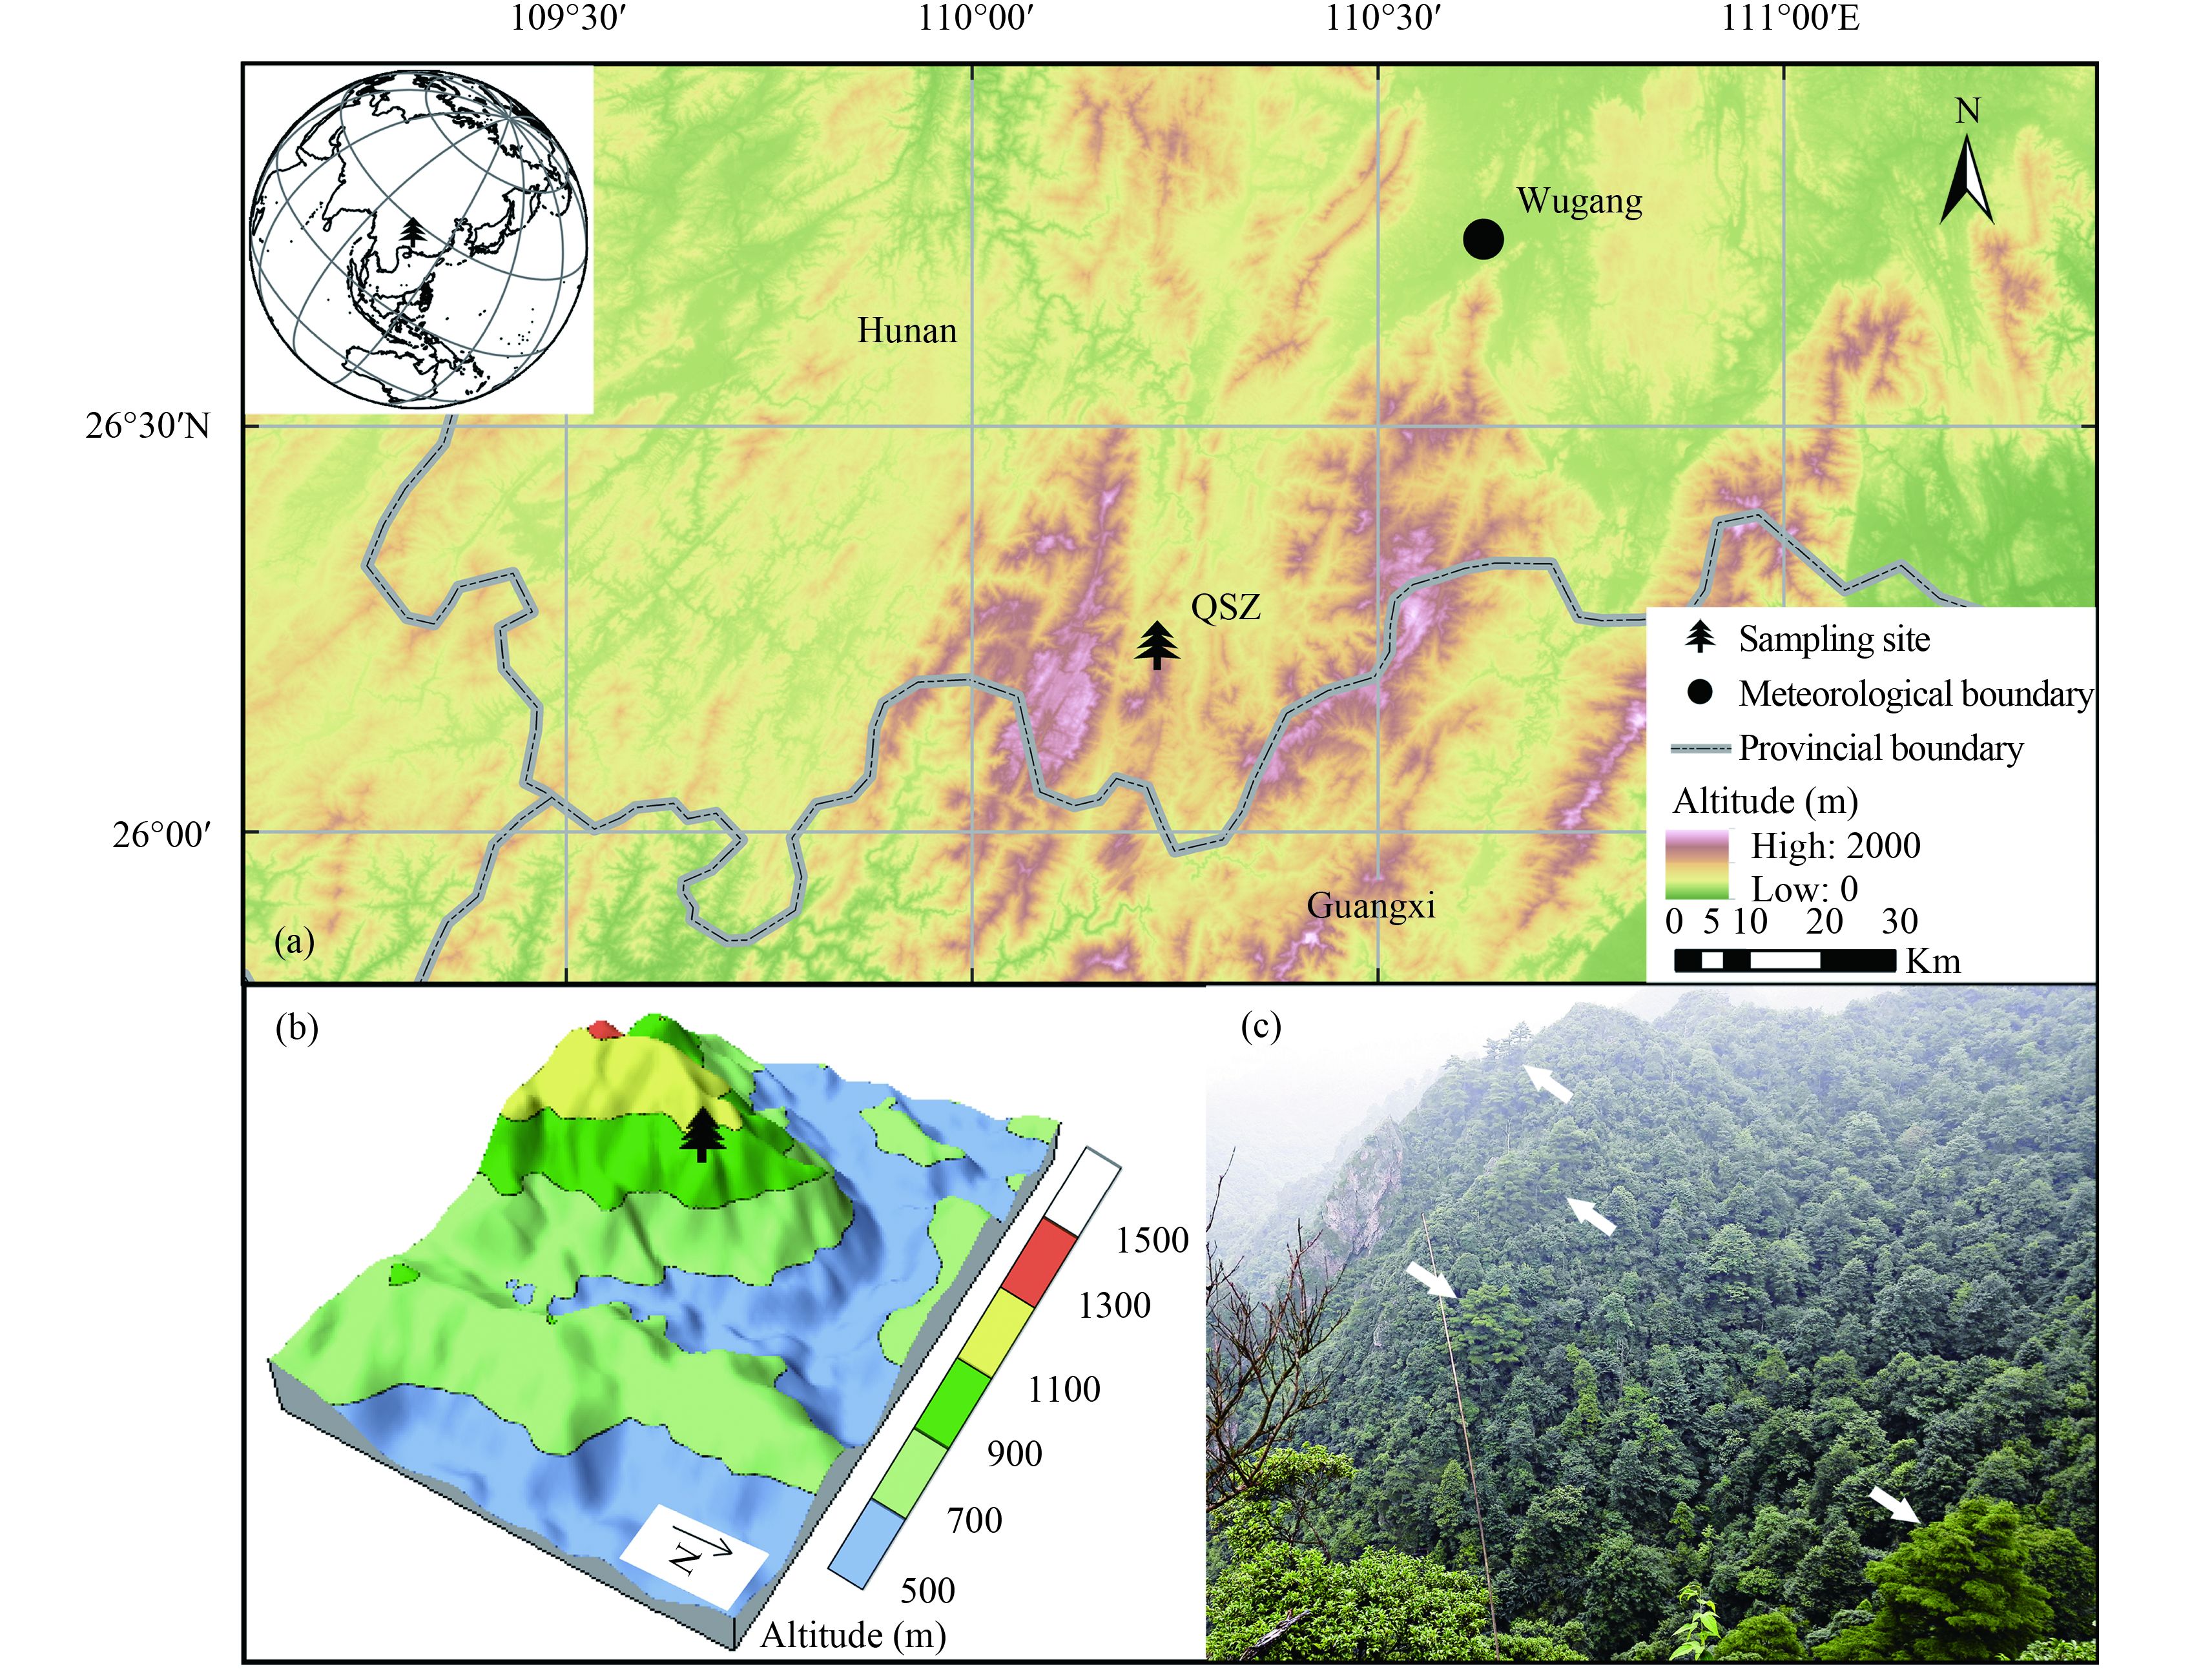
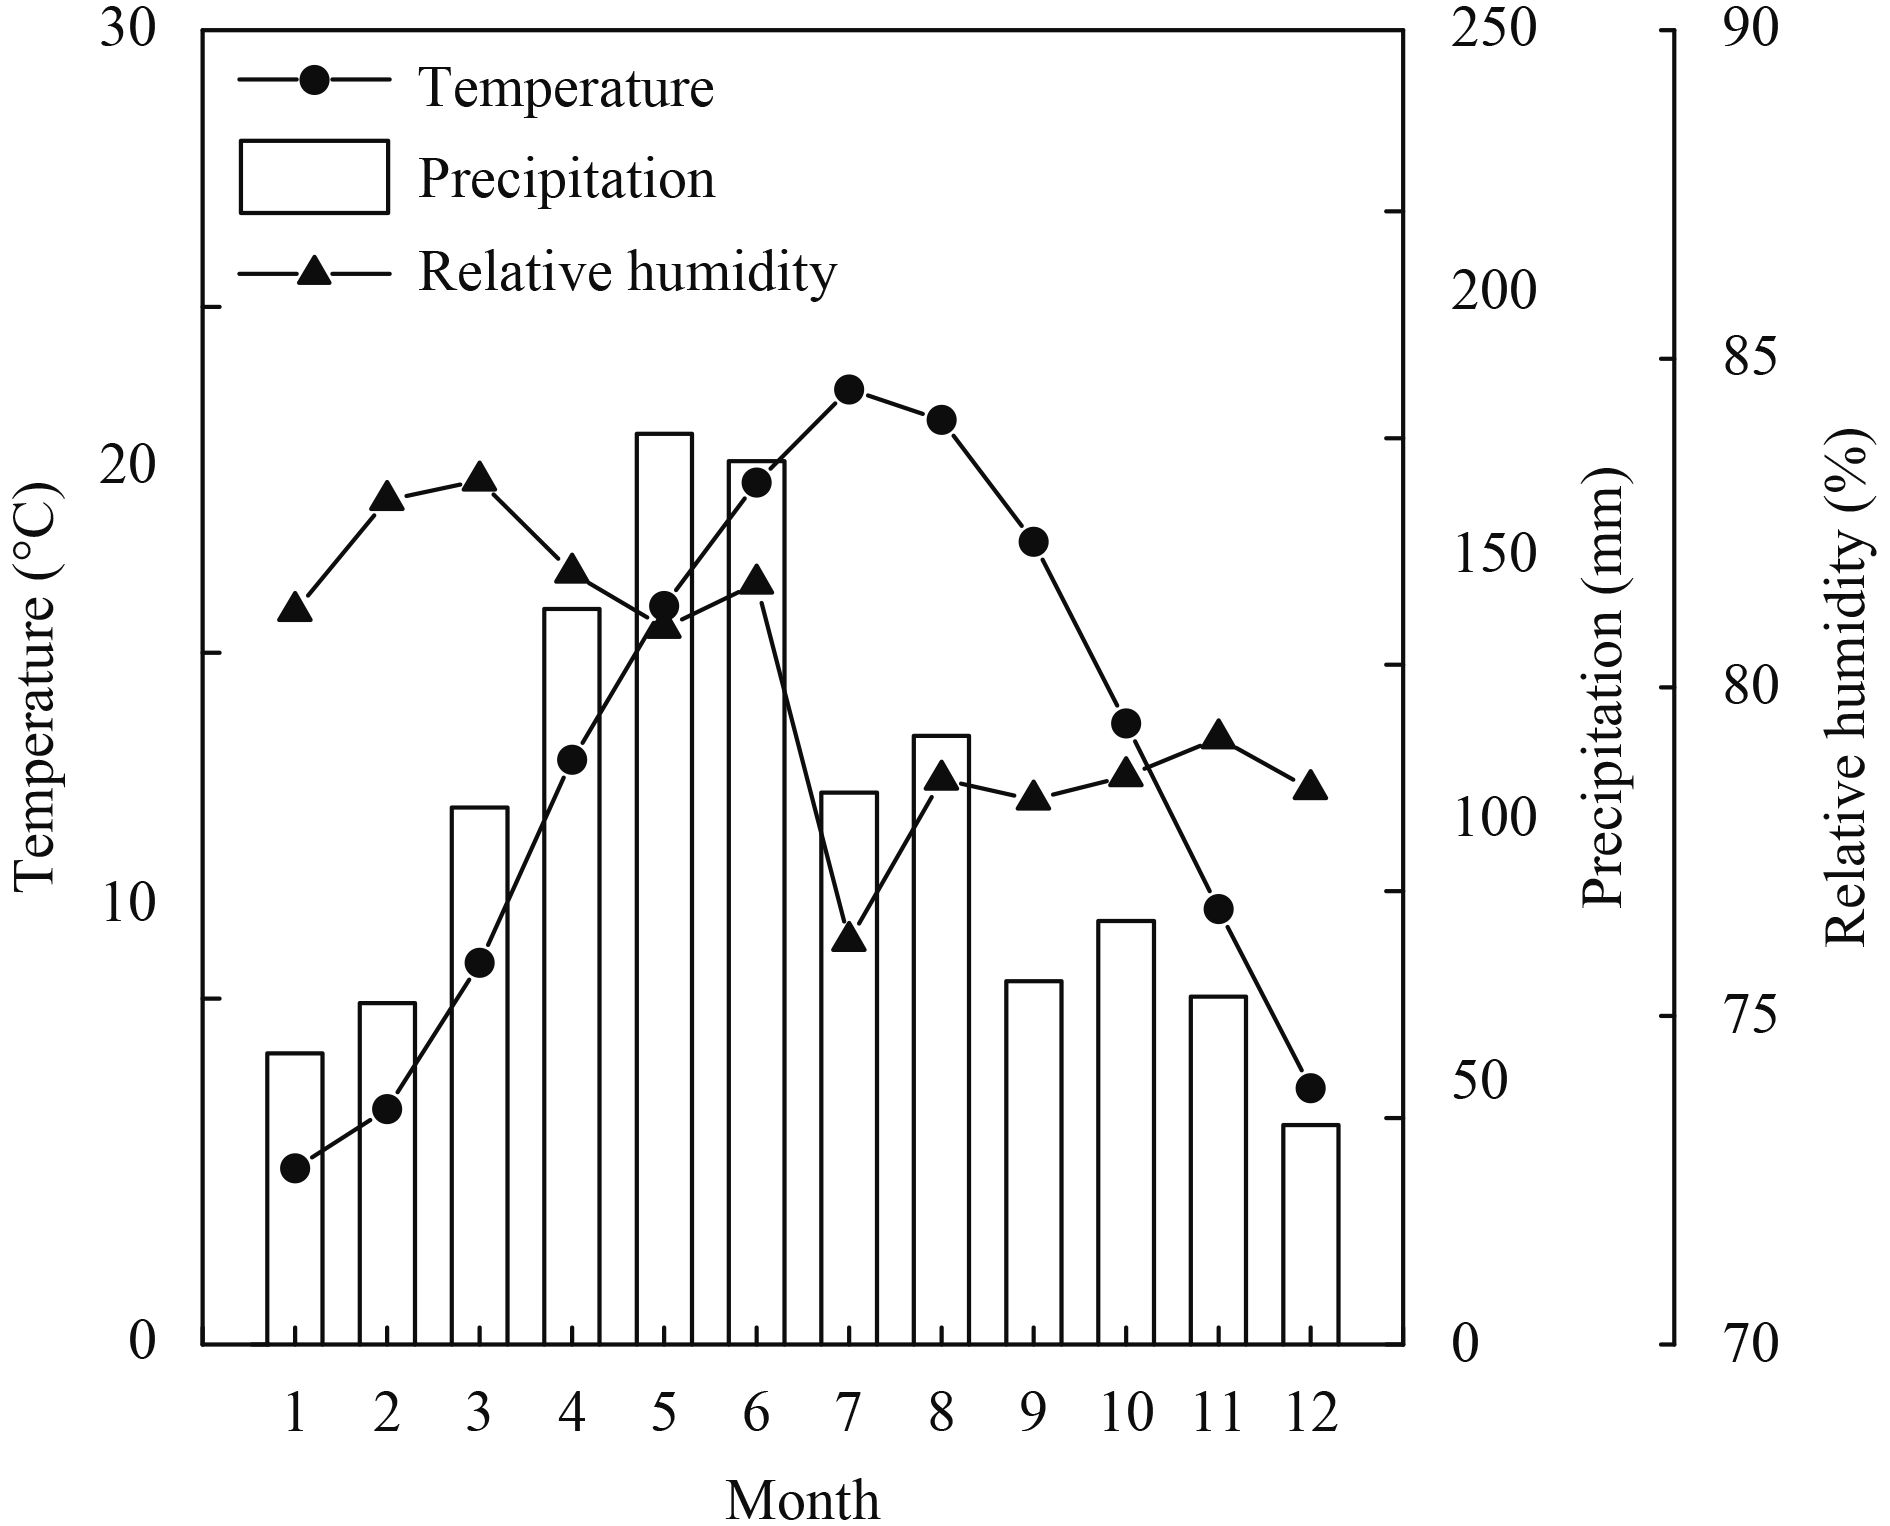
2 Materials and methods 2.1 Sampling siteThe sampling site, Qishanzhai (QSZ) (26°14′N, 110°14′E), is located at the boundary between Hunan and Guangxi, with an altitude of 1030 m above sea level (a.s.l.). The sampled T. longibracteata trees grow along a southeast facing hillside, which is well-drained due to the steep slope of nearly 60° and thin soil layer (Fig. 1). Annual mean temperature and annual total precipitation are 16.8°C and 1371.0 mm, respectively, as calculated from instrumental data of Wugang meteorological station over the period 1953–2014. July and August are the hottest two months, with only 155.0-mm precipitation in total, and become the relatively dry period of the growing season (Fig. 2).
|
| Fig. 1 Overview of the sampling site. (a) Location of the sampling site, QSZ, and Wugang meteorological station; (b) geomorphology; and (c)T. longibracteata trees, indicated by arrows. |
|
| Fig. 2 Monthly mean temperature, monthly total precipitation, and monthly relative humidity at Wugang meteorological station (1953–2014). |
Two increment cores were taken from each tree with an increment borer of 5 mm in diameter, and 28 cores from 14 trees were obtained in total. The cores were dried, mounted, polished, and cross-dated according to standard dendrochronological procedures (Stokes and Smiley, 1996). Given the well-defined boundary between latewood and earlywood (Fig. 3), we measured LWW and EWW separately with a tree-ring width measurement system LINTAB 5 at a resolution of 0.001 mm, following the protocol outlined by Stahle et al. (2009). The quality of the cross-dating and measured data were checked with the software COFECHA (Holmes, 1983), and two cores were eliminated because of their low correlation with the master chronology. The software ARSTAN (Cook, 1985) was used to create earlywood and latewood chronologies (Fig. 4a). All width series were detrended by fitted cubic smoothing spline curves with a 50% frequency response cutoff equal to 67% of the series length to remove age-related growth trends. Residuals between raw width and fitted curves were calculated as the ring-width indices. All the detrended series were averaged to form a standard chronology by using a bi-weight robust mean to minimize the influence of outliers. Variances of the chronology were stabilized to reduce the effects caused by sample size (Osborn et al., 1997). An SSS (subsample signal strength) of larger than 0.8 was employed to determine the most reliable period (Wigley et al., 1984) and, as such, the reliable periods for the LWW and EWW chronologies were established to be 1888–2014 and 1887–2014, respectively. Finally, the LWWadj chronology was constructed based on the common reliable period (1888–2014) of the two chronologies (Fig. 4c). Specifically, the LWW was regressed on the EWW by using a simple linear regression, and the residuals plus a constant 1.0 were defined as the LWWadj chronology (Meko and Baisan, 2001).

|
| Fig. 3 Photo of T. longibracteata tree rings from QSZ. EW and LW denote earlywood and latewood, respectively. |

|
| Fig. 4 (a) Standard chronologies of latewood width (black line) and earlywood width (gray line), along with the (b) sample depth and (c) LWWadj (adjusted latewood width) chronology. |
The closest station to the sampling site is Wugang meteorological station (26°44′N, 110°38′E; 340.1 m a.s.l.; 1953–2014). Monthly maximum, minimum, and mean temperatures and monthly total precipitation were obtained from the National Meteorological Information Center ( http://data.cma.cn). Monthly maximum and mini-mum temperatures and monthly total precipitation were used to calculate the standardized precipitation–evapotranspiration index (SPEI) on one- and two-month scales by using the SPEI R package (Vicente-Serrano et al., 2010). Potential evapotranspiration was computed by using the method of Hargreaves (1994). Furthermore, the SPEI of the grid (26°15′N, 110°15′E; 1901–2014) from SPEIbase version2.4 ( http://sac.csic.es/spei/database.html) was selected for comparison with the reconstructed SPEIJul–Aug.
The ENSO intensity was represented by the averaged anomalies of Niño3.4 sea surface temperature (SST) from the extended reconstructed sea surface temperature (ERSST) datasets version 4 ( http://www.ncdc.noaa.gov/data-access/marineocean-data/extended-reconstructed-sea-surface-temperature-ersst-v4). The spatial range of the western Pacific subtropical high (WPSH)—an important weather system that directly influences the summer hydroclimate in China—was defined by the 5860- and 5880-gpm contours at the geopotential height of 500 hPa using the NCEP–NCAR reanalysis dataset ( http://www.esrl.noaa.gov/psd/data/gridded/data.ncep.reana-lysis.pressure.html;Tao and Wei, 2006).
2.4 MethodsThe relationship between LWWadj and climate factors was explored by Pearson's correlation. A linear regression model was employed to reconstruct the dominant climate factor, and a split calibration–verification procedure was used to examine the model fidelity (Meko and Graybill, 1995). The spatial representativeness of the reconstructed SPEI was investigated by the Royal Netherlands Meteorological Institute Climate Explorer ( http://climexp.knmi.nl). Significant periodicities of the reconstruction were calculated by power-spectrum analysis (Mann and Lees, 1996). The time-dependent impact of ENSO on the reconstructed SPEI was explored by using 21-yr moving correlation.
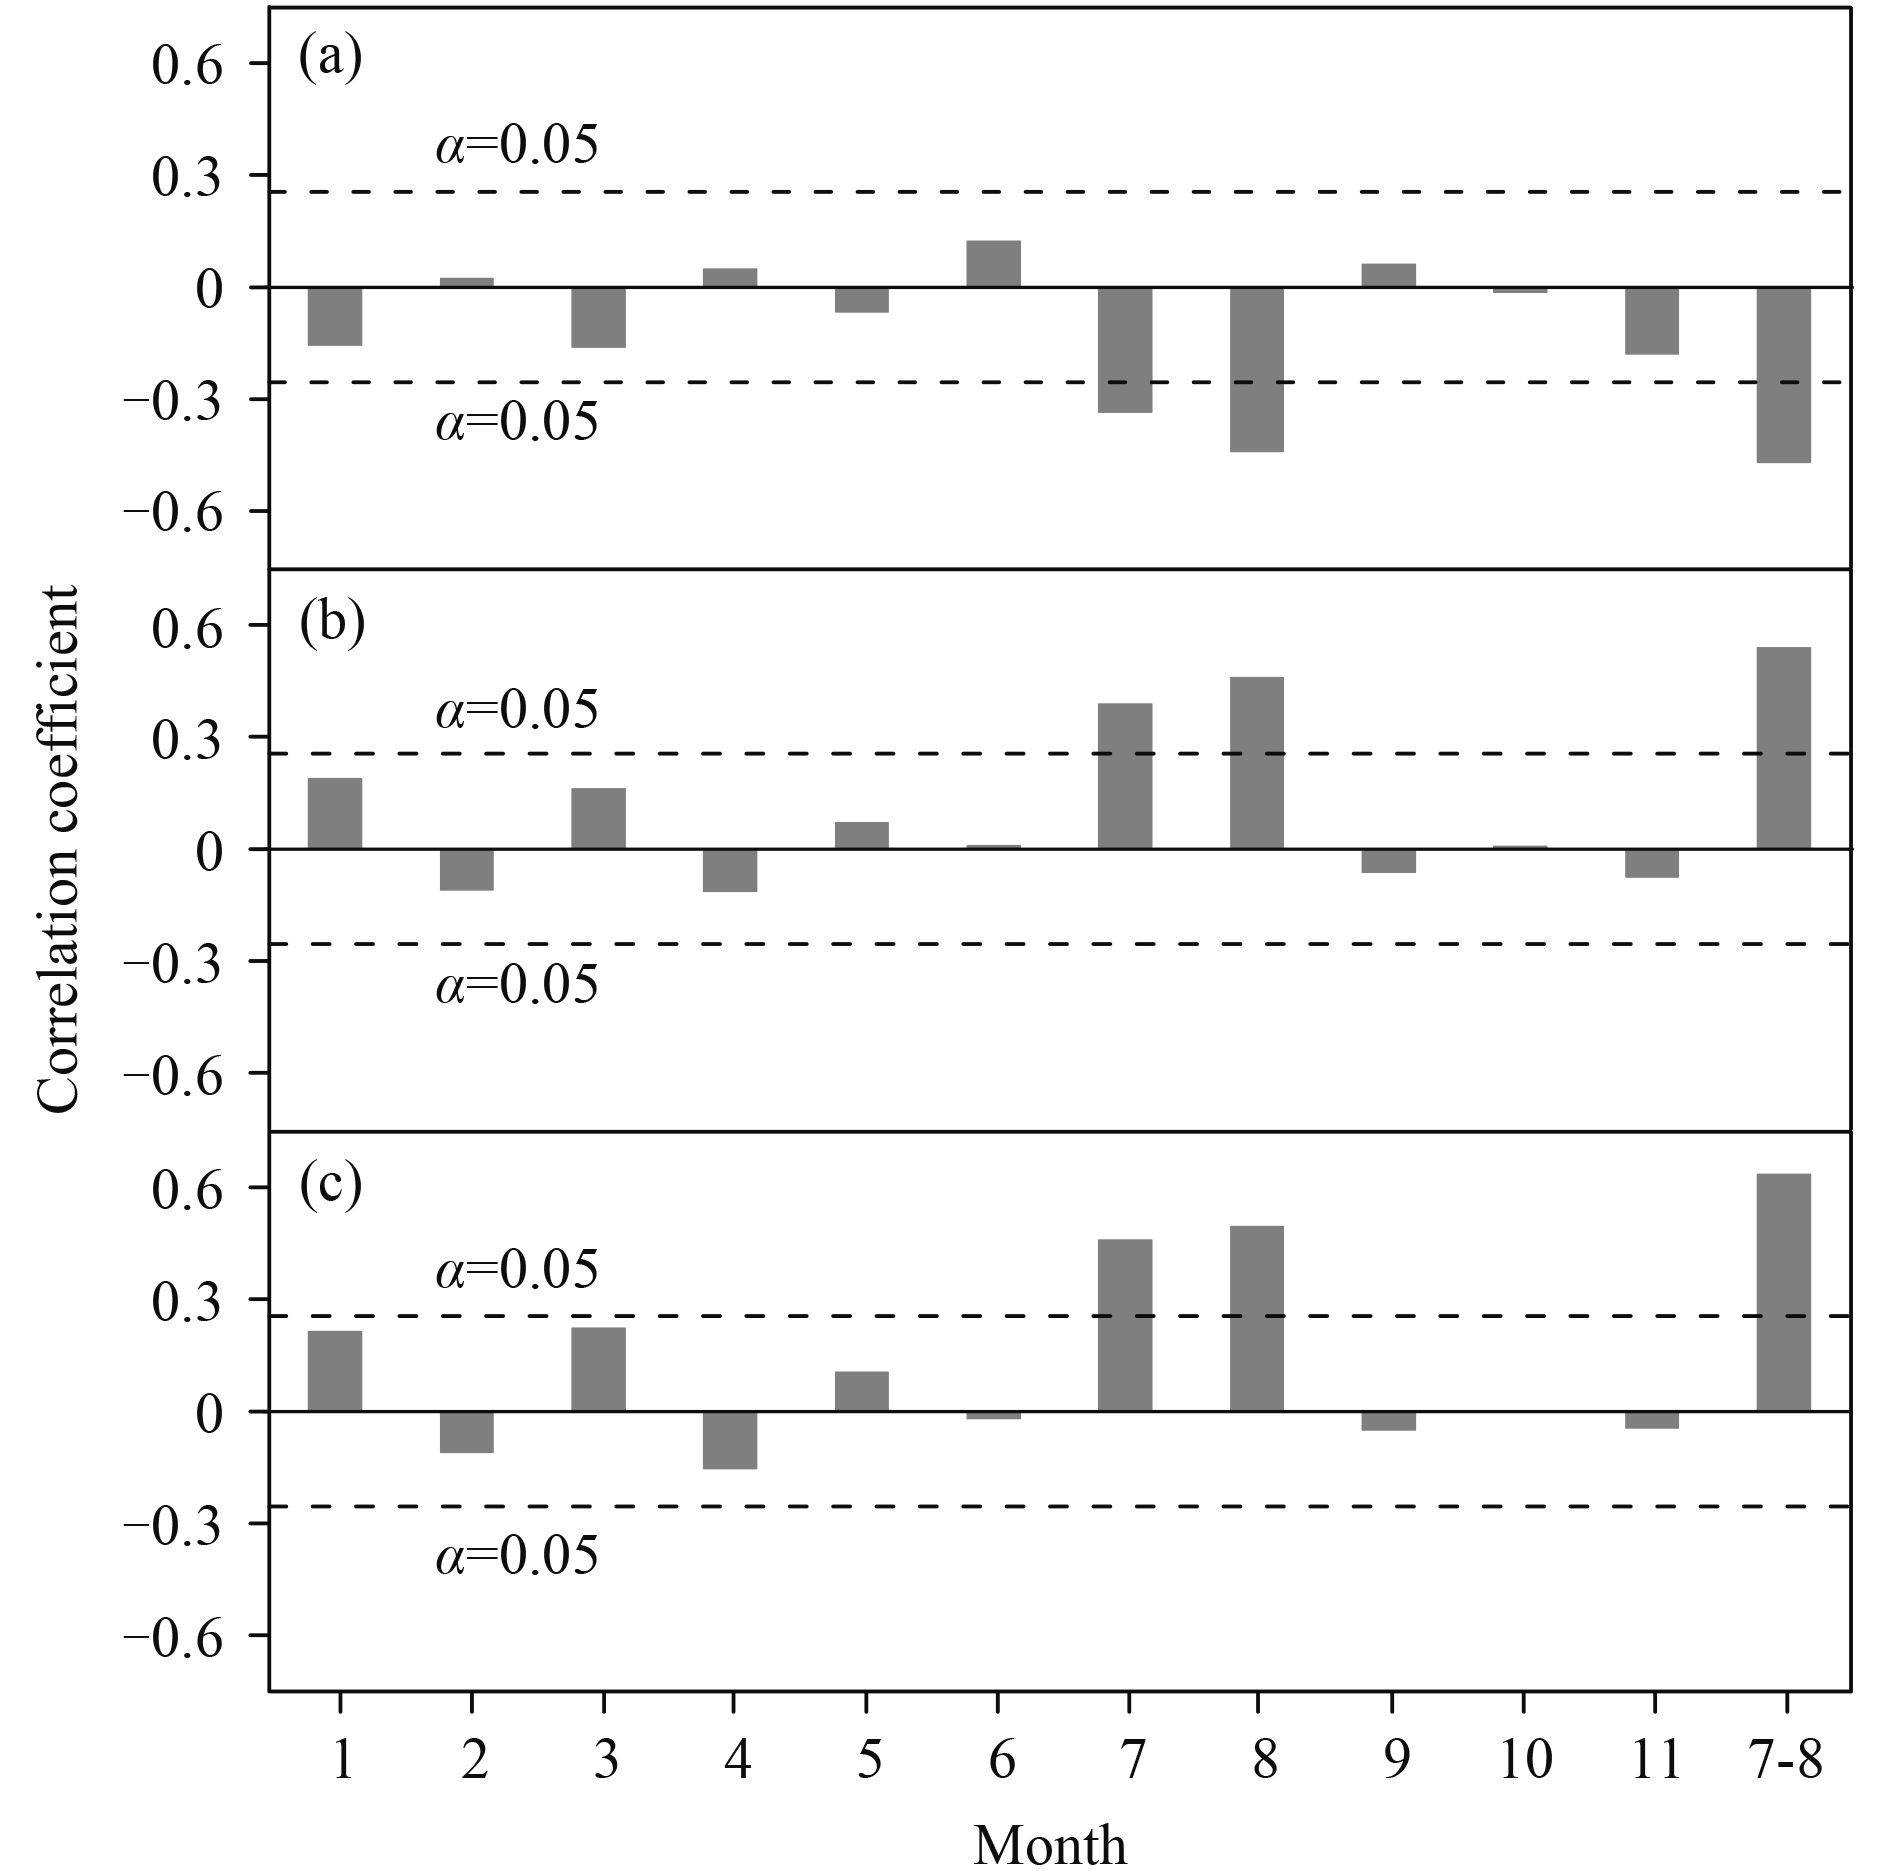
3 Results and discussion 3.1 Climatic significance of LWWadjAs shown in Fig. 5, LWWadj is dominated by July–August climate factors of the growing year. LWWadj is significantly negatively correlated with temperature, yet positively with precipitation, during these two months. The most significant relationship is between LWWadj and July–August SPEI (SPEIJul–Aug), with a correlation coefficient of 0.63 (p < 0.001). In the study area, July and August are the relatively dry months of the growing season, which may cause severe water stress on latewood growth of T. longibracteata, and a cool and wet condition is beneficial to the incremental growth of latewood. Such a relationship has also been found in other studies (Liu et al., 2004;Griffin et al., 2013).
|
| Fig. 5 Correlation between LWWadj and (a) monthly mean tempera-ture, (b) monthly total precipitation, and (c) monthly SPEI. The dashed lines denote the 95% confidence level. SPEIJul–Aug is calculated on a two-month scale. |
Considering that SPEIJul–Aug is the strongest limiting factor on LWWadj, a linear regression model was used to estimate SPEIJul–Aug. The model is as follows:
| $\begin{aligned} {\rm SP\,\,\!\!\!E\;\,\!\!\!I }_{\rm J\;\,\!\!ul-Aug} = & 4.24 \times {\rm LW}{\rm W}_{\rm a\,\,\!\!dj} - 4.25\\ & \left( {{R^2} = } \right. \left. {0.40,\,p < 0.001}\right). \end{aligned}$ | (1) |
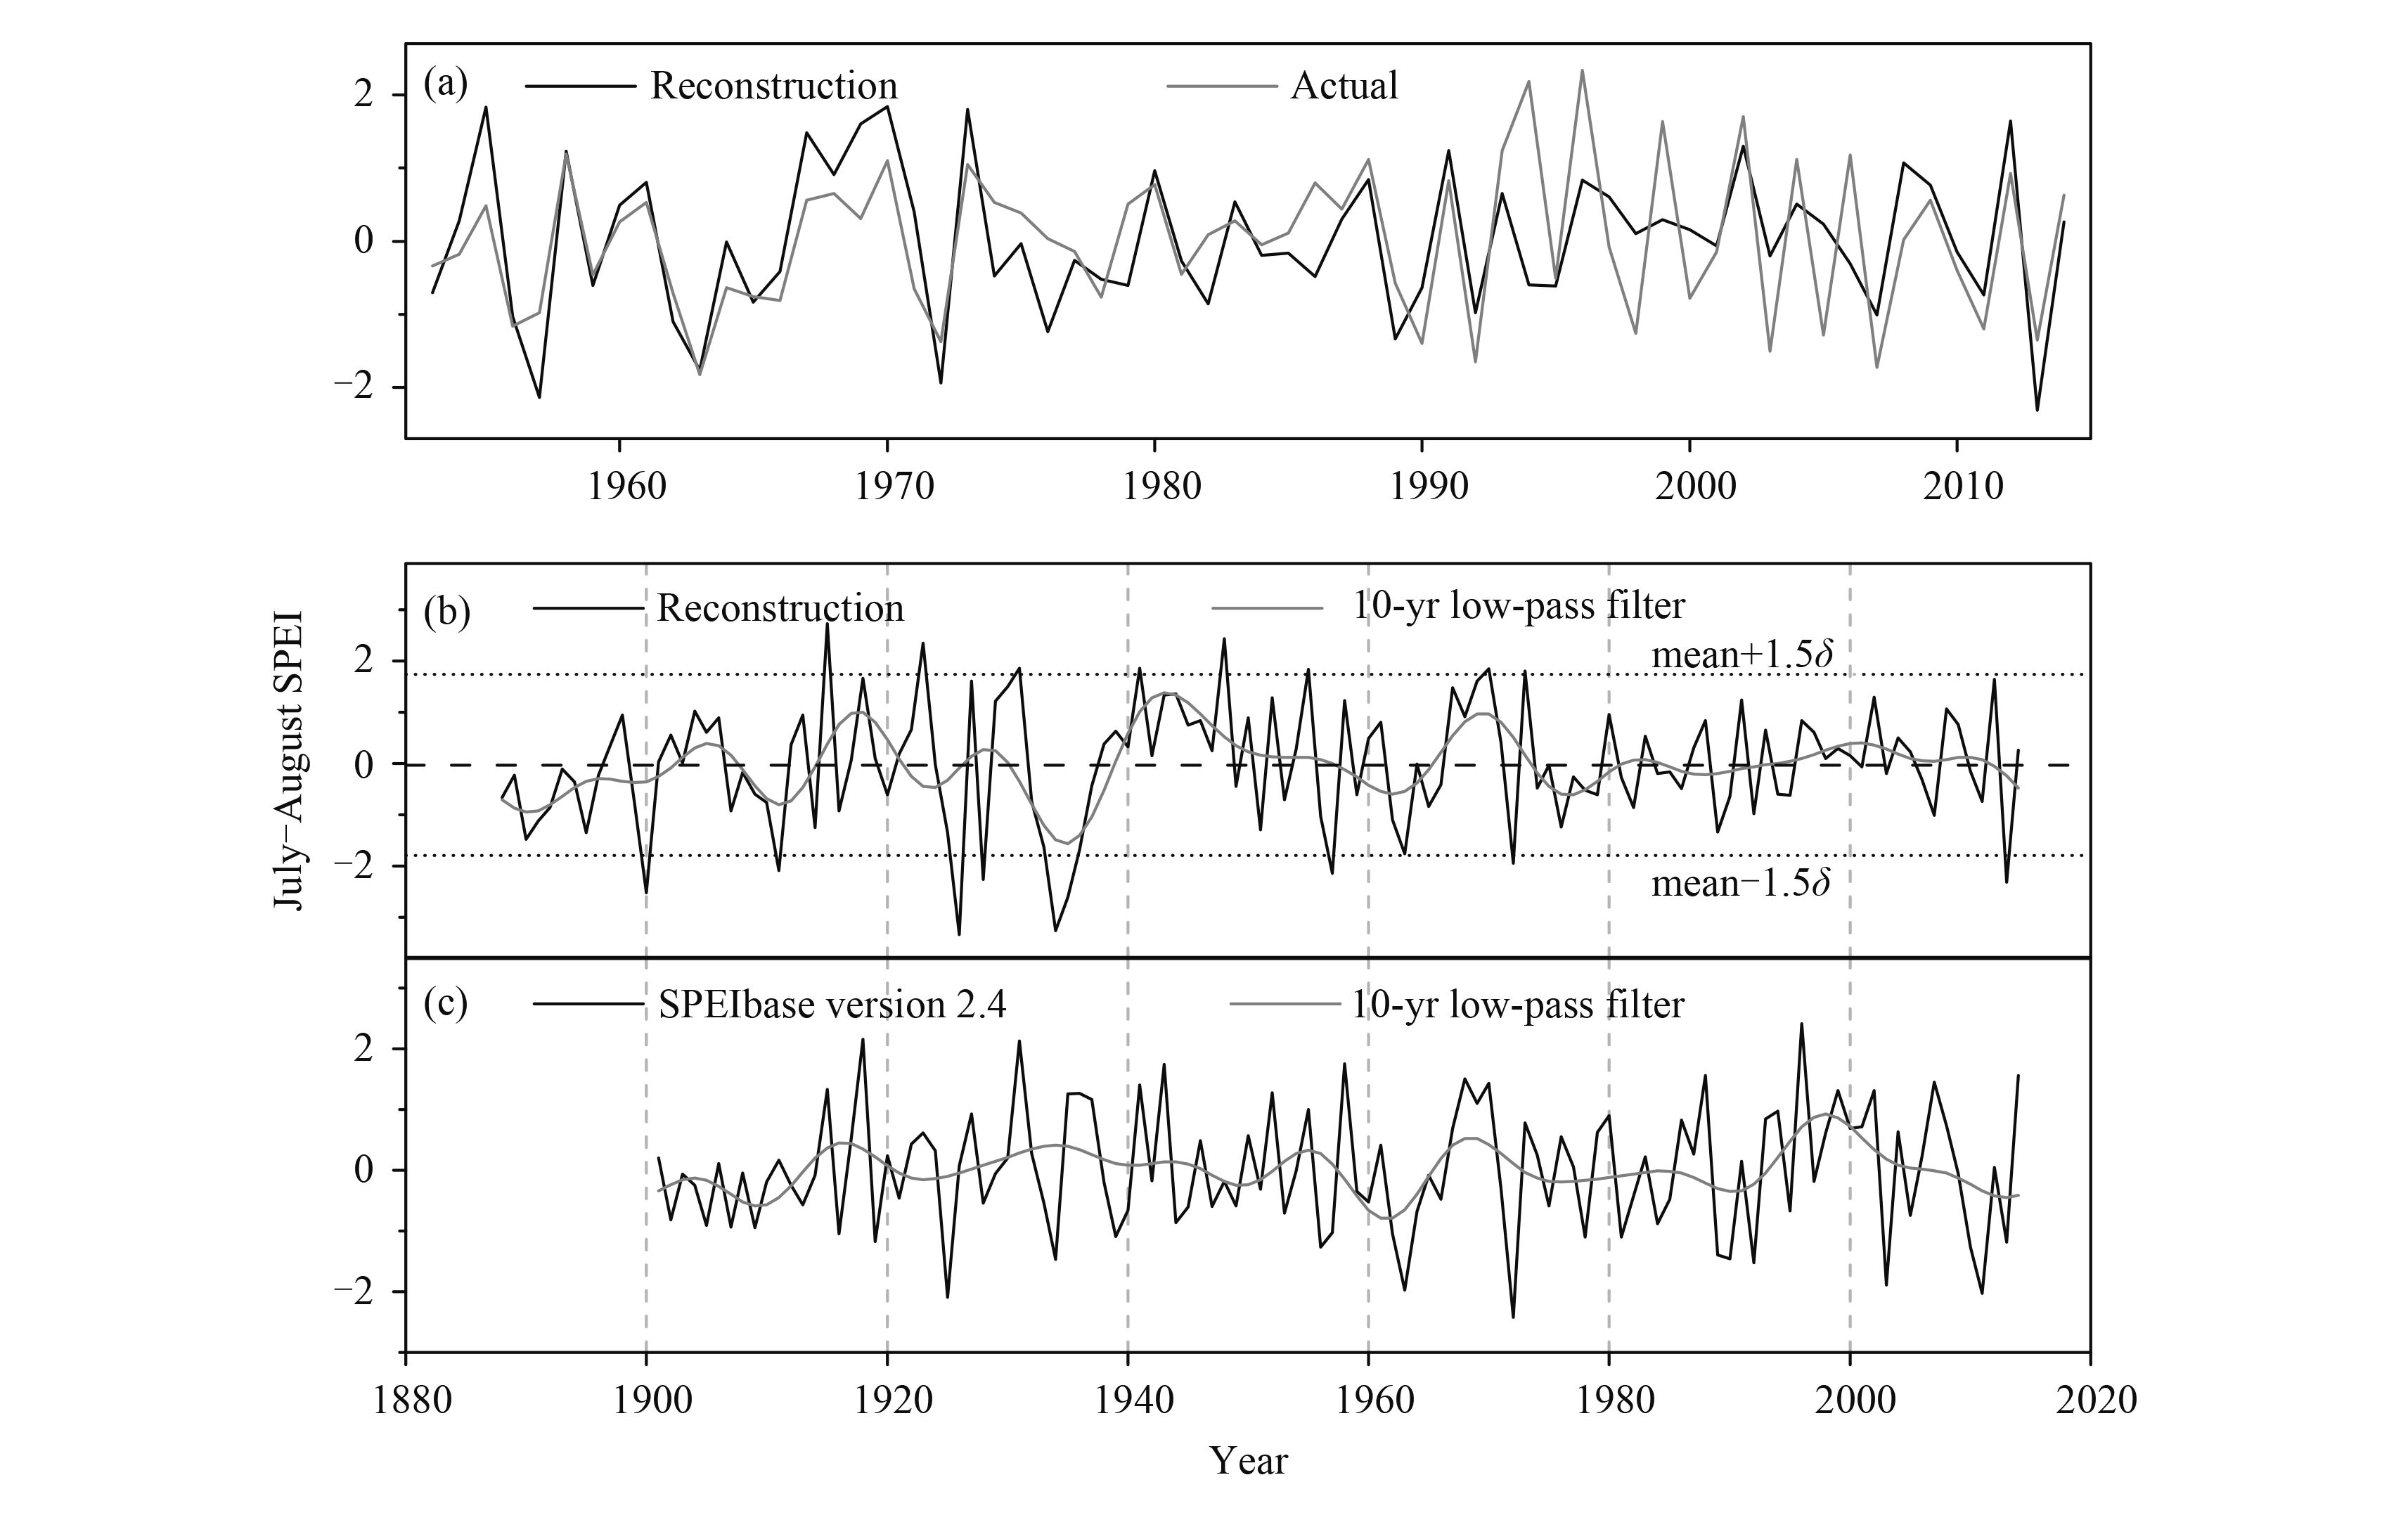
Generally, the reconstructed series exhibits a similar pattern to the actual values (Fig. 6a). The extreme year 1994 is not well reconstructed. If 1994 is excluded from the reconstruction equation, the explained variance of the model will increase to 0.47. However, we still reserve it because the calibration with only moderate values may underestimate the chronology variability (Fang et al., 2012). The split calibration–verification results are shown in Table 1. The correlation coefficients between actual and reconstructed data (r) and the results of sign-tests all reach the significance level of 0.05, and the reduction of error (RE) and coefficient of efficiency (CE) are positive, indicating the validity of the regression model (Fritts, 1976).
|
| Fig. 6 (a) Comparison between the reconstructed (black line) and actual (gray line) SPEIJul–Aug. (b) The reconstructed SPEIJul–Aug (black line) with its 10-yr low-pass filter (gray line). The dashed line represents the mean value of the reconstructed SPEIJul–Aug. The dotted lines represent mean ± 1.5 standard deviations. (c) SPEIJul–Aug of the grid (26°15′N, 111°15′E) from SPEIbase version 2.4 (black line) with its 10-yr low-pass filter (gray line). |
| r | Calibration (1953–1983) | Verification (1984–2014) | Calibration (1984–2014) | Verification (1953–1983) | Full calibration (1953–2014) |
| 0.795** | 0.572** | 0.572** | 0.795** | 0.634** | |
| R2 | 0.632 | 0.327 | 0.327 | 0.632 | 0.402 |
| RE | 0.293 | 0.488 | |||
| CE | 0.278 | 0.461 | |||
| Sign-test | 23/8* | 26/5** | |||
| Note: *p < 0.05; **p < 0.01; RE, reduction of error; and CE, coefficient of efficiency. | |||||
Defined by the mean ± 1.5 standard deviations of the reconstructed SPEIJul–Aug, extremely wet summers were found in 1915, 1923, 1931, 1941, 1948, 1955, 1970, and 1973, while extremely dry summers occurred in 1900, 1911, 1926, 1928, 1934, 1935, 1957, 1972, and 2013. Most of the extremely dry and wet summer events are consistent with descriptions from historical documents (Table 2). According to the rank of extreme years, the severe drought in summer 2013 (Hou et al., 2014) is not unusual because more extreme drought events occurred in the first half of the 20th century, such as in 1926, 1934, and 1900.
| Extreme event type | Year | Reconstructed SPEI value | Description |
| Dry | 1926 | –2.11 | Drought from June to July at Chengbua |
| 1934 | –2.06 | Drought from summer to autumn in central and southern Hunan Province, including Shaoyang and Wugangb | |
| 1935 | –1.65 | Not available | |
| 1900 | –1.59 | Drought from mid April to July at Wugangc and Xinningd | |
| 2013 | –1.46 | Drought from July to August in Hunan Province (Hou et al., 2014) | |
| 1928 | –1.43 | Drought from late spring to autumn at Shaoyangb | |
| 1957 | –1.35 | Drought from July to August at Chengbua | |
| 1911 | –1.32 | Not available | |
| 1972 | –1.23 | Drought from 30 June to 21 July at Chengbua | |
| Wet | 1915 | 1.73 | Severe flood in summer and autumn at Wugang, Daoxian, and Shaoyangb |
| 1948 | 1.54 | Severe flood in summer in Hunan Province; high water level in the Zijiang Riverb | |
| 1923 | 1.49 | Flood in northern Hunan Province, including Anxiang, Huarong, and Hanshoub | |
| 1941 | 1.18 | Not available | |
| 1931 | 1.18 | Severe flood in summer in Hunan Province; high water level in the Zijiang Riverb | |
| 1970 | 1.17 | Heavy rainstorm in July at Xinningd and Tongdaoe | |
| 1955 | 1.16 | Flood in the Zijiang River (Luo and Le, 1996) | |
| 1973 | 1.14 | Not available | |
| Note:aChengbu Miao Autonomous County Annals Compilation Committee (1996),bHunan Institute of Historical Archaeology (1961),cShaoyang Municipal Annals Compilation Committee (1997),dXinning County Annals Compilation Committee (1995), andeTongdao Dong Autonomous County Annals Compilation Committee (1999). | |||
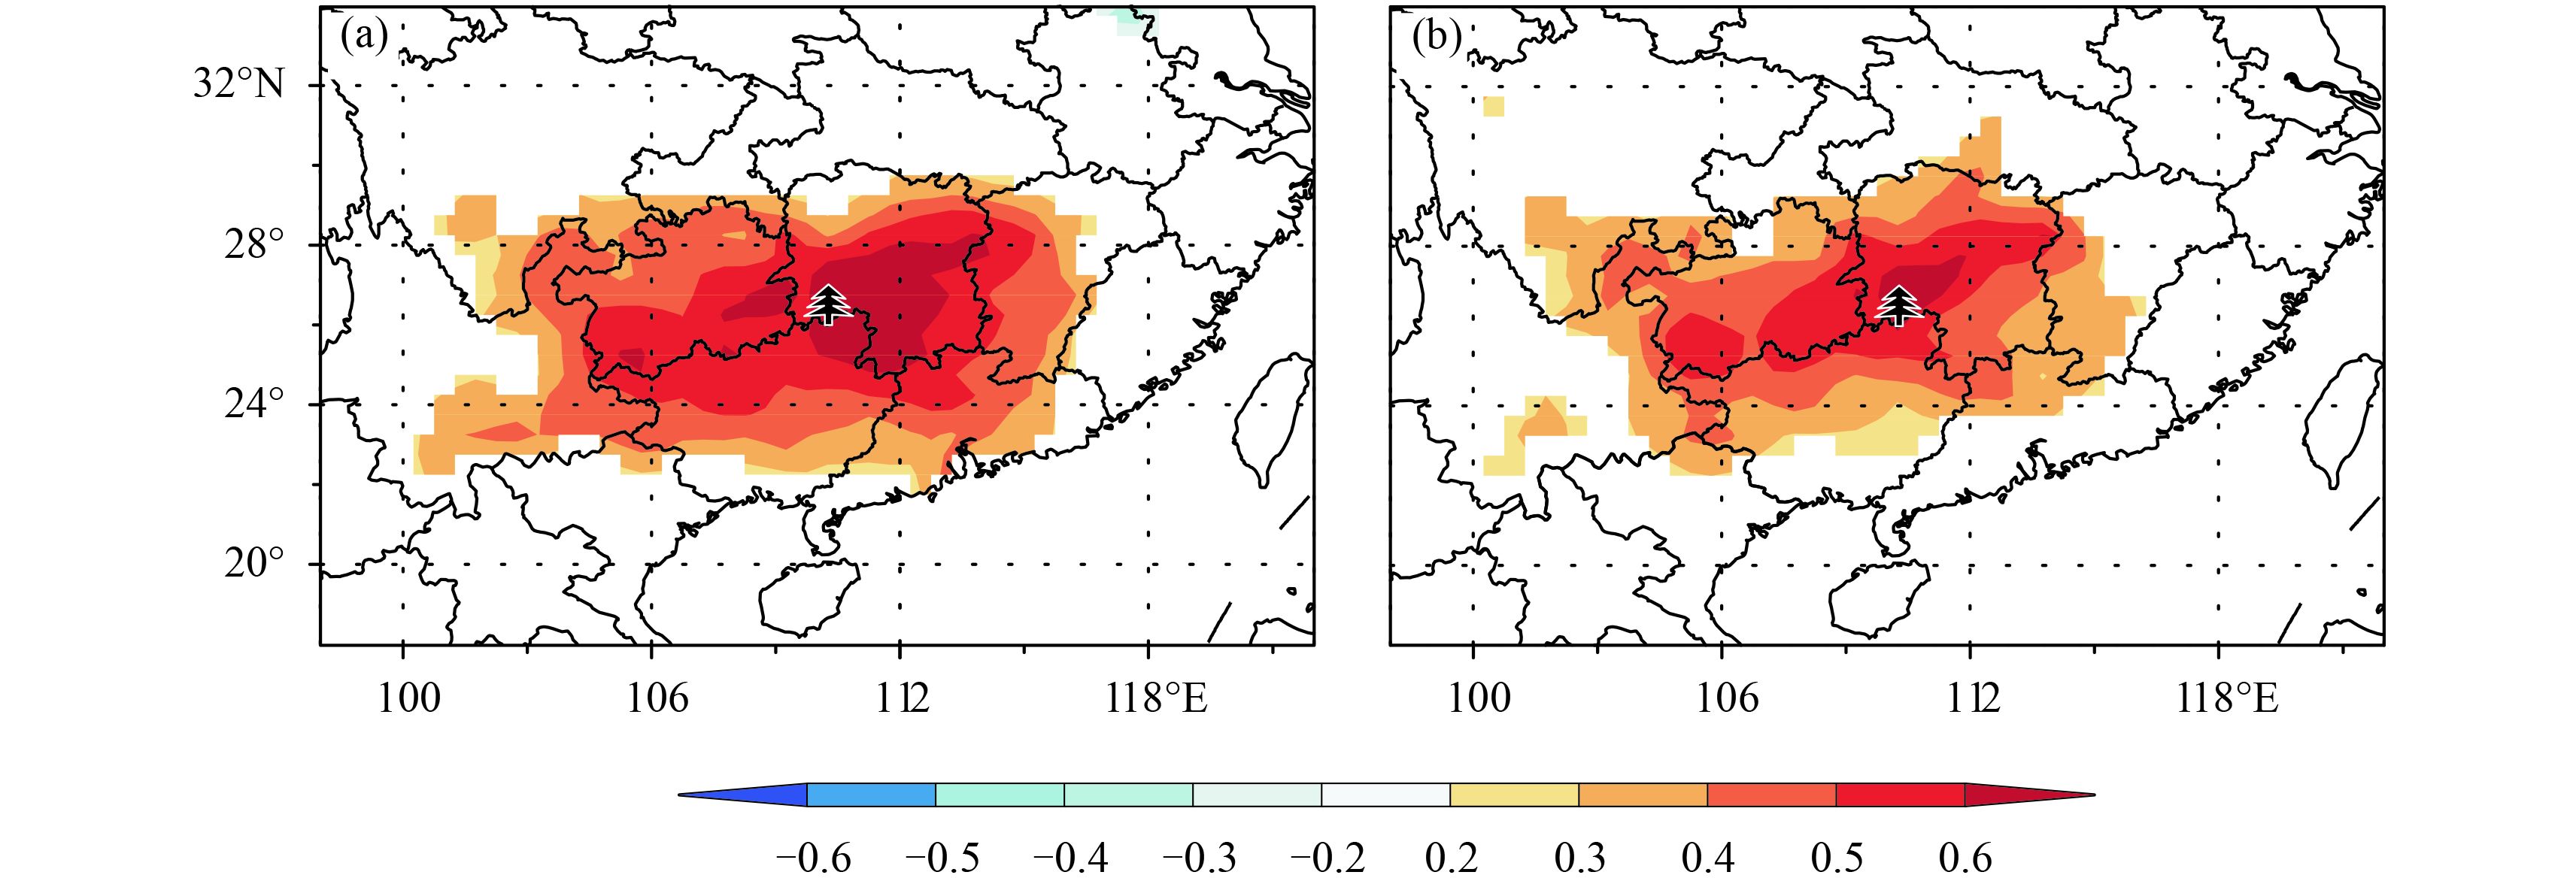
The reconstructed series is quite similar to the adjacent grid SPEI (Fig. 6c), with a correlation coefficient of 0.48 (p < 0.01) over the period 1901–2014, validating the reliability of our reconstruction. Spatial correlation analysis shows that the reconstructed SPEIJul–Aug represents a large region of South China, including northern Guangxi, Hunan, and Guizhou (Fig. 7).
|
| Fig. 7 Spatial correlation between (a) actual and (b) reconstructed SPEIJul–Aug and SPEIbase grids from 1953 to 2013. The tree symbol repre-sents the sampling site. |
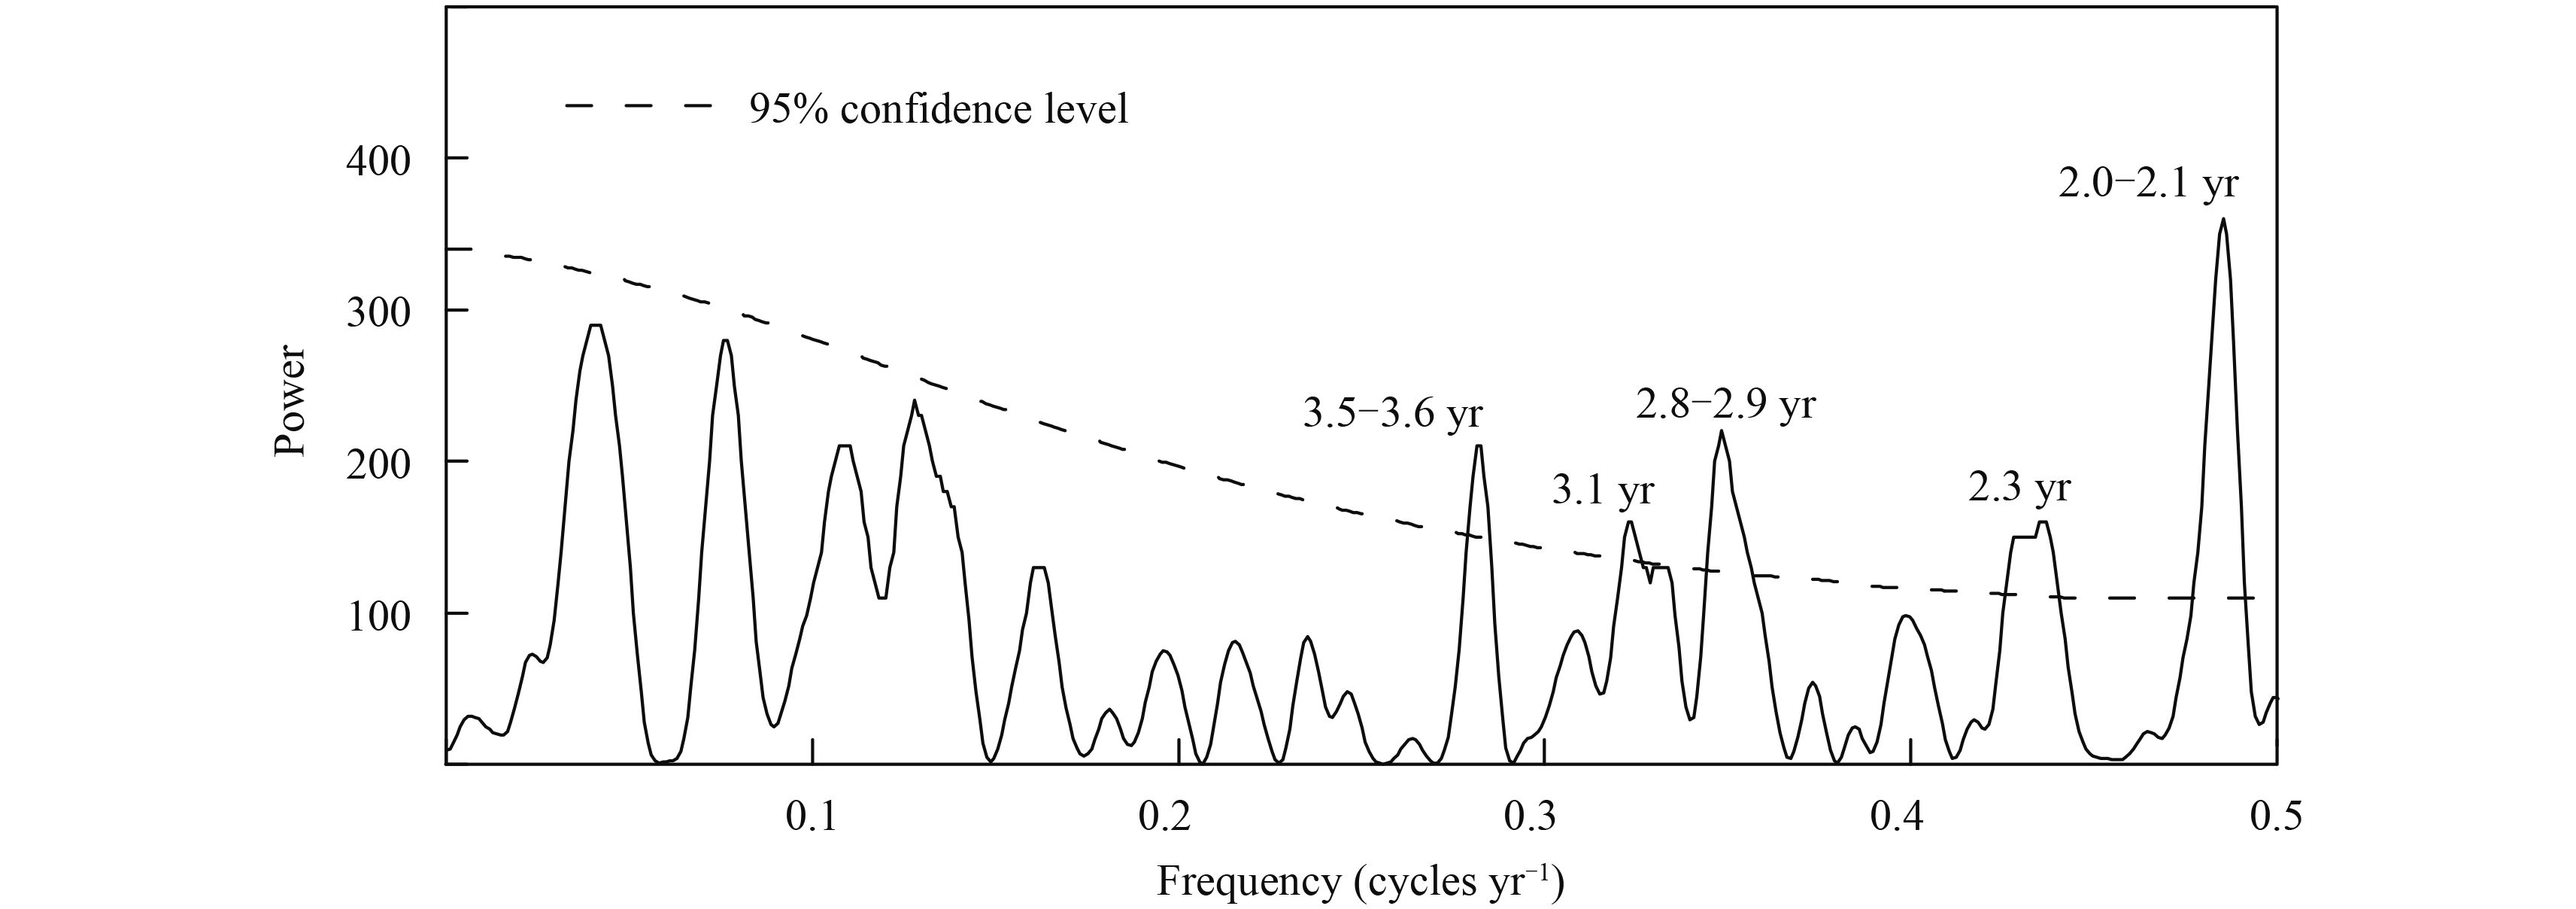
Power spectrum analysis shows 2.0–3.6-yr periodici-ties in our reconstruction that fall within the range of ENSO cycles (Fig. 8;D'Arrigo et al., 2005), indicating that ENSO might have some impacts on the SPEIJul–Aug variations in the study area. ENSO affects the summer rainfall over East Asia by changing the strength of WPSH (Huang and Wu, 1989;Zou and Ni, 1998;Zhang et al., 1999;Chang et al., 2000;Gong et al., 2002;Cai et al., 2003;He et al., 2015). During the mature phase of El Niño events, the warm SST anomalies (SSTAs) in the central–eastern Pacific strengthen the WPSH via the overturning Walker circulation (Ying and Sun, 2000). Meanwhile, the cold SSTAs in the West Pacific enhance the WPSH by forcing an anomalous anticyclone (Wang et al., 2000). Even in the decaying summer of El Niño, the WPSH can still be indirectly enhanced through the so called “capacitor effect” of the tropical Indian Ocean (TIO), which prolongs the impact of ENSO on the WPSH (Xie et al., 2008;Chen et al., 2016b). The anomalous WPSH would shift its northwest rain belt over East Asia, changing the spatiotemporal distribution of precipitation in China (Tao and Wei, 2006). Therefore, autumn–winter ENSO indices have important implications for the WPSH's strength and the hydroclimate of the next summer in South China (Cai et al., 2003;Gao et al., 2006).
|
| Fig. 8 Periodicities of the reconstructed SPEIJul–Aug calculated by power spectrum analysis. |
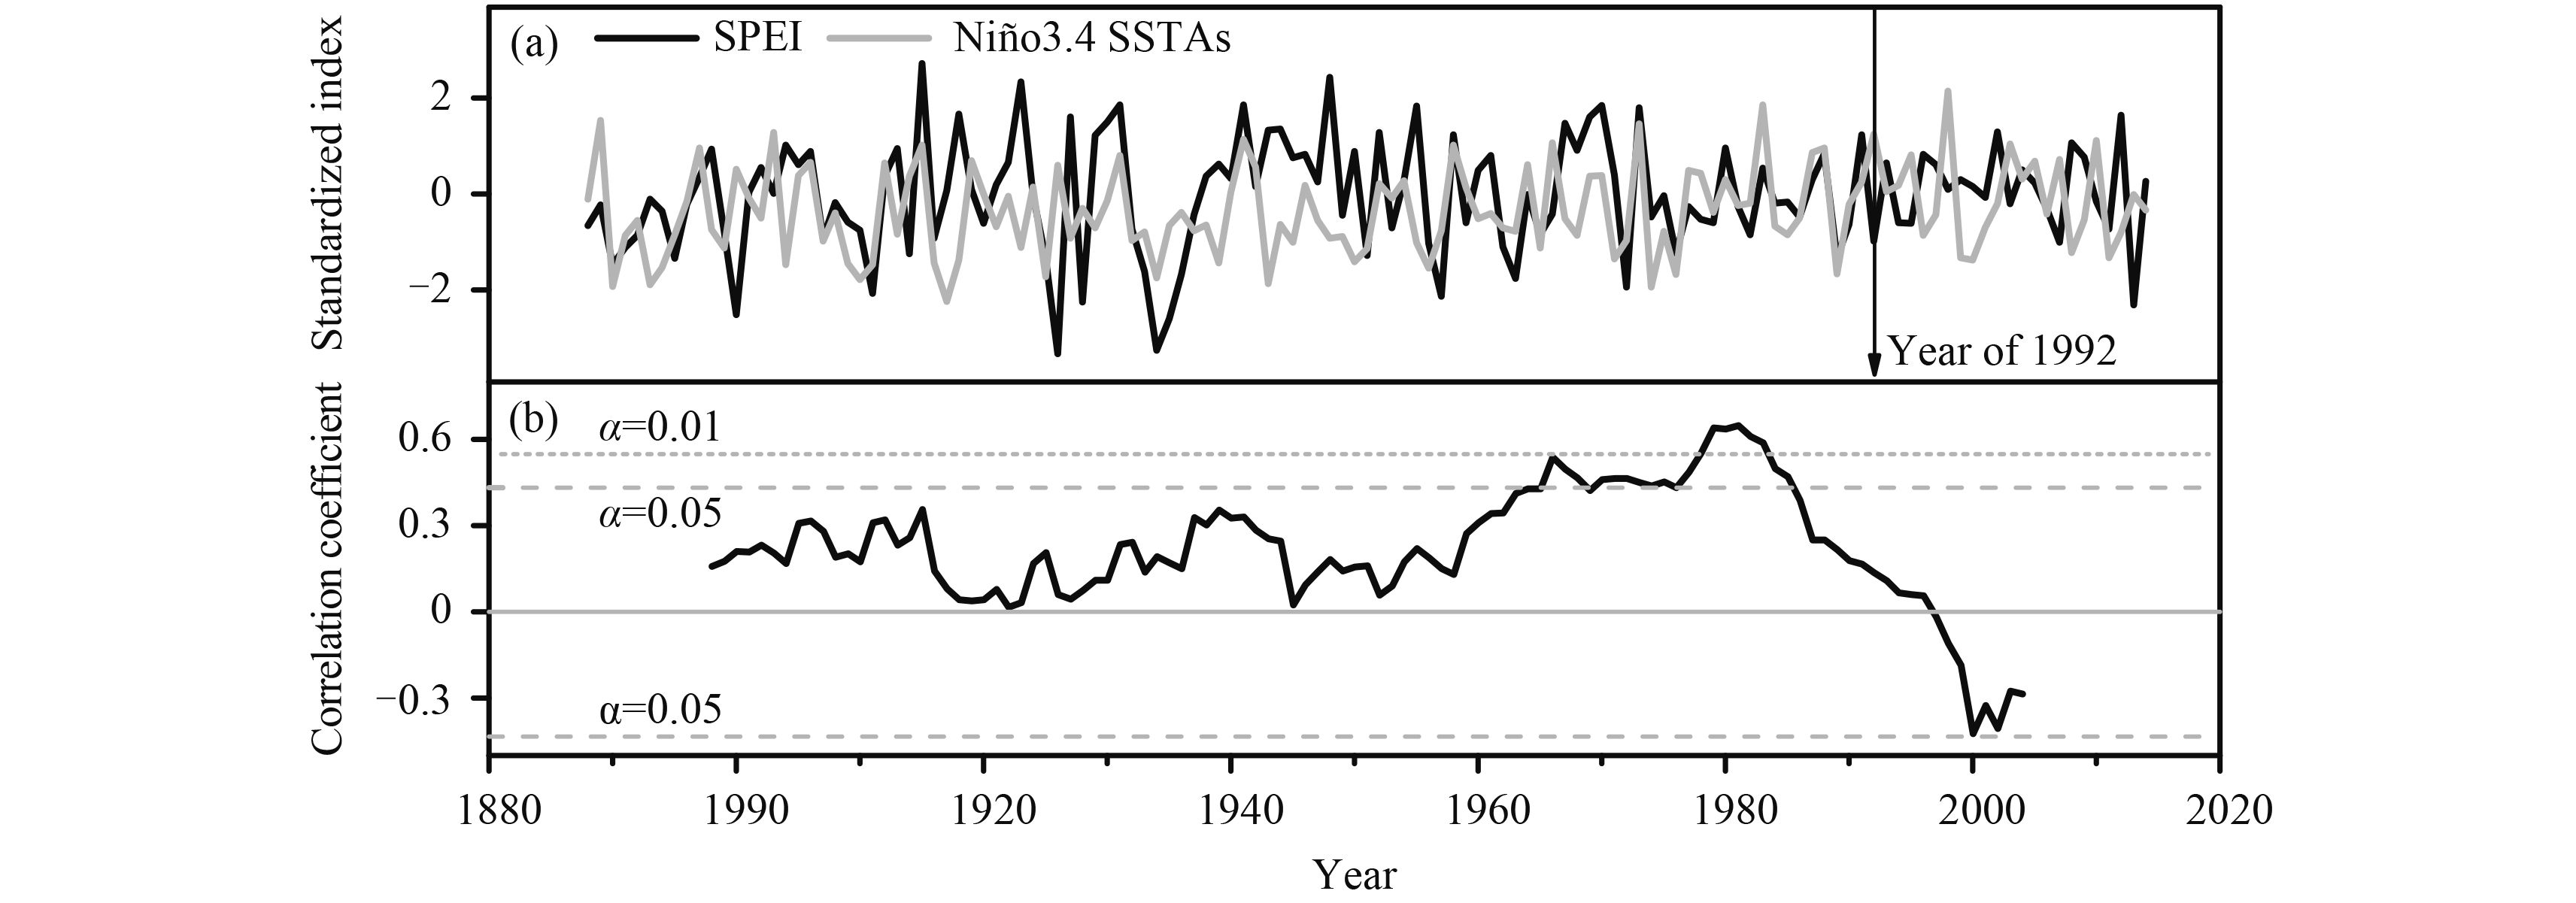
Whether the relationship between SPEIJul–Aug and ENSO is time-dependent is evaluated by 21-yr moving correlation analysis (Fig. 9). It was found that the two indices were in weak association before the 1950s. This phenomenon could be due partly to the small variance of ENSO in 1920–1960 (Torrence and Webster, 1999;Li et al., 2013;Xu et al., 2016). In addition, the “capacitor effect” of the TIO has been reported to be weak during the period 1910–1970 (Chowdary et al., 2012), which may also contribute to the insensitivity of the SPEIJul–Aug response to ENSO. From the 1950s to early 1990s, the correlations became significantly positive, indicating that there was a strong relationship between SPEIJul–Aug and ENSO. After that, the relationship dropped to be weak and even out of phase.
|
| Fig. 9 (a) Comparison of the reconstructed SPEIJul–Aug (black) and Niño3.4 SSTAs (SST anomalies) averaged from the previous September to current February (gray). (b) 21-yr moving correlations between SPEIIJul–Aug and Niño3.4 SSTAs. |
The weakened relationship in the early 1990s may have been directly caused by a significant westward extension of the July–August WPSH (WPSHJul–Aug) on interdecadal timescales. Obvious differences were found between the distributions of WPSHJul–Aug before and after 1992. From 1969 to 1991, the main body of the WPSHJul–Aug, indicated by 5860-gpm contours, was lo-cated in the east of the study region, whether in dry or wet years (Figs. 10a and 10b). When preceding SSTs became warm in ENSO-related regions, the WPSHJul–Aug would be enhanced and its northwest edge extended to the study area (Fig. 10b). The northwest edge of the WPSH is characterized by a low-level jet carrying large amounts of water vapor (Zhou and Yu, 2005), which brings the study region more precipitation. Therefore, the SPEIJul–Aug and preceding Niño3.4 SSTs were in phase before 1992. However, after 1992, the northwest edge of the WPSHJul–Aug passed completely through the study area when preceding SSTs were warmer (Fig. 10c), which could have created continuous stable downdraft over the study region and made the regional hydroclimate dry. Only at the stage of cooler preceding SSTs could the WPSHJul–Aug draw its northwest edge back to the study region (Fig. 10d), and the regional climate tended to be wet. Thus, variations of SPEIJul–Aug and prece-ding Niño3.4 SSTs became out of phase after 1992. The interdecadal westward extension of the WPSH has been reported to be caused by the ocean warming in the early 1990s—particularly the increasd SSTs in the western Pacific, which induced the expansion of the atmospheric column and an increase in geopotential height (Gao et al., 2014).

|
| Fig. 10 Composite July–August 500-hPa geopotential height and preceding SSTs for (a) dry and (b) wet years during 1969–1991, and (c) dry and (d) wet years during 1992–2014. Wet and dry years are derived from the reconstructed SPEIJul–Aug arithmetic mean over the period 1969–2014. Preceding SSTs are from ERSST version 4, averaged from the previous September to current Feburary. The solid line, dashed line, rectangle, and tree symbol represent 5860 gpm, 5880 gpm, Niño3.4 region, and the QSZ sampling site, respectively. |
We reconstructed the SPEIJul–Aug series from 1888 to 2014, which, to the best of the authors' knowledge, is the first paleoclimate reconstruction by using an adjusted latewood width chronology in South China. The reconstructed series is representative of large-scale hydroclimate change in South China. From the perspective of the past 127 years, the extreme summer drought in 2013 was not unprecedented because more extreme events occurred in the first half of the 20th century. The 2.0–3.6-yr periodicities of the reconstruction indicated connections between SPEIJul–Aug and ENSO. However, the relationship was unstable during the whole reconstruction period. It was weak before the 1950s, became significant from the 1950s to early 1990s, and then dropped to be weak again and even out of phase from the early 1990s, which may be attributable to the significant westward extension of the WPSH. This study indicates that summer hydroclimate in South China can be reconstructed based on adjusted latewood width, and will be better understood when more and longer adjusted latewood width chronologies are obtained in the near future.
Acknowledgments . We thank Yanwu Shi, Zhou Yu, and Xinyuan Hou for their assistance in the field; Dr. Jinbao Li and Prof. Jan Bloemendal for improving the language; and the two anonymous reviewers for their constructive comments.
| F. Cai, Y. Liu Q. ,2013: The June–September maximum mean temperature reconstruction from Masson pine (Pinus massoniana Lamb.) tree rings in Macheng, Southeast China since 1879 AD . Chin. Sci. Bull. , 58 (S1) , 169–177. DOI:10.1360/tb-2013-suppl032 |
| Q. F. Cai, Y. Liu ,2016: Two centuries temperature variations over subtropical southeast China inferred from Pinus Taiwanensis Hayata tree-ring width . Climate Dyn. , 1–13. DOI:10.1007/s00382-016-3174-8 |
| X. Z. Cai, B. Wu, Z. Z. Wen ,2003: Relationship between West Pacific subtropical high and ENSO and its influence on rainfall distribution of rainy season in Fujian. J. Trop. Meteor. , 9 , 57–63. DOI:10.3969/j.issn.1006-8775.2003.01.007 |
| C.-P. Chang, Y. S. Zhang, T. Li ,2000: Interannual and interdecadal variations of the East Asian summer monsoon and tropical Pacific SSTs. Part II: Meridional structure of the monsoon. J. Climate , 13 , 4326–4340. DOI:10.1175/1520-0442(2000)013<4326:IAIVOT>2.0.CO;2 |
| F. Chen, Y.-J. Yuan, W.-S. Wei, et al ,2012: Reconstructed temperature for Yong'an, Fujian, Southeast China: Linkages to the Pacific Ocean climate variability. Global and Planetary Change , 86–87 , 11–19. DOI:10.1016/j.gloplacha.2012.01.005 |
| F. Chen, Y. J. Yuan, W. S. Wei, et al ,2015: Tree-ring response of subtropical tree species in Southeast China on regional climate and sea-surface temperature variations. Trees , 29 , 17–24. DOI:10.1007/s00468-013-0951-4 |
| F. Chen, S. L. Yu, Y. J. Yuan, et al ,2016a: A tree-ring width based drought reconstruction for southeastern China: Links to Pacific Ocean climate variability. Boreas , 45 , 335–346. DOI:10.1111/bor.12158 |
| Z. S. Chen, Z. P. Wen, R. G. Wu, et al ,2016b: Relative importance of tropical SST anomalies in maintaining the western North Pacific anomalous anticyclone during El Niño to La Niña transition years. Climate Dyn. , 46 , 1027–1041. DOI:10.1007/s00382-015-2630-1 |
| Chengbu Miao Autonomous County Annals Compilation Committee, 1996:Chengbu Miao Autonomous County Annals. Hunan Press, Changsha, 649 pp. (in Chinese) |
| Chinese Academy of Meteorological Science, 1981:Yearly Charts of Dryness/Wetness in China for the Last 500-Year Period. China Cartographic Publishing House, Beijing, 332 pp. (in Chinese) |
| J. S. Chowdary, S.-P. Xie, H. Tokinaga, et al ,2012: Interdecadal variations in ENSO teleconnection to the Indo–western Pacific for 1870–2007. J. Climate , 25 , 1722–1744. DOI:10.1175/JCLI-D-11-00070.1 |
| Cook, E. R., 1985: A time series analysis approach to tree ring standardization (dendrochronology, forestry, dendroclimatology, autoregressive process). Ph. D. dissertation, University of Arizona, America, 171 pp. |
| R. Cook D'Arrigo, J. Wilson R., et al ,2005: On the variabi-lity of ENSO over the past six centuries. Geophys. Res. Lett. , 32 , L03711. DOI:10.1029/2004GL022055 |
| J. P. Duan, Q.-B. Zhang, L. X. Lv, et al ,2012: Regional-scale winter–spring temperature variability and chilling damage dynamics over the past two centuries in southeastern China. Climate Dyn. , 39 , 919–928. DOI:10.1007/s00382-011-1232-9 |
| J. P. Duan, Q. B. Zhang, L.-X. Lv ,2013: Increased variabi-lity in cold-season temperature since the 1930s in subtropical China. J. Climate , 26 , 4749–4757. DOI:10.1175/JCLI-D-12-00332.1 |
| K. Y. Fang, X. H. Gou, F. H. Chen, et al ,2012: Precipitation variability during the past 400 years in the Xiaolong Mountain (central China) inferred from tree rings. Climate Dyn. , 39 , 1697–1707. DOI:10.1007/s00382-012-1371-7 |
| Fritts, H. C., 1976:Tree Rings and Climate. Academic Press, London, 567 pp. |
| H. Gao, Y. G. Wang, J. H. He ,2006: Weakening significance of ENSO as a predictor of summer precipitation in China. Geophys. Res. Lett. , 33 , L09807. DOI:10.1029/2005GL025511 |
| H. Gao, W. Jiang, W. J. Li ,2014: Changed relationships between the East Asian summer monsoon circulations and the summer rainfall in eastern China. J. Meteor. Res. , 28 , 1075–1084. DOI:10.1007/s13351-014-4327-5 |
| D.-Y. Gong, C.-H. Chang ,2002: Shift in the summer rainfall over the Yangtze River valley in the late 1970s. Geophys. Res. Lett. , 29 , 1436. DOI:10.1029/2001GL014523 |
| D. Griffin, C. A. Woodhouse, D. M. Meko, et al ,2013: North American monsoon precipitation reconstructed from tree-ring latewood. Geophys. Res. Lett. , 40 , 954–958. DOI:10.1002/grl.50184 |
| Y. Ha, Z. Zhong, H. S. Chen, et al ,2016: Out-of-phase decadal changes in boreal summer rainfall between Yellow-Huaihe River valley and southern China around 2002/2003. Climate Dyn. , 47 , 137–158. DOI:10.1007/s00382-015-2828-2 |
| G. H. Hargreaves ,1994: Defining and using reference evapotranspiration. Journal of Irrigation and Drainage Engineering , 120 , 1132–1139. DOI:10.1061/(ASCE)0733-9437(1994)120:6(1132) |
| C. He, T. J. Zhou, B. Wu ,2015: The key oceanic regions responsible for the interannual variability of the western North Pacific subtropical high and associated mechanisms. J. Meteor. Res. , 29 , 562–575. DOI:10.1007/s13351-015-5037-3 |
| T. X. Ho, Q. Li, X. S. Ji ,1984: On the legitimacy of Tsugo-Keteleeria Longibracteata (Cheng) Campo-Duplan et Gaussen as explained by the anatomy of mature wood . Acta Scientiarum Naturalium Universitatis Sunyatseni , 84–90. |
| R. L. Holmes ,1983: Computer-assisted quality control in tree-ring dating and measurement. Tree-Ring Bulletin , 43 , 69–78. |
| W. Hou, Y. Chen, Y. Li, et al ,2014: Climatic characteristics over China in 2013. Meteor. Mon. , 40 , 482–493. DOI:10.7519/j.issn.1000-0526.2014.04.011 |
| R. H. Huang, Y. F. Wu ,1989: The influence of ENSO on the summer climate change in China and its mechanism. Adv. Atmos. Sci. , 6 , 21–32. DOI:10.1007/BF02656915 |
| Hunan Institute of Historical Archaeology, 1961:Hunan Natural Hazard Chronology. Hunan Peoples' Publishing House, Changsha, 165 pp. (in Chinese) |
| Larson, P. R., 1969: Wood formation and the concept of wood quality. Bulletin No. 74. School of Forestry, Yale University, New Haven, 1-54. |
| J. B. Li, S.-P. Xie, E. R. Cook, et al ,2013: El Niño modulations over the past seven centuries. Nature Climate Change , 3 , 822–826. DOI:10.1038/nclimate1936 |
| Y. Liu, J. F. Shi, V. Shishov, et al ,2004: Reconstruction of May–July precipitation in the north Helan Mountain, Inner Mongolia since A.D. 1726 from tree-ring late-wood widths. Chin. Sci. Bull. , 49 , 405–409. DOI:10.1007/BF02900325 |
| X. F. Liu, S. X. Wang, Y. Zhou, et al ,2015: Regionalization and spatiotemporal variation of drought in China based on standardized precipitation evapotranspiration index (1961–2013). Advances in Meteorology , 2015 , 950262. DOI:10.1155/2015/950262 |
| Luo Chengzheng and Le Jiaxiang, 1996:Chinese Floods: Summarized Disastrous Floods. China Bookstore, Beijing, 435 pp. (in Chinese) |
| M. E. Mann, J. M. Lees ,1996: Robust estimation of background noise and signal detection in climatic time series. Climatic Change , 33 , 409–445. DOI:10.1007/BF00142586 |
| D. Meko, D. A. Graybill ,1995: Tree-ring reconstruction of upper Gila River discharge. Journal of the American Water Resources Association , 31 , 605–616. DOI:10.1111/j.1752-1688.1995.tb03388.x |
| D. M. Meko, C. H. Baisan ,2001: Pilot study of latewood-width of conifers as an indicator of variability of summer rainfall in the North American monsoon region. Int. J. Climatol. , 21 , 697–708. DOI:10.1002/joc.646 |
| T. J. Osborn, K. R. Biffa, P. D. Jones ,1997: Adjusting variance for sample-size in tree-ring chronologies and other regional-mean timeseries. Dendrochronologia , 15 , 89–99. |
| Shaoyang Municipal Annals Compilation Committee, 1997:Shaoyang Municipal Annals: Vol. 1. Hunan Press, Changsha, 932 pp. (in Chinese) |
| J. F. Shi, E. R. Cook, H. Y. Lu, et al ,2010: Tree-ring based winter temperature reconstruction for the lower reaches of the Yangtze River in Southeast China. Climate Res. , 41 , 169–175. DOI:10.3354/cr00851 |
| J. F. Shi, E. R. Cook, J. B. Li, et al ,2013: Unprecedented January–July warming recorded in a 178-year tree-ring width chronology in the Dabie Mountains, southeastern China. Palaeogeography, Palaeoclimatology, Palaeoecology , 381-382 , 92–97. DOI:10.1016/j.palaeo.2013.04.018 |
| J. F. Shi, L. L. Li, Z. Y. Han, et al ,2015a: Tree-ring width based June–September temperature reconstruction and its teleconnection with PDO and ENSO in Mount Daowu, Hunan Province. Quaternary Sciences , 35 , 1155–1164. DOI:10.11928/j.issn.1001-7410.2015.05.11 |
| J. F. Shi, H. Y. Lu, J. B. Li, et al ,2015b: Tree-ring based February–April precipitation reconstruction for the lower reaches of the Yangtze River, Southeastern China. Global and Planetary Change , 131 , 82–88. DOI:10.1016/j.gloplacha2015.05.006 |
| D. W. Stahle, M. K. Cleavel, H. D. Grissino-Mayer, et al ,2009: Cool and warm-season precipitation reconstructions over western New Mexico. J. Climate , 22 , 3729–3750. DOI:10.1175/2008JCLI2752.1 |
| Stokes, M. A., and T. L. Smiley, 1996:An Introduction to Tree-Ring Dating. The University of Arizona Press, Tucson, America, 73 pp. |
| S. Y. Tao, J. Wei ,2006: The westward, northward advance of the subtropical high over the West Pacific in summer. J. Appl. Meteor. Sci. , 17 , 513–525. |
| Tongdao Dong Autonomous County Annals Compilation Committee, 1999:Tongdao County Annals. Ethnic Publishing House, Beijing, 974 pp. (in Chinese) |
| C. Torrence, P. J. Webster ,1999: Interdecadal changes in the ENSO-monsoon system. J. Climate , 12 , 2679–2690. DOI:10.1175/1520-0442(1999)012<2679:ICITEM>2.0.CO;2 |
| M. Vicente-Serrano, Beguería S., J. I. López-Moreno S. ,2010: A multiscalar drought index sensitive to global warming: The standardized precipitation evapotranspiration Index. J. Climate , 23 , 1696–1718. DOI:10.1175/2009JCLI2909.1 |
| B. Wang, R. G. Wu, X. H. Fu ,2000: Pacific-East Asian teleconnection: How does ENSO affect East Asian climate?. J. Climate , 13 , 1517–1536. DOI:10.1175/1520-0442(2000)013<1517:PEATHD>2.0.CO;2 |
| T. M. L. Wigley, K. R. Briffa, P. D. Jones ,1984: On the average value of correlated time series, with applications in dendroclimatology and hydrometeorology. J. Appl. Meteor. , 23 , 201–213. DOI:10.1175/1520-0450(1984)023<0201:OTAVOC>2.0.CO;2 |
| S.-P. Xie, K. M. Hu, J. Hafner, et al ,2008: Indian ocean capacitor effect on Indo–western Pacific climate during the summer following El Niño. J. Climate , 22 , 730–747. DOI:10.1175/2008JCLI2544.1 |
| Xinning County Annals Compilation Committee, 1995:Xinning County Annals. Hunan Press, Changsha, 799 pp. (in Chinese) (请核对英文标题信息) |
| C. X. Xu, J. Y. Ge, T. Nakatsuka, et al ,2016: Potential utility of tree ring δ18O series for reconstructing precipitation records from the lower reaches of the Yangtze River, Southeast China . J. Geophys. Res. , 121 , 3954–3968. DOI:10.1002/2015JD023-610 |
| M. Ying, S. Q. Sun ,2000: A study on the response of subtropical high over the western Pacific on the SST anomaly. Chinese J. Atmos. Sci. , 24 , 193–206. |
| P. M. Zhai, R. Yu, Y. J. Guo, et al ,2015: The strong El Niño of 2015/16 and its dominant impacts on global and China's climate. J. Meteor. Res. , 30 , 283–297. DOI:10.1007/s13351-016-6101-3 |
| R. H. Zhang, A. Sumi, M. Kimoto ,1999: A diagnostic study of the impact of El Niño on the precipitation in China. Adv. Atmos. Sci. , 16 , 229–241. DOI:10.1007/BF02973084 |
| J. Y. Zheng, Q. S. Ge, Z. X. Hao, et al ,2014: Paleoclimatology proxy recorded in historical documents and method for reconstruction on climate change. Quaternary Sciences , 34 , 1186– 1196 . DOI:10.3969/j.issn.1001-7410.2014.06.07 |
| J. Y. Zheng, W.-C. Wang, Q. S. Ge, et al ,2006: Precipitation variability and extreme events in eastern China during the past 1500 years. Terrestrial Atmospheric and Oceanic Sciences , 17 , 579–592. |
| Y. H. Zheng, Y. Zhang, X. M. Shao, et al ,2012: Temperature variability inferred from tree-ring widths in the Dabie Mountains of subtropical central China. Trees , 26 , 1887–1894. DOI:10.1007/s00468-012-0757-9 |
| T.-J. Zhou, R.-C. Yu ,2005: Atmospheric water vapor transport associated with typical anomalous summer rainfall patterns in China. J. Geophys. Res. , 110 (D8) , D08104. DOI:10.1029/2004JD005413 |
| H. F. Zong, L. T. Chen, Q. Y. Zhang ,2010: The instability of the interannual relationship between ENSO and the summer rainfall in China. Chinese J. Atmos. Sci. , 34 , 184–192. DOI:10.3878/j.issn.1006-9895.2010.01.17 |
| L. Zou, Y. Q. Ni ,1998: Impact of ENSO on variability of summer monsoon over Asia and summer rainfall in China. J. Trop. Meteor. , 4 , 30–37. |
 2017, Vol. 31


