The Chinese Meteorological Society
Article Information
- GAO Chaochao, GAO Yujuan, ZHANG Qian, SHI Chunming . 2017.
- Climatic Aftermath of the 1815 Tambora Eruption in China. 2017.
- J. Meteor. Res., 31(1): 28-38
- http://dx.doi.org/10.1007/s13351-017-6091-9
Article History
- Received June 13, 2016
- in final form December 9, 2016
2. State Key Laboratory of Earth Surface Processes and Resource Ecology, College of Global Change and Earth System Science, Beijing Normal University, Beijing 100875
The year 2015 marks the 200th anniversary of the Mount Tambora eruption—the famous eruption that caused the “Year without a Summer” in 1816 across a large part of the world (Luterbacher and Pfister, 2015). The volcano is located on the Indonesian Island of Sumbawa (8.25°S, 118.00°E), and its April 1815 eruption injected approximately 60 megatons of sulfur into the stratosphere, which is six times more than what was released by the 1991 Pinatubo eruption, and marks the largest explosive eruption of the last 500 years (Self et al., 2004). The resulting sulfate aerosol cloud cooled the surface by reflecting sunlight, causing short-lived but substantial energy imbalances of up to –5 W m–2 in global downward shortwave radiative forcing at the tropopause (Kandlbauer et al., 2013).
Great effort has been devoted to studying the nature and climatic consequences of the Tambora eruption (Stothers, 1984;Robock, 2001). The first comprehensive overview was published by Harington (1992), who summarized findings obtained from climate data and proxies, together with societal impacts emerged from different disciplines. Since then, significant progress has been made in understanding the spatiotemporal extent and mechanisms of the climatic response to volcanic perturbations, owing to the growing availability of documentary evidence, proxy reconstructions, and climate model simulations (Haywood et al., 2013;Iles and Hegerl, 2014;Wegmann et al., 2014;Brönnimann et al., 2015;Luterbacher and Pfister, 2015). As a result, the climatic and environmental consequences of the 1815 Tambora eruption in North America and Europe are well observed (Oppenheimer, 2003;Luterbacher and Pfister, 2015;Raible et al., 2016).
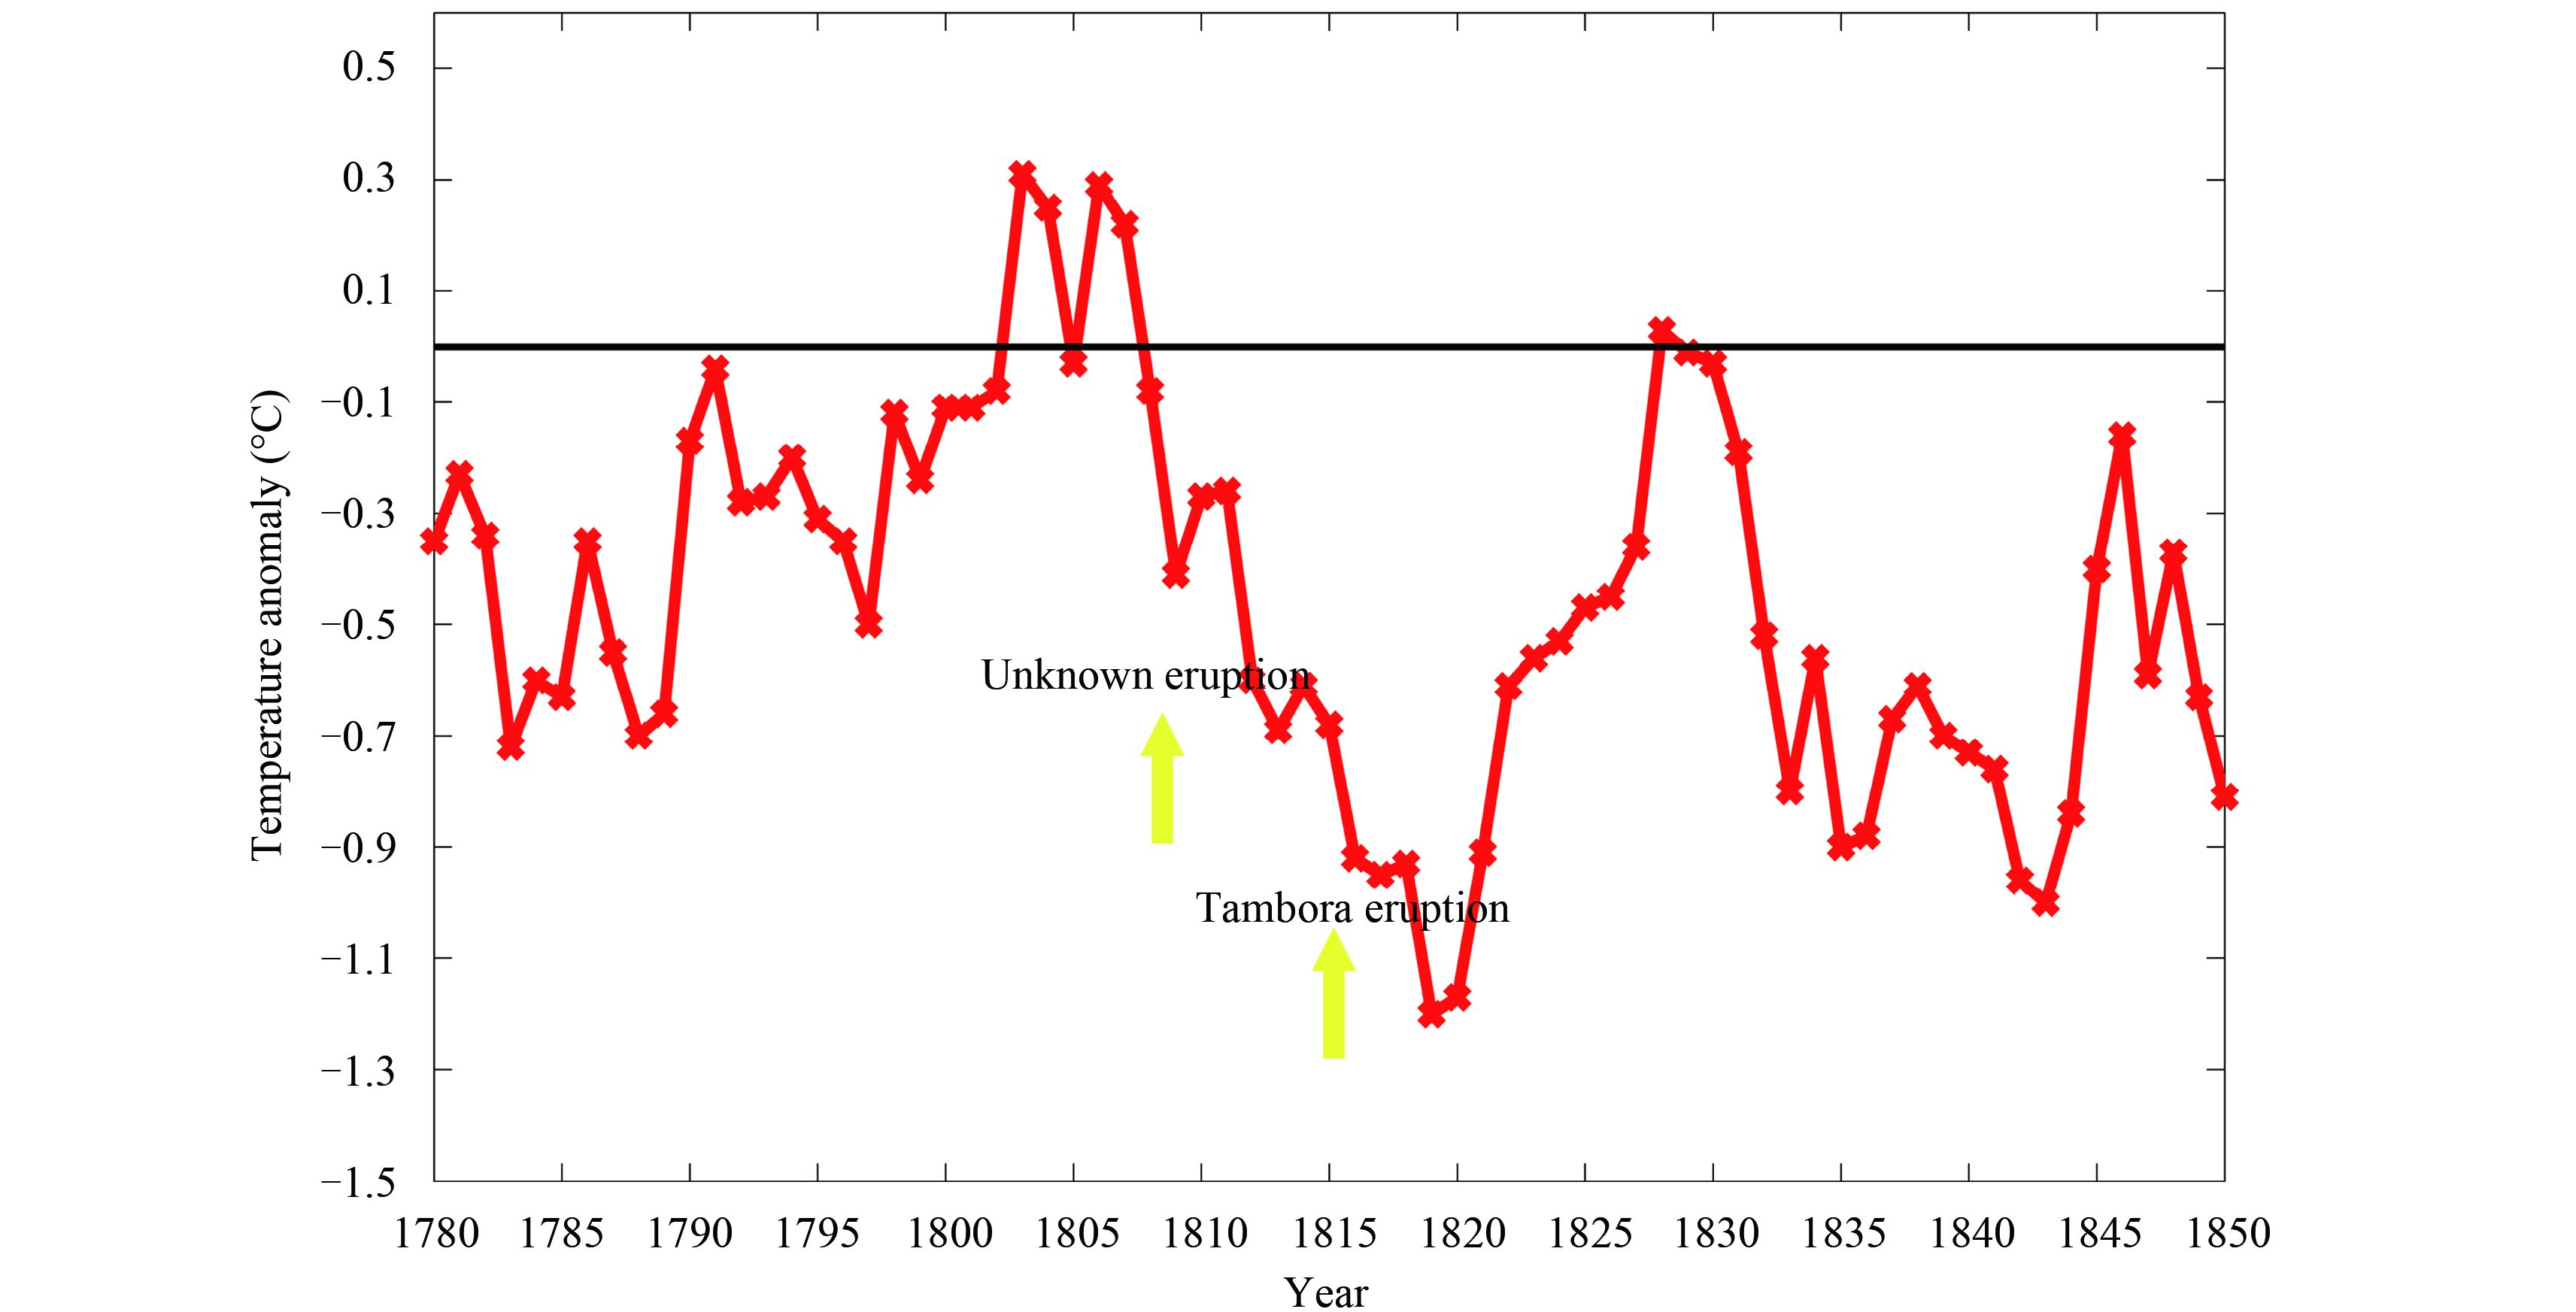
The PAGES 2K reconstruction (PAGES 2K Consortium, 2013) shows a decade-long summer cooling starting in 1811, with the temperature in Asia in 1815 being 0.68°C lower than the 1961–90 baseline, and even colder in 1819 at 1.20°C lower than the baseline (Fig. 1). This implies that Asia as a whole experienced severe cold around the time of the Tambora eruption. Lower surface temperature can reduce evaporation and suppress monsoonal circulation, due to reduced land–ocean thermal contrast (Haywood et al., 2013;Iles and Hegerl, 2014)—a hydrological consequence critical for monsoon regions like China (Schmidt and Robock, 2015). Model simulations show strong cold and dry anomalies in China following the large tropical eruptions of the last millennium (Man et al., 2014). These results point to monsoon China potentially being a region that was heavily influenced by the Tambora volcanic perturbation. However, few reports are available regarding the impact of Tambora in China, representing a missing piece of the puzzle with respect to recent efforts to provide an integrated evaluation of the global climate system's response to the Tambora eruption (Raible et al., 2016).
|
| Fig. 1 PAGES 2K summer temperature anomalies averaged over Asia (PAGES 2K Consortium, 2013) with respect to the 1961–90 reference period. |
The famine outbreak in 1815 in Yunnan—a southwestern province along the border between China and surrounding countries like Myanmar and Vietnam—is one of the few references suggesting a Tambora climate perturbation in China (Yang et al., 2005). The famine lasted for three years, from 1815 to 1817, and is known as the famous “Jiaqing Famine” in Chinese history. At the peak of this event, 29 of the 88 counties reported widespread famine (Yang et al., 2005). Residents were recorded as eating “Guanyintu” (a type of soil) out of hunger; many died from either hunger or epidemic diseases due to malnutrition, and others fled from the region. Moreover, due to the lack of documentary evidence in this remote province, the spread of famine is likely being underestimated (Yang et al., 2005). The Jiaqing Famine was the most severe famine event in Yunnan's recorded history, and was caused by the anomalously cold conditions during the crop growing season in response to the Tambora eruption. For example, the average August temperature in 1816 at Kuming (the capital city of Yunnan) was 2.5–3.0°C below normal (Yang et al., 2005).
Previous studies on representative eruptions, such as the prolonged Eldgjá eruption (Fei and Zhou, 2015) or the 626 unknown eruption (Fei et al., 2007), using documentary records, suggest massive climatic and social consequences in ancient China. However, to the best of the authors' knowledge, no systematic analysis on the impacts of the Tambora eruption in China has been carried out. Important questions remain unanswered, such as: Was the climatic aftermath of the Tambora eruption any different from other eruptions? Is the lack of reports on Tambora's impact in China a result of mild climate responses, or a limited archive of relevant information?
The aim of the present study is to answer these questions by conducting an integrated analysis using two independent lines of records: tree-ring-based temperature and precipitation reconstructions, and documentary-evidence-based climate and social disaster records. Following this introduction, Section 2 presents the data and methods used in the study. Section 3 reports the temperature and hydrological responses to the Tambora perturbation, reveals from both proxy and documentary reconstructions, and discusses the sociological consequences in various parts of China. Section 4 summarizes the results and makes suggestions for future research.
2 Data and methods 2.1 Tree-ring based temperature and moisture indicesWe used the PAGES 2K gridded summer temperature reconstruction for East Asia (Cook et al., 2013) to study the temperature response to the Tambora volcanic perturbation. This index was reconstructed based on a network of 422 annual tree-ring chronologies, among which over 200 chronologies begin in or before the 17th century, and was calibrated with the CRU TS 3.1 summer temperatures over the monsoon Asian domain using the point-by-point regression method. The index is available at a resolution of 2° × 2° for the area of 10°S–54°N, 60°–148°E. Validation tests indicate that the reconstruction has a credible level of skill at high-frequency temperature variation. Superposed epoch analysis using the explosive volcanism of the last millennium reveals a significant cooling response (Cook et al., 2013), therefore providing a reliable reference to evaluate the temperature response after the Tambora perturbation.
The first moisture index used was the Monsoon Asia Drought Atlas (MADA)—an annually resolved spatiotemporal reconstruction of the spring to summer drought from 1300 to 2005 (Cook et al., 2010). The index was reconstructed by using a network of 327 hydroclimatically sensitive tree-ring chronologies from the forested areas of monsoon Asia and calibrated with the well-known Palmer Drought Severity Index (PDSI) reconstruction (Dai et al., 2004). Like PDSI, the index is available at a regular grid resolution of 2.5°. The positive and negative values represent wet and dry conditions, respectively; the development of drought is indicated when the MADA values fall below –0.5. The index thus provides a well-dated and long-term hydroclimate record for monsoonal Asia in the region (8.75°S–56.25°N, 61.25°–143.75°E).
2.2 Multiproxy warm season precipitation indexSince very limited tree-ring chronologies in Chinese mainland were used in the reconstruction of MADA, it may not fully and accurately represent the actual hydroclimatic conditions in the region. Therefore, we also used a multiproxy boreal warm season (May–September) precipitation reconstruction (Feng et al., 2013) as an independent moisture index (hereafter referred to as the Feng 2013 reconstruction). The reconstruction was based on 284 tree-ring chronologies, historical documentary records, and ice-core records, distributed broadly across various parts of East Asia, and was calibrated with monthly instrumental data (Legates and Willmott, 1990) over the period 1950–99. The index is available at a high resolution of 0.5° × 0.5°, and its verification with the observation for the period 1930–49 shows that the index is skillful in revealing moisture conditions, especially over the humid areas of eastern China (Feng et al., 2013).
2.3 Chinese historical documentationBesides proxy reconstructions, we also incorporated historical records of meteorological disasters extracted from A Compendium of Chinese Meteorological Records of the Last 3000 Years (Zhang, 2004). This is a serial book compiled from the most comprehensive collection of official documents, including state, provincial, and county annals, as well as local chronicles. For the period 1368–1911, the records are precise to the county level, therefore allowing the time series reconstruction of events, but also the associated spatial patterns. The strict recording standards and compilation procedures adopted in these annals help to minimize the uncertainties inherent in many documentary reconstructions (Zhang, 2004).
For each type of disaster, we digitized the documentary records by first counting the number of disaster events for the counties, then adding up the frequency within each province and using the aggregated results for the spatiotemporal analysis. For example, in counting the number of drought events, a verbal record of “drought” or “no rain from month x to month y” was counted as one recorded event for that province. Following the definition of McKee et al. (1993), we defined a drought event as being a period of no rain lasting for more than three months. For flooding, if a verbal record of “big water” or “flood” appeared in more than one county within a province, and caused severe damage like “flooded more than half of the houses” or “destroyed the XX riverbank”, we counted it as one event. For frost damage, a verbal record of “frost in August, hurt crops” or something similar was counted as one event. For famine, because this can be caused by socioeconomic factors other than climate, only verbal records of “big famine” following some weather description like “drought lasted several years” was counted as one event. The use of the same resource and uniform counting criterion limits the uncertainty that otherwise may be encountered when using different data sources and methodologies.
2.4 Superposed epoch analysisTo test the statistical significance of the hydroclimatic responses of the Tambora perturbation in China, we conducted a superposed epoch analysis (SEA;Adam et al., 2003) for the 23 tropical eruptions of the past seven centuries, and then projected the responses after the Tambora perturbation on top of the SEA results. The histories of the 23 tropical eruptions were extracted from the newly published global volcanism reconstructions by Sigl et al. (2015).
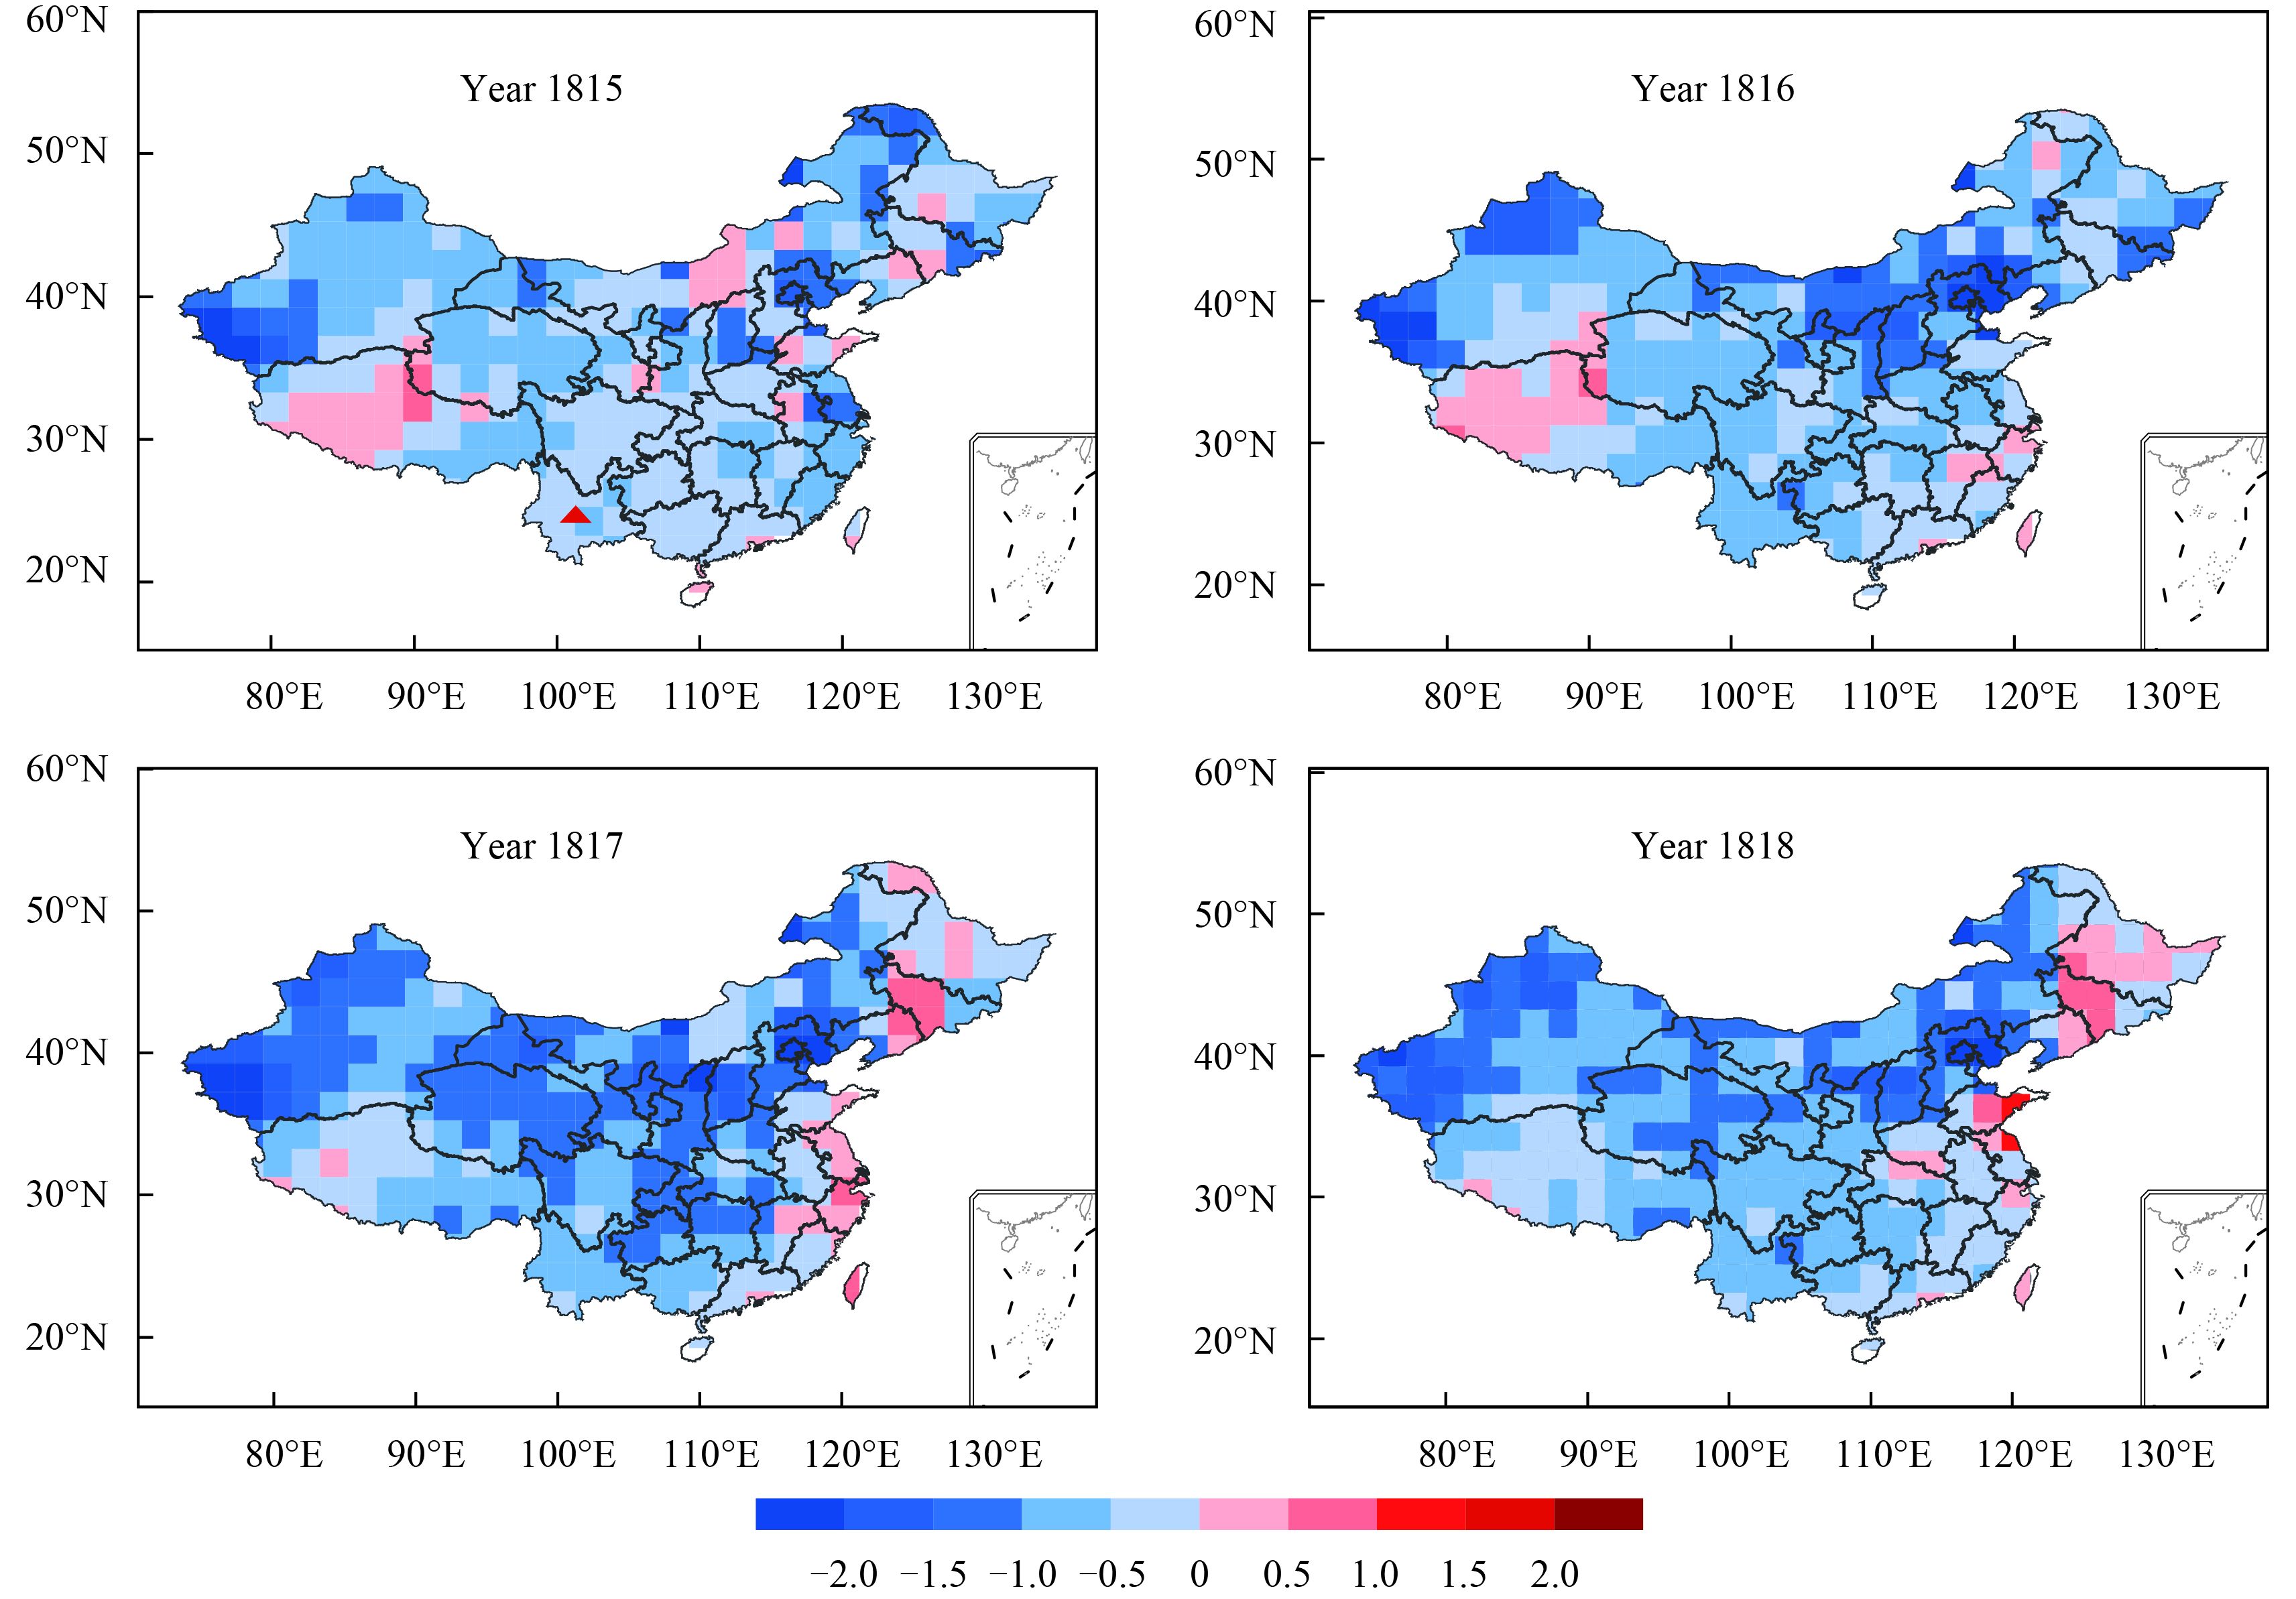
3 Results and discussion 3.1 Temperature responsesAverage temperature in Asia experienced a decadal long summer cooling in the 1810s, with peak temperature being 1.20°C lower in 1819 than the 1961–90 baseline (Fig. 1). In China, cooling anomalies with amplitudes of up to –2°C occurred almost everywhere except for central Tibet and parts of eastern China, and were more pronounced in northern and central China than southern and coastal regions (Fig. 2). These spatial patterns are in close agreement with the observations after the 1963 Agung, 1982 El Chichón, and 1991 Pinatubo eruptions (Man et al., 2014;Fig. 3). The maximum cooling occurred in 1817, echoing the 2-yr lag of the terrestrial temperature response to maximum aerosol optical depth suggested by modeling studies of the global surface air temperature response (Raible et al., 2016).
|
| Fig. 2 Spatial distributions of the temperature response to the 1815 Tambora eruption. Plotted is the boreal summer temperature variation from the climatology of the first half of the 19th century, using the PAGES 2K gridded reconstruction for East Asia (Cook et al., 2013). Due to the 1809 unknown, 1815 Tambora, and 1835 unknown eruptions, the values for 1809–19 and 1835–39 are excluded from the climatology. The red triangle marks Yunnan Province, where the Jiaqing Famine was notoriously reported. |
|
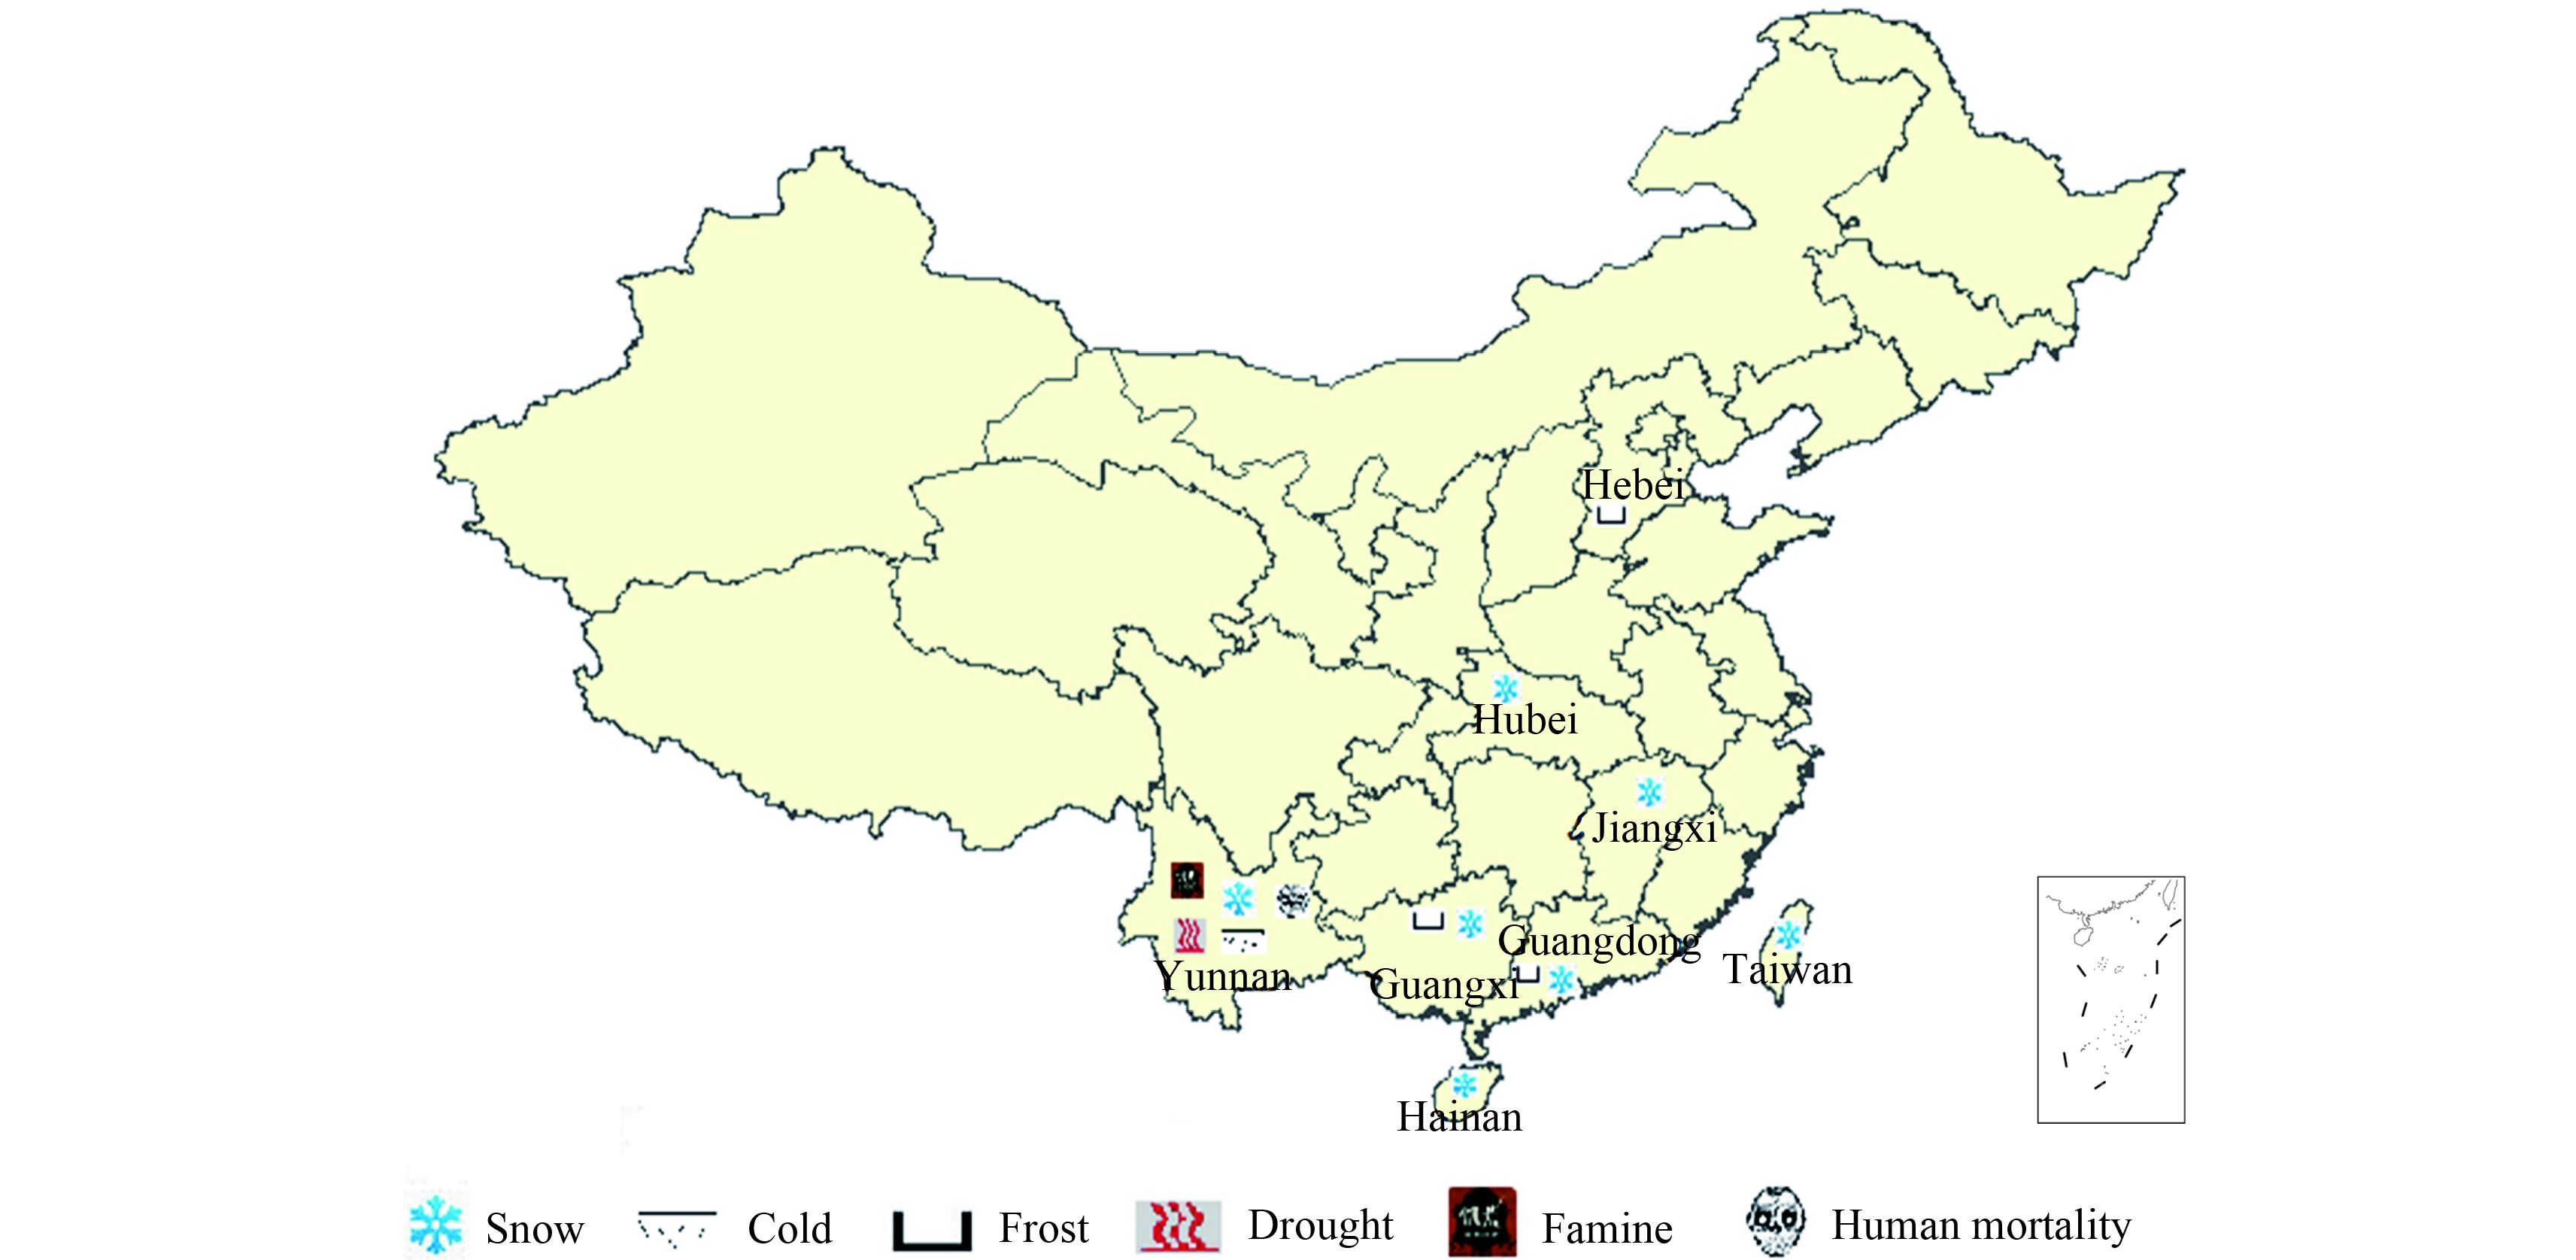
| Fig. 3 Locations of the reported extreme weather and social events in China during 1815–16. The historical disaster records were extracted from the serial book (Zhang, 2004). |
Complementary to the tree-ring based records, severe cold and snow storms were reported in 1815 and 1816 across southern China in the historical documents compiled in Zhang (2004). For example, in September 1815, frost damage was recorded in parts of Hebei Province (approximately 37°–42°N;Fig. 3). Three months later, not only did snow occur in the southern provinces of Hainan (approximately 18°–20°N), Taiwan (approximately 22°–25°N), Guangdong (approximately 22°–25°N), and Guangxi (approximately 22°–25°N), all of which rarely see any snow, even in winter months, but snow also accumulated to a level reaching 70 cm in Guangxi, and ice more than 3-cm thick was recorded in Taiwan (Table 1). In parts of Jiangxi—a province farther north (approximately 22°–25°N)—heavy snow accumulated to several Chi (1 Chi = 33.3 cm) and lasted throughout the winter of 1816, causing severe crop damage and cattle mortality. Outside southern China, weather related disasters were rarely recorded, according to the available documentary evidence, suggesting the possibility of a spatially restrained climatic stress after the Tambora perturbation.
| Date (year) | Event categories | Paraphrased summary, with months/seasons and locations/extents* |
| 1815 | Frost; abnormal snow; famine; human mortality, famine, plague | Month 8 (3 Sep to 2 Oct), frost damage in parts of Hebei; month 9, cold-damaged crops leading to famine in Yunnan. Months 11 and 12 (1 Nov to 28 Jan 1816), snow in parts of Hainan, Taiwan, Hubei, and Guangxi; ice more than 3 cm thick found in Taiwan; snow accumulated to around 70 cm in Guangxi. Winter, heavy snow in Guangdong; severe frost damaged half of the trees in Guangdong and almost all the trees in Guangxi. Widespread plague in Shandong and Henan, “only 1–2 out of 100 are not infected”, and “crops left un-harvested”. |
| 1816 | Abnormal snow; famine; human mortality, famine | Month 2 (28 Feb to 28 Mar), heavy snow accumulated to several Chi (1 Chi=33.3 cm) in parts of Jiangxi, killed crops and cattle. Month 7 (23 Aug to 20 Sep), rain and snow in parts of Yunnan; drought and cold leading to severe famine and human mortality in Yunnan. |
| 1817 | Drought; frost | Fall, drought in parts of Shandong, Jiangsu, and Hebei. Month 8 (11 Sep to 10 Oct), frost damage in parts of Hebei. |
| 1820 | Flooding | Flooding in parts of Hebei and Henan, months unspecified. |
| *Event locations/extents are provided according to present-day names. Because of complex textual histories, and/or ambiguity in the descriptions, the locations/extents of some events are indicative (e.g., events are not necessarily restricted to locations described or inferred). Specific event dates (if given) are provided in the Chinese Lunar (lunisolar) Calendar, and where pertinent have been converted to the Julian calendar (see date information in brackets), and reflected in the “Date (year)” column. | ||
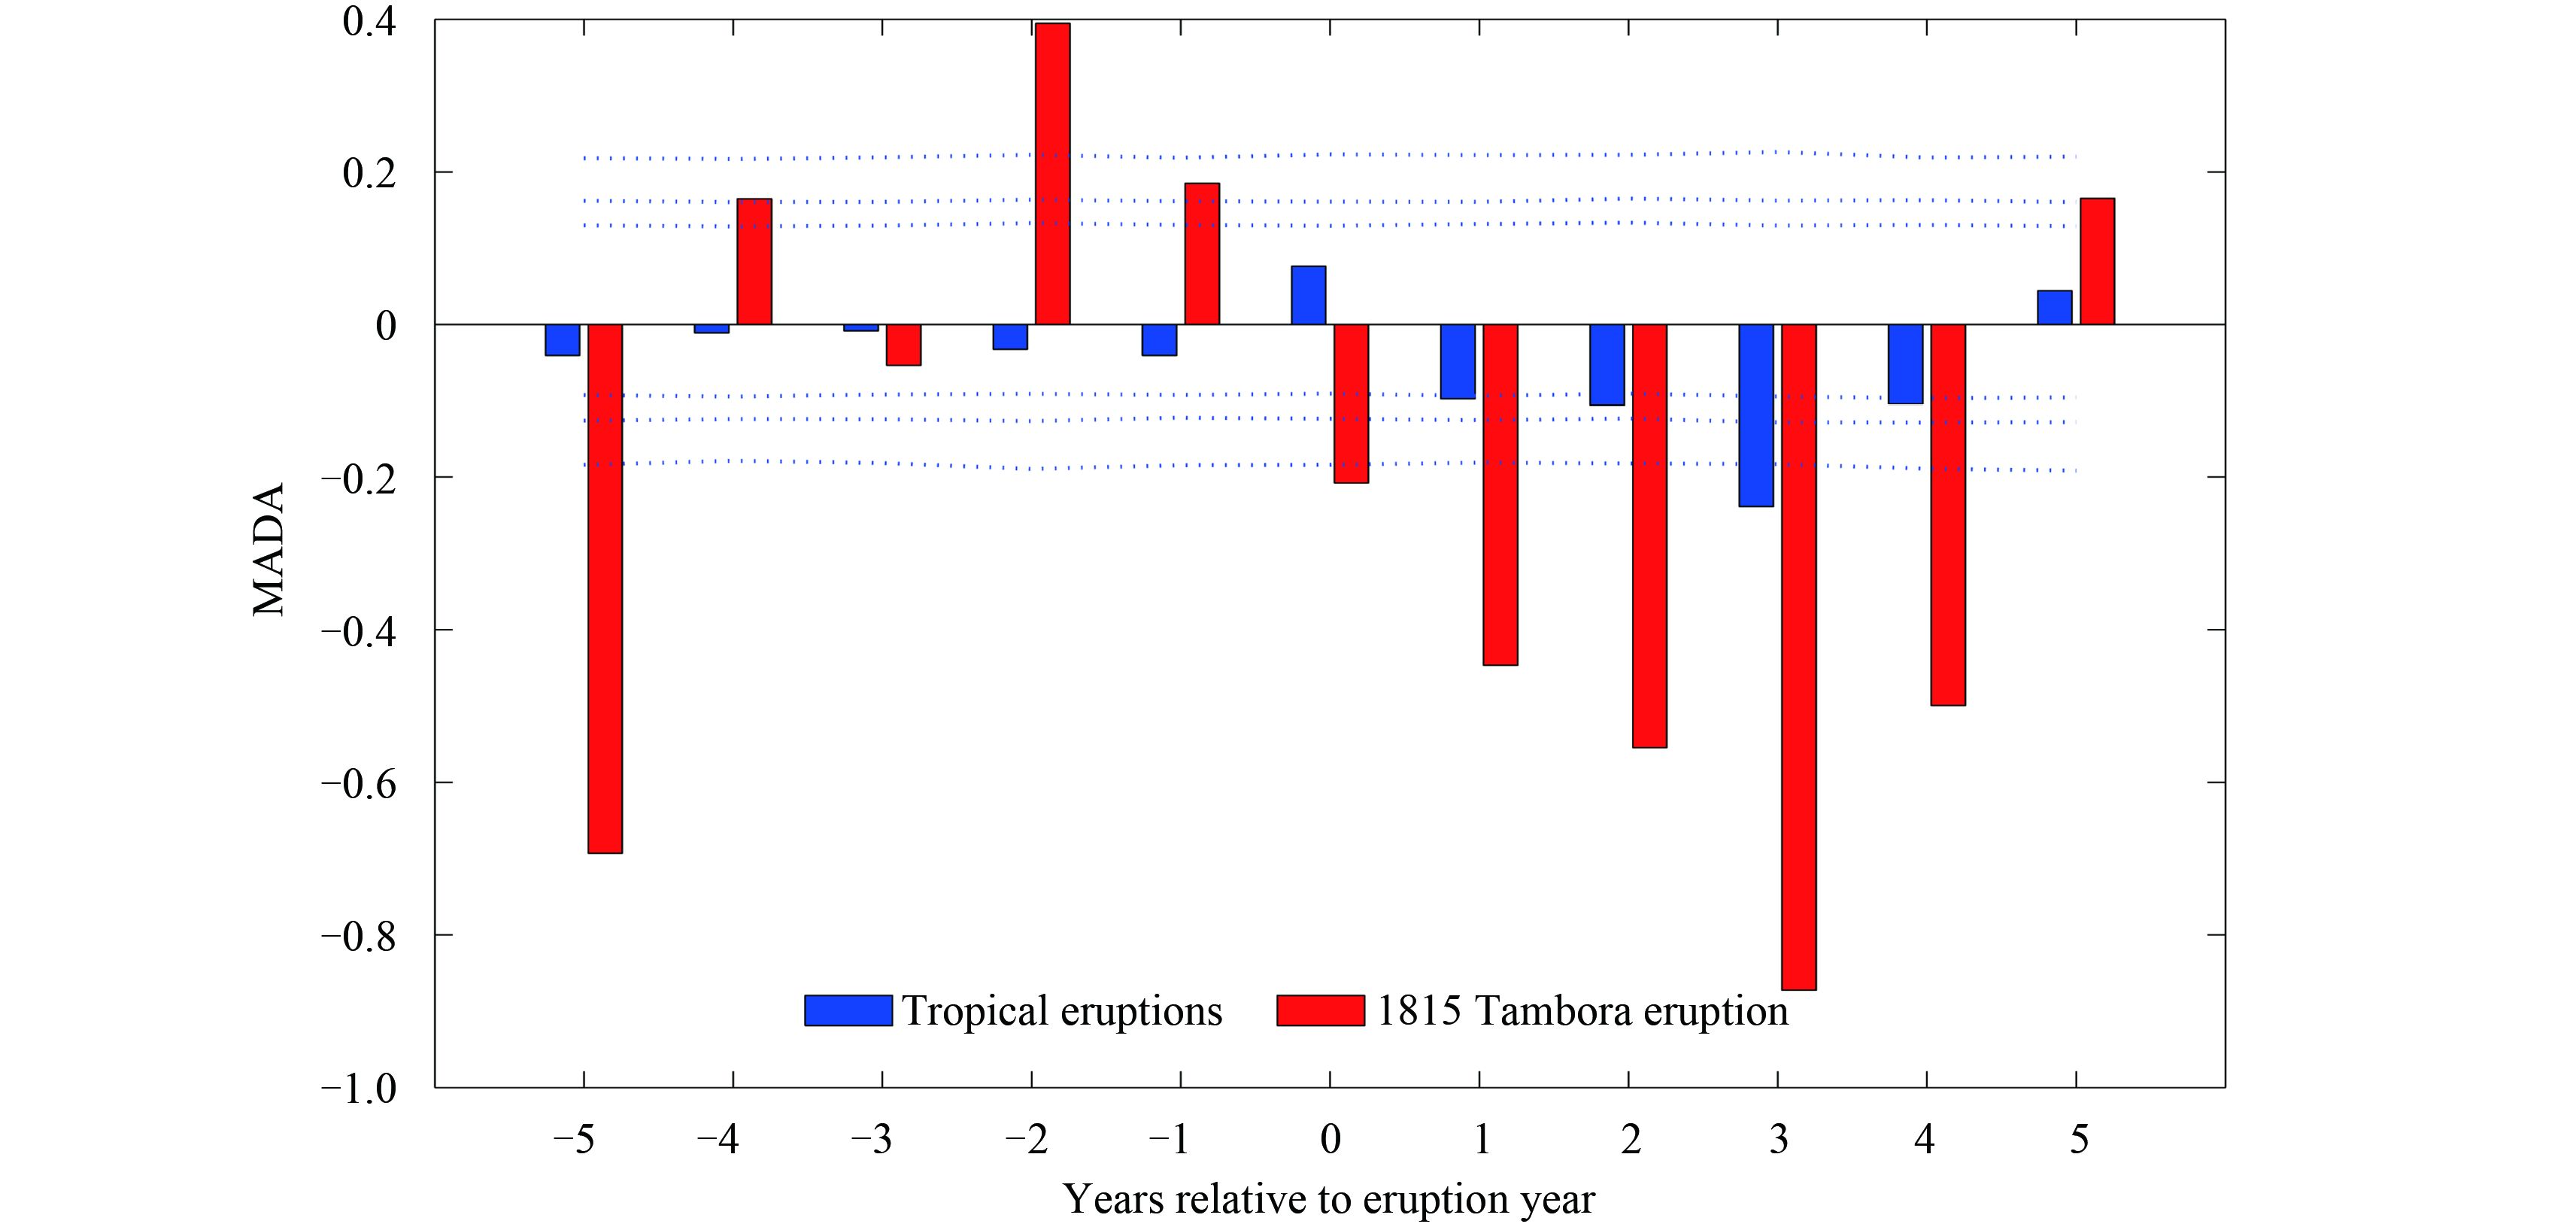
Tropical volcanic eruptions are found, both in observations and model simulations, to suppress summer monsoon precipitation (Peng et al., 2010;Man et al., 2014;Zhuo et al., 2014). Using the tree-ring-based MADA reconstruction, we found a significant drying trend immediately following the Tambora eruption, and the drought lasted for 5 yr until 1819 (Fig. 4). When projecting this drying tendency on top of the SEA response after the 23 tropical eruptions of the past seven centuries, we observed that the Tambora impact was much more serious than the average responses.
|
| Fig. 4 Hydroclimatic response to the 1815 Tambora eruption in China (red bars), as revealed from the MADA (Monsoon Asia Drought Atlas) reconstruction. The SEA (superposed epoch analysis) values of all tropical volcanic eruptions over the past seven centuries (blue bars) and the corresponding 90%, 95%, and 99% confidence levels (dotted blue curves) are also plotted as references for easy comparison. |
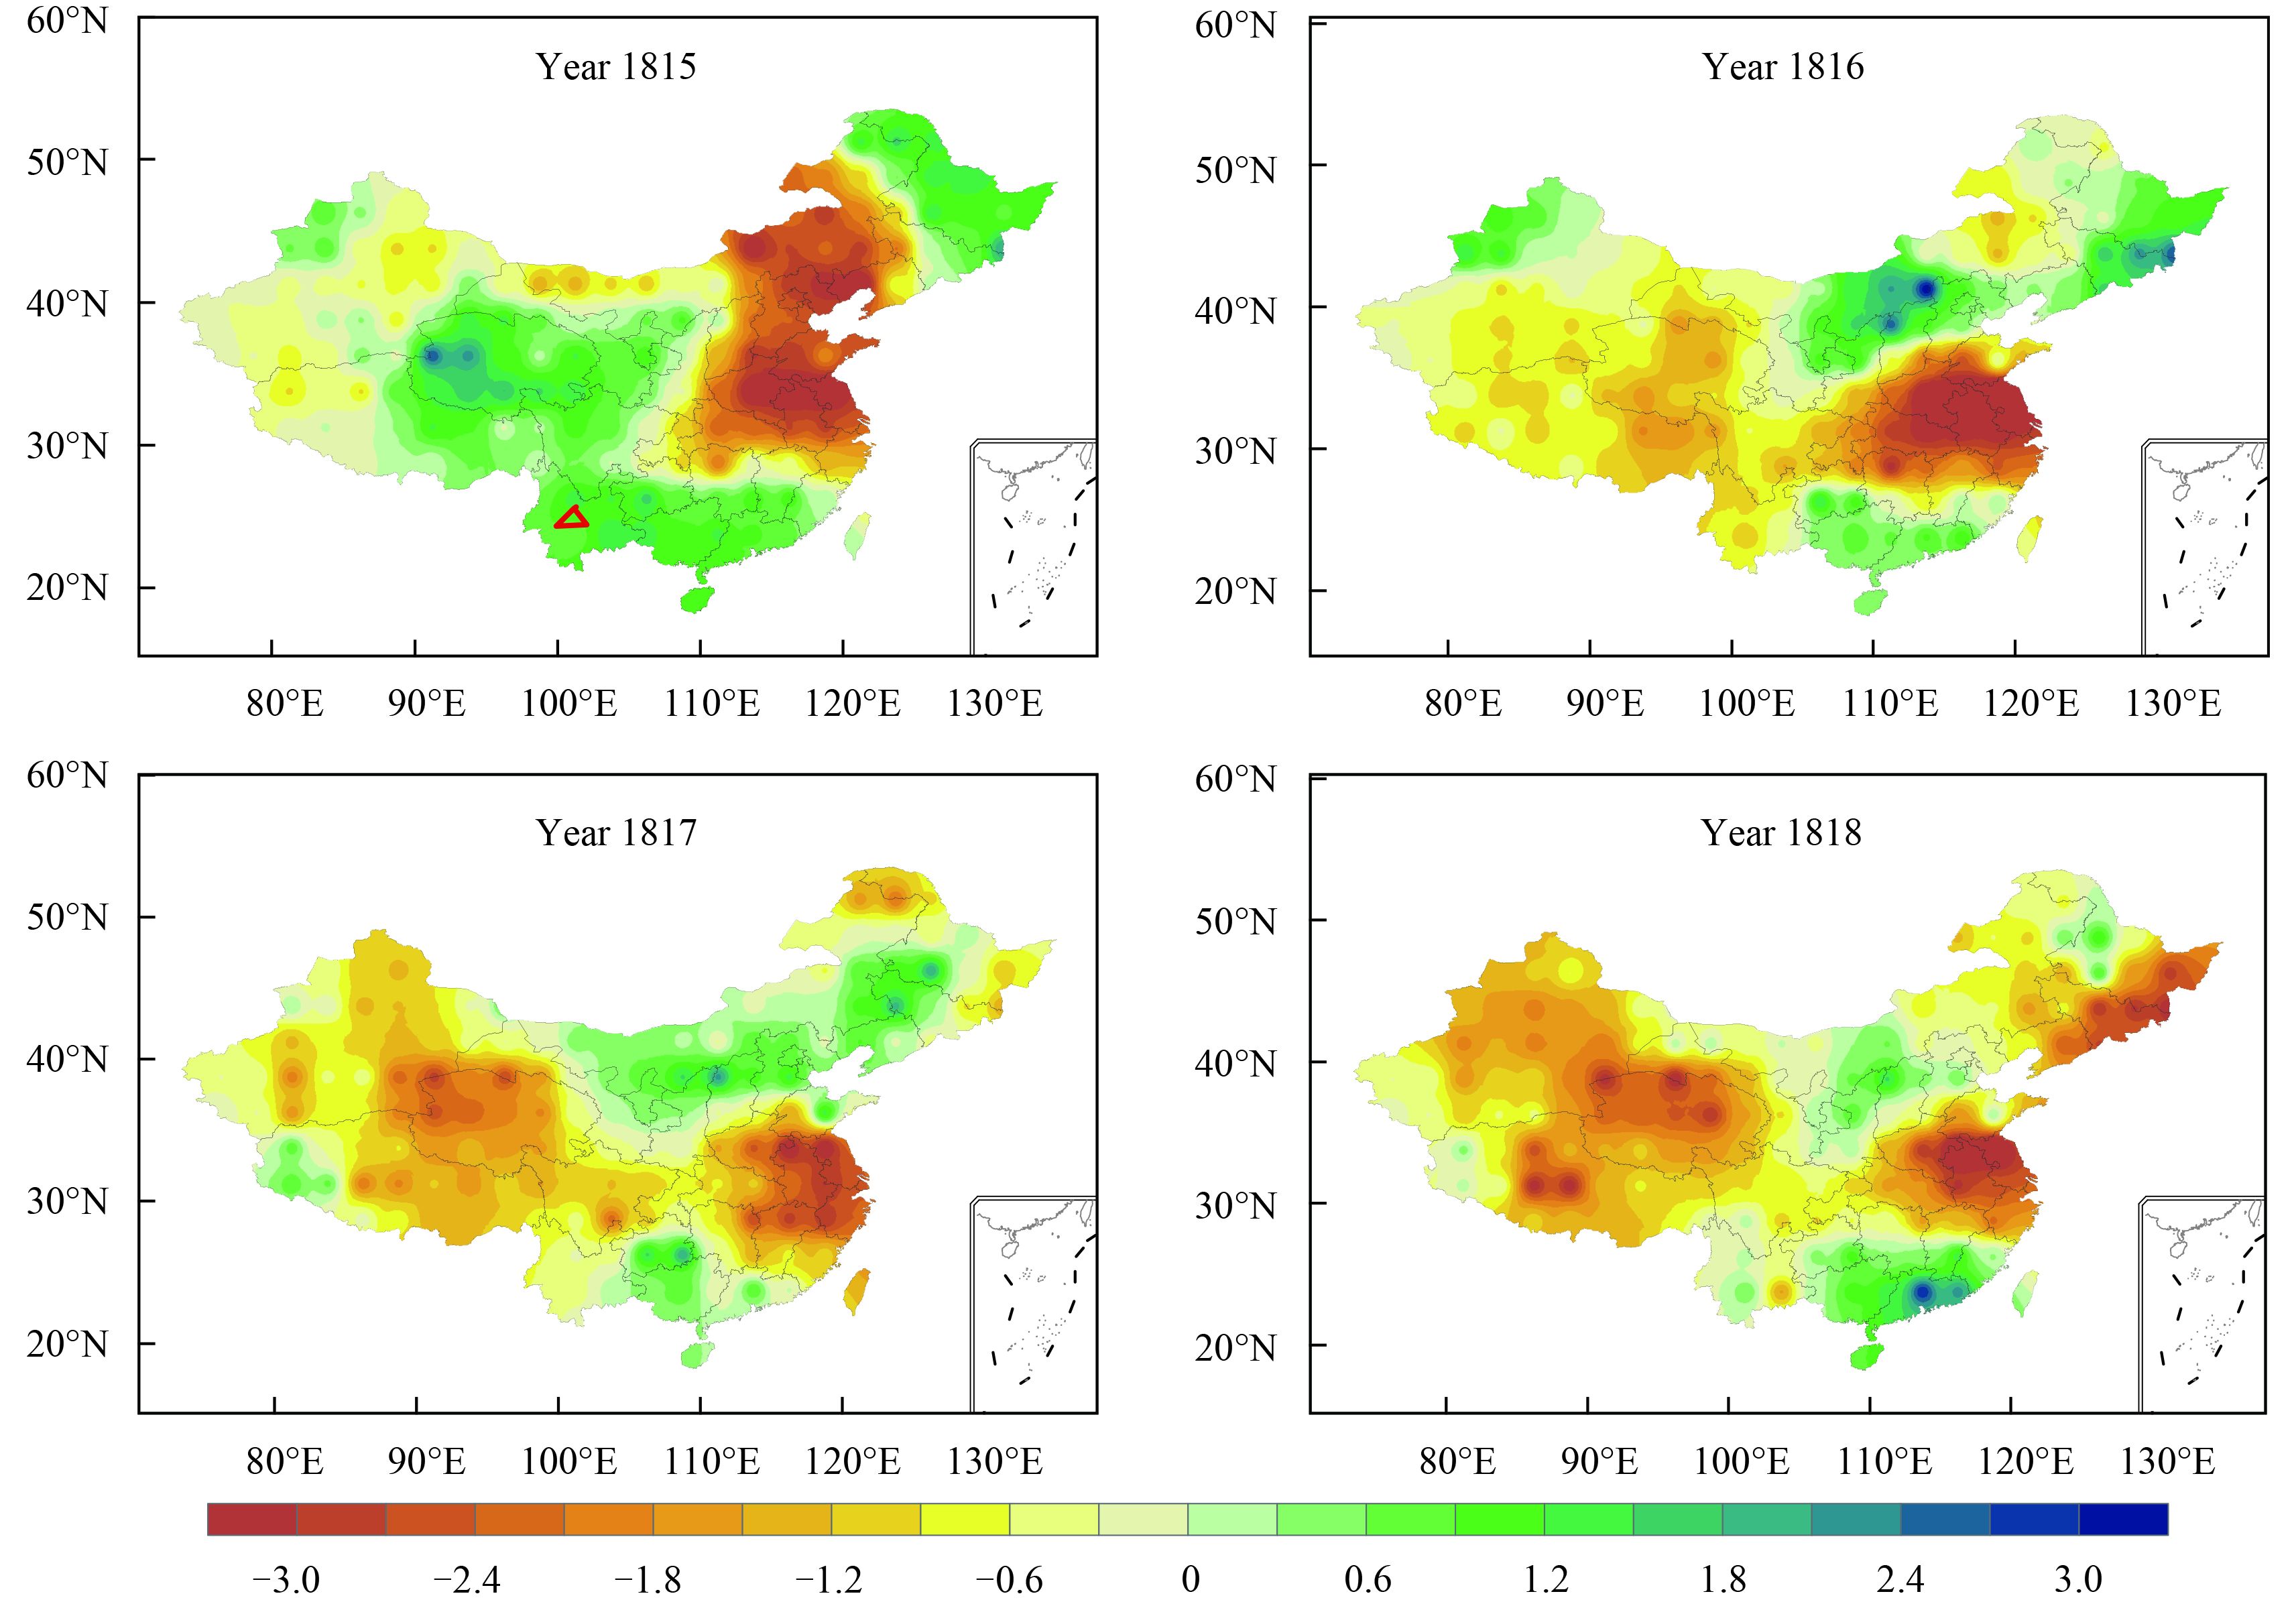
Spatially, the MADA reconstruction suggests that drought first developed in northeastern and eastern China during the year of eruption and propagated to central and western China in the first and second post-eruption years (hereafter referred to as years 1 and 2;Fig. 5). Dry conditions were especially pronounced in the eastern provinces, such as Jiangsu, Zhejiang, Anhui, and parts of Jiangxi, Henan, and Hubei, which remained significant throughout the 5-yr study period. In contrast, the climatologically dry area of central China turned wet in the first summer following the eruption, before gradually drying up. Southern China stayed relative wet, with Yunnan and Fujian provinces experiencing some drought in 1816 and 1817. The results agree well with the model-simulated first summer precipitation response after the large volcanic eruptions of the last millennium (Man et al., 2014), suggesting reduced land–sea thermal contrast and therefore a weaker monsoon circulation as the cause of the observed drought response.
|
| Fig. 5 Spatial distributions of the MADA-represented boreal summer moisture variation from the climatology of the first half of the 19th century. Due to the 1809 unknown, 1815 Tambora, and 1835 unknown eruptions, the values for 1809–19 and 1835–39 are excluded from the climatology. |
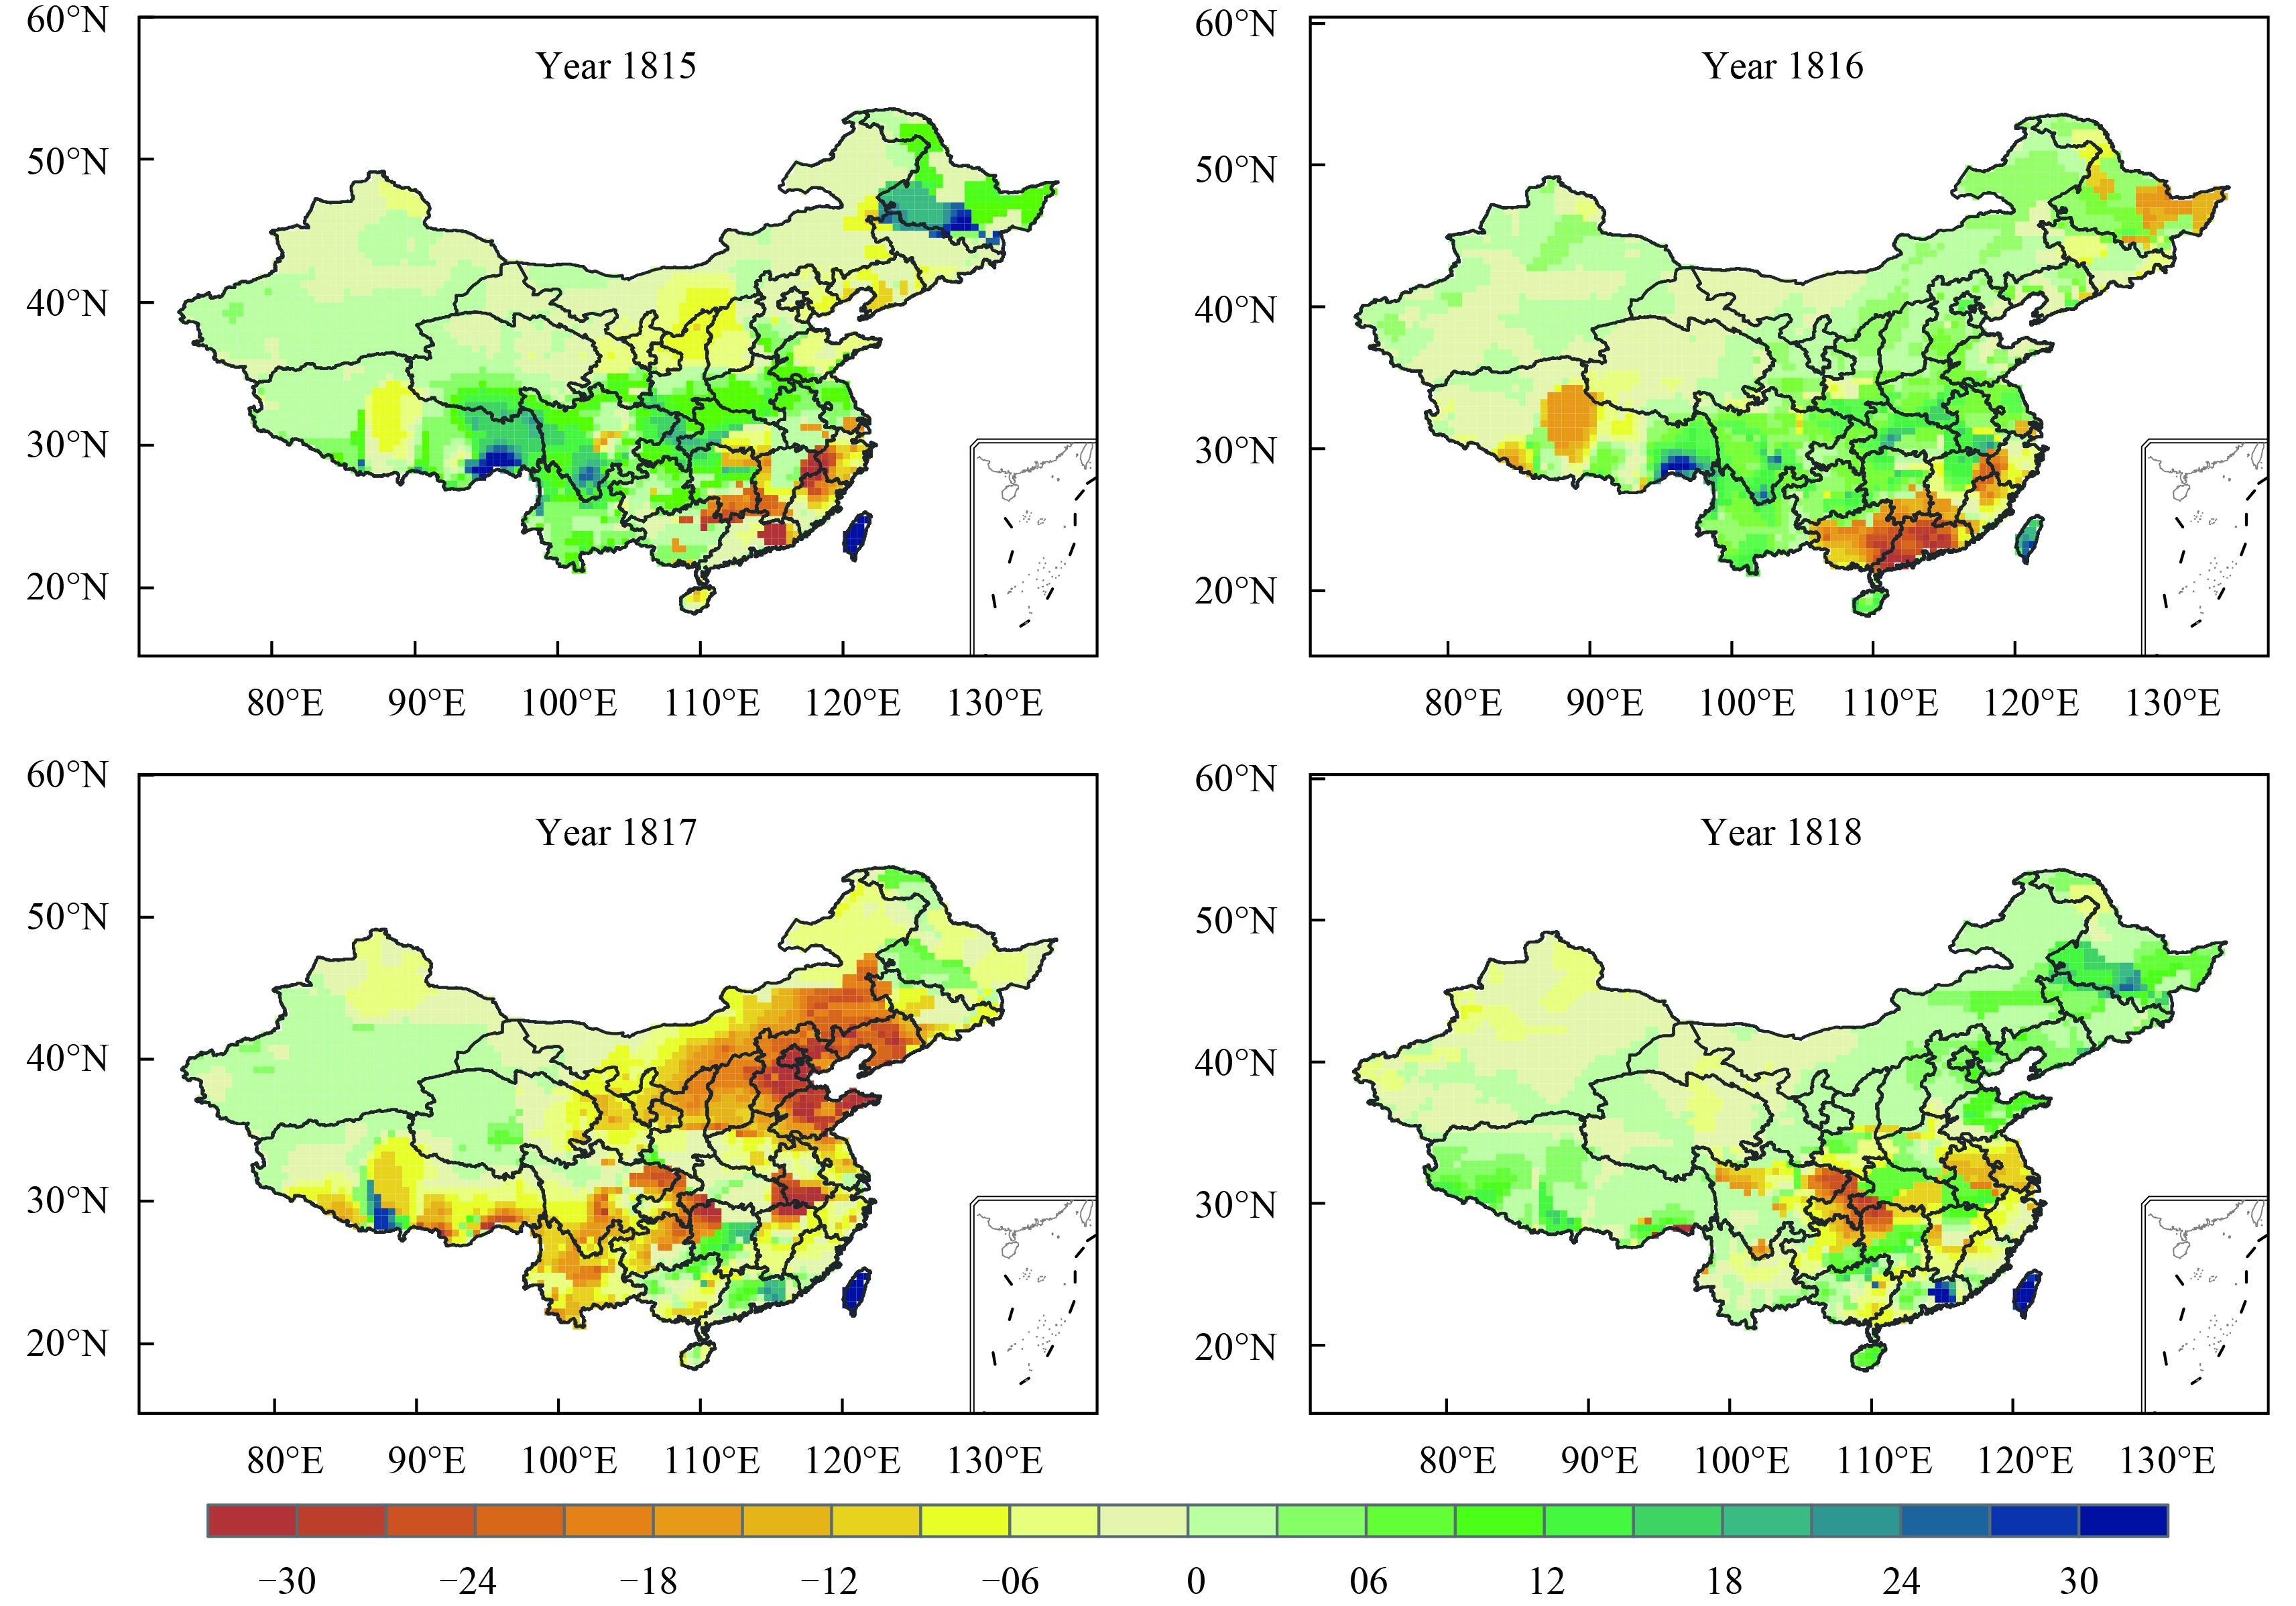
The Feng 2013 reconstruction suggests an overall drying tendency in 1817, in line with the maximum temperature response. Spatially, this reconstruction suggests reduced precipitation in northern and southeastern China, while increased rainfall over the Yangtze River valley region for the first summer after the eruption (Fig. 6). This meridional tripolar pattern is in general agreement with the observations after the 1982 El Chichón eruption (Man et al., 2014;Fig. 4c). In the summer of 1817, a drying response took over the majority of the country, with drought centered in northeastern and southwestern China.
|
| Fig. 6 Spatial distributions of the May–September total precipitation variation (mm) from the climatology of the first half of the 19th century, using the Feng 2013 reconstruction. |
Comparing Figs. 5 and 6, we see substantial differences in the regional hydroclimate responses. No evidence is available in this study to conclude which of the above patterns is more reliable, except for noticing that the Feng 2013 reconstruction is composed of more data from the monsoonal Chinese regions. Model simulations suggest that, by reducing surface temperature, volcanic aerosols tend to suppress both the evaporation (and thus the moisture source) and the land–sea thermal contrast (and thus the moisture transport to the terrestrial monsoon regions). To test whether there was a deficiency in moisture availability after the Tambora eruption, we compared the summer cloud cover response to Tambora and all tropical eruptions in 1780–2005 using a tree-ring-based cloud cover reconstruction in the Southeast Tibetan Plateau (Shi et al., 2012). This index is based upon the empirical relationship between the CRU's cloud data and the tree ring cellulose δ18O reconstruction, and reflects the regional summer moisture variability of the past 225 years. The SEA results show a substantial reduction in summer cloud cover (at the 90% confidence level) in years 2 and 3 following all tropical eruptions, suggesting a non-random response of moisture variability to tropical volcanic perturbation. In comparison, the cloud cover after the Tambora eruption fell far below the 99% confidence level of the SEA results for all tropical eruptions. In Shi's reconstruction, the cloud cover of 1807 to 1817 was the lowest in the entire 225-yr period, indicating a great deficiency in moisture availability caused by the dual effects of the 1809 unknown and Tambora volcanic perturbations, on top of the lower solar insolation during the Dalton Minimum.
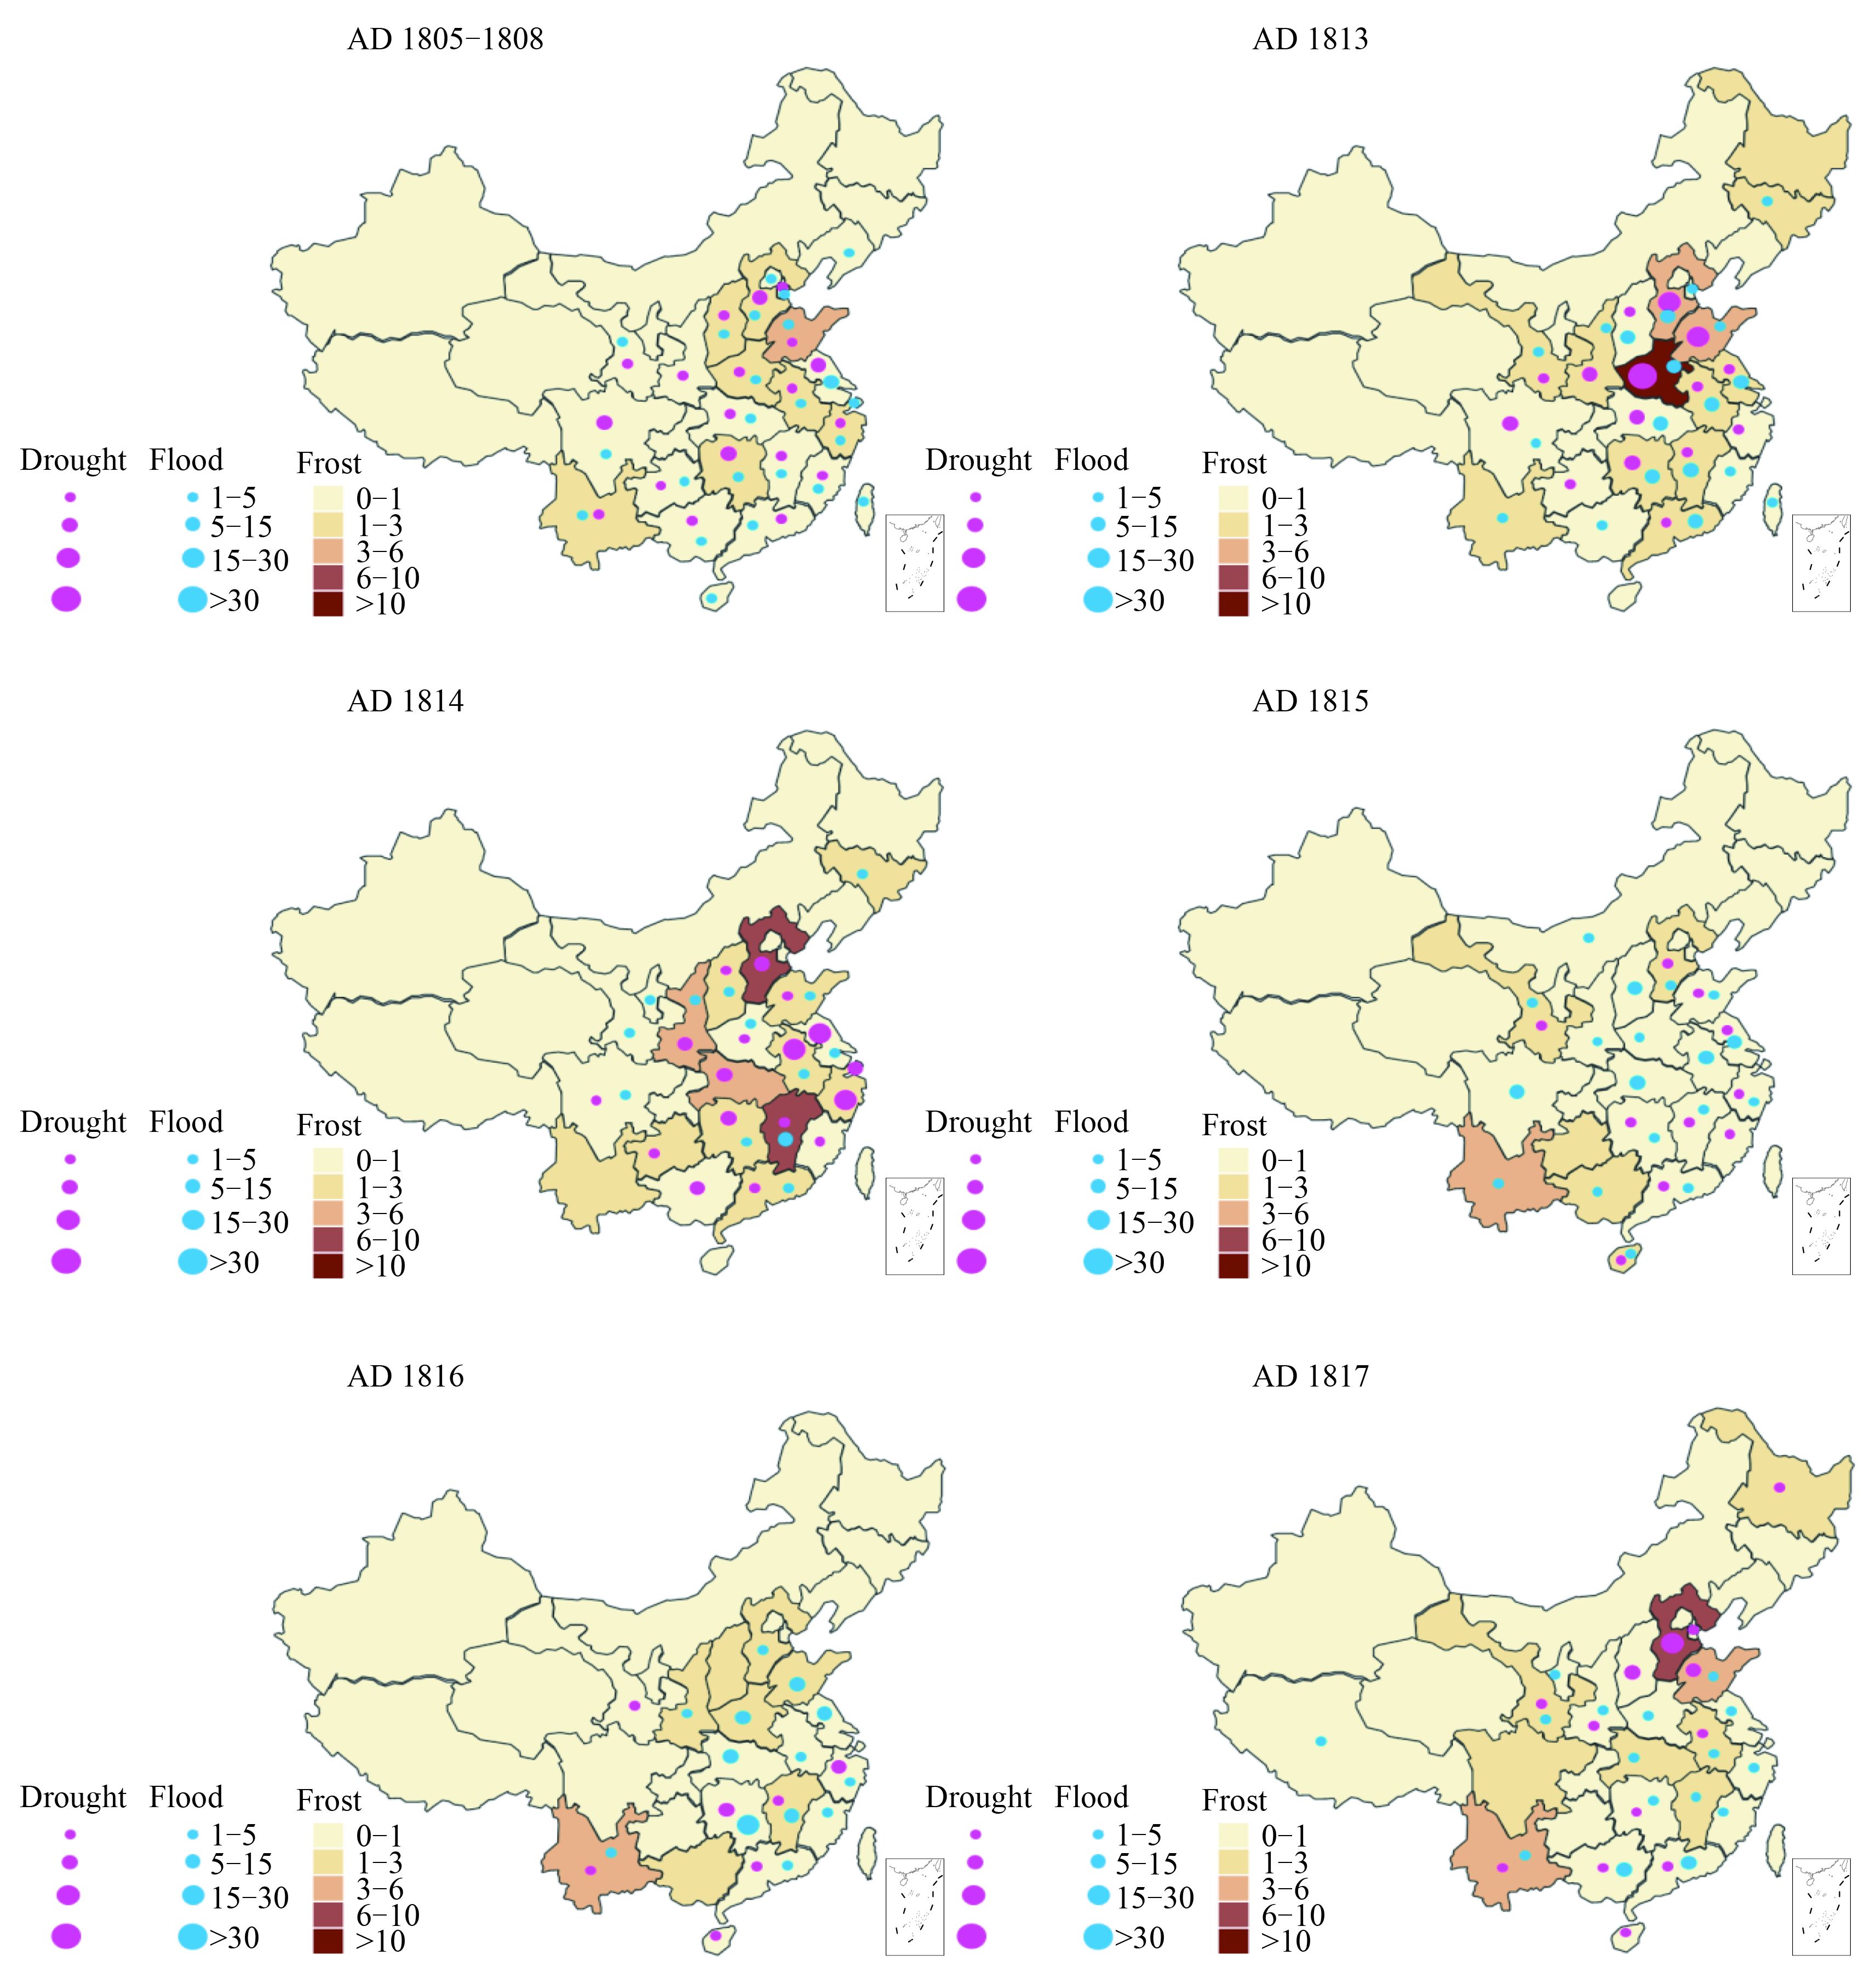
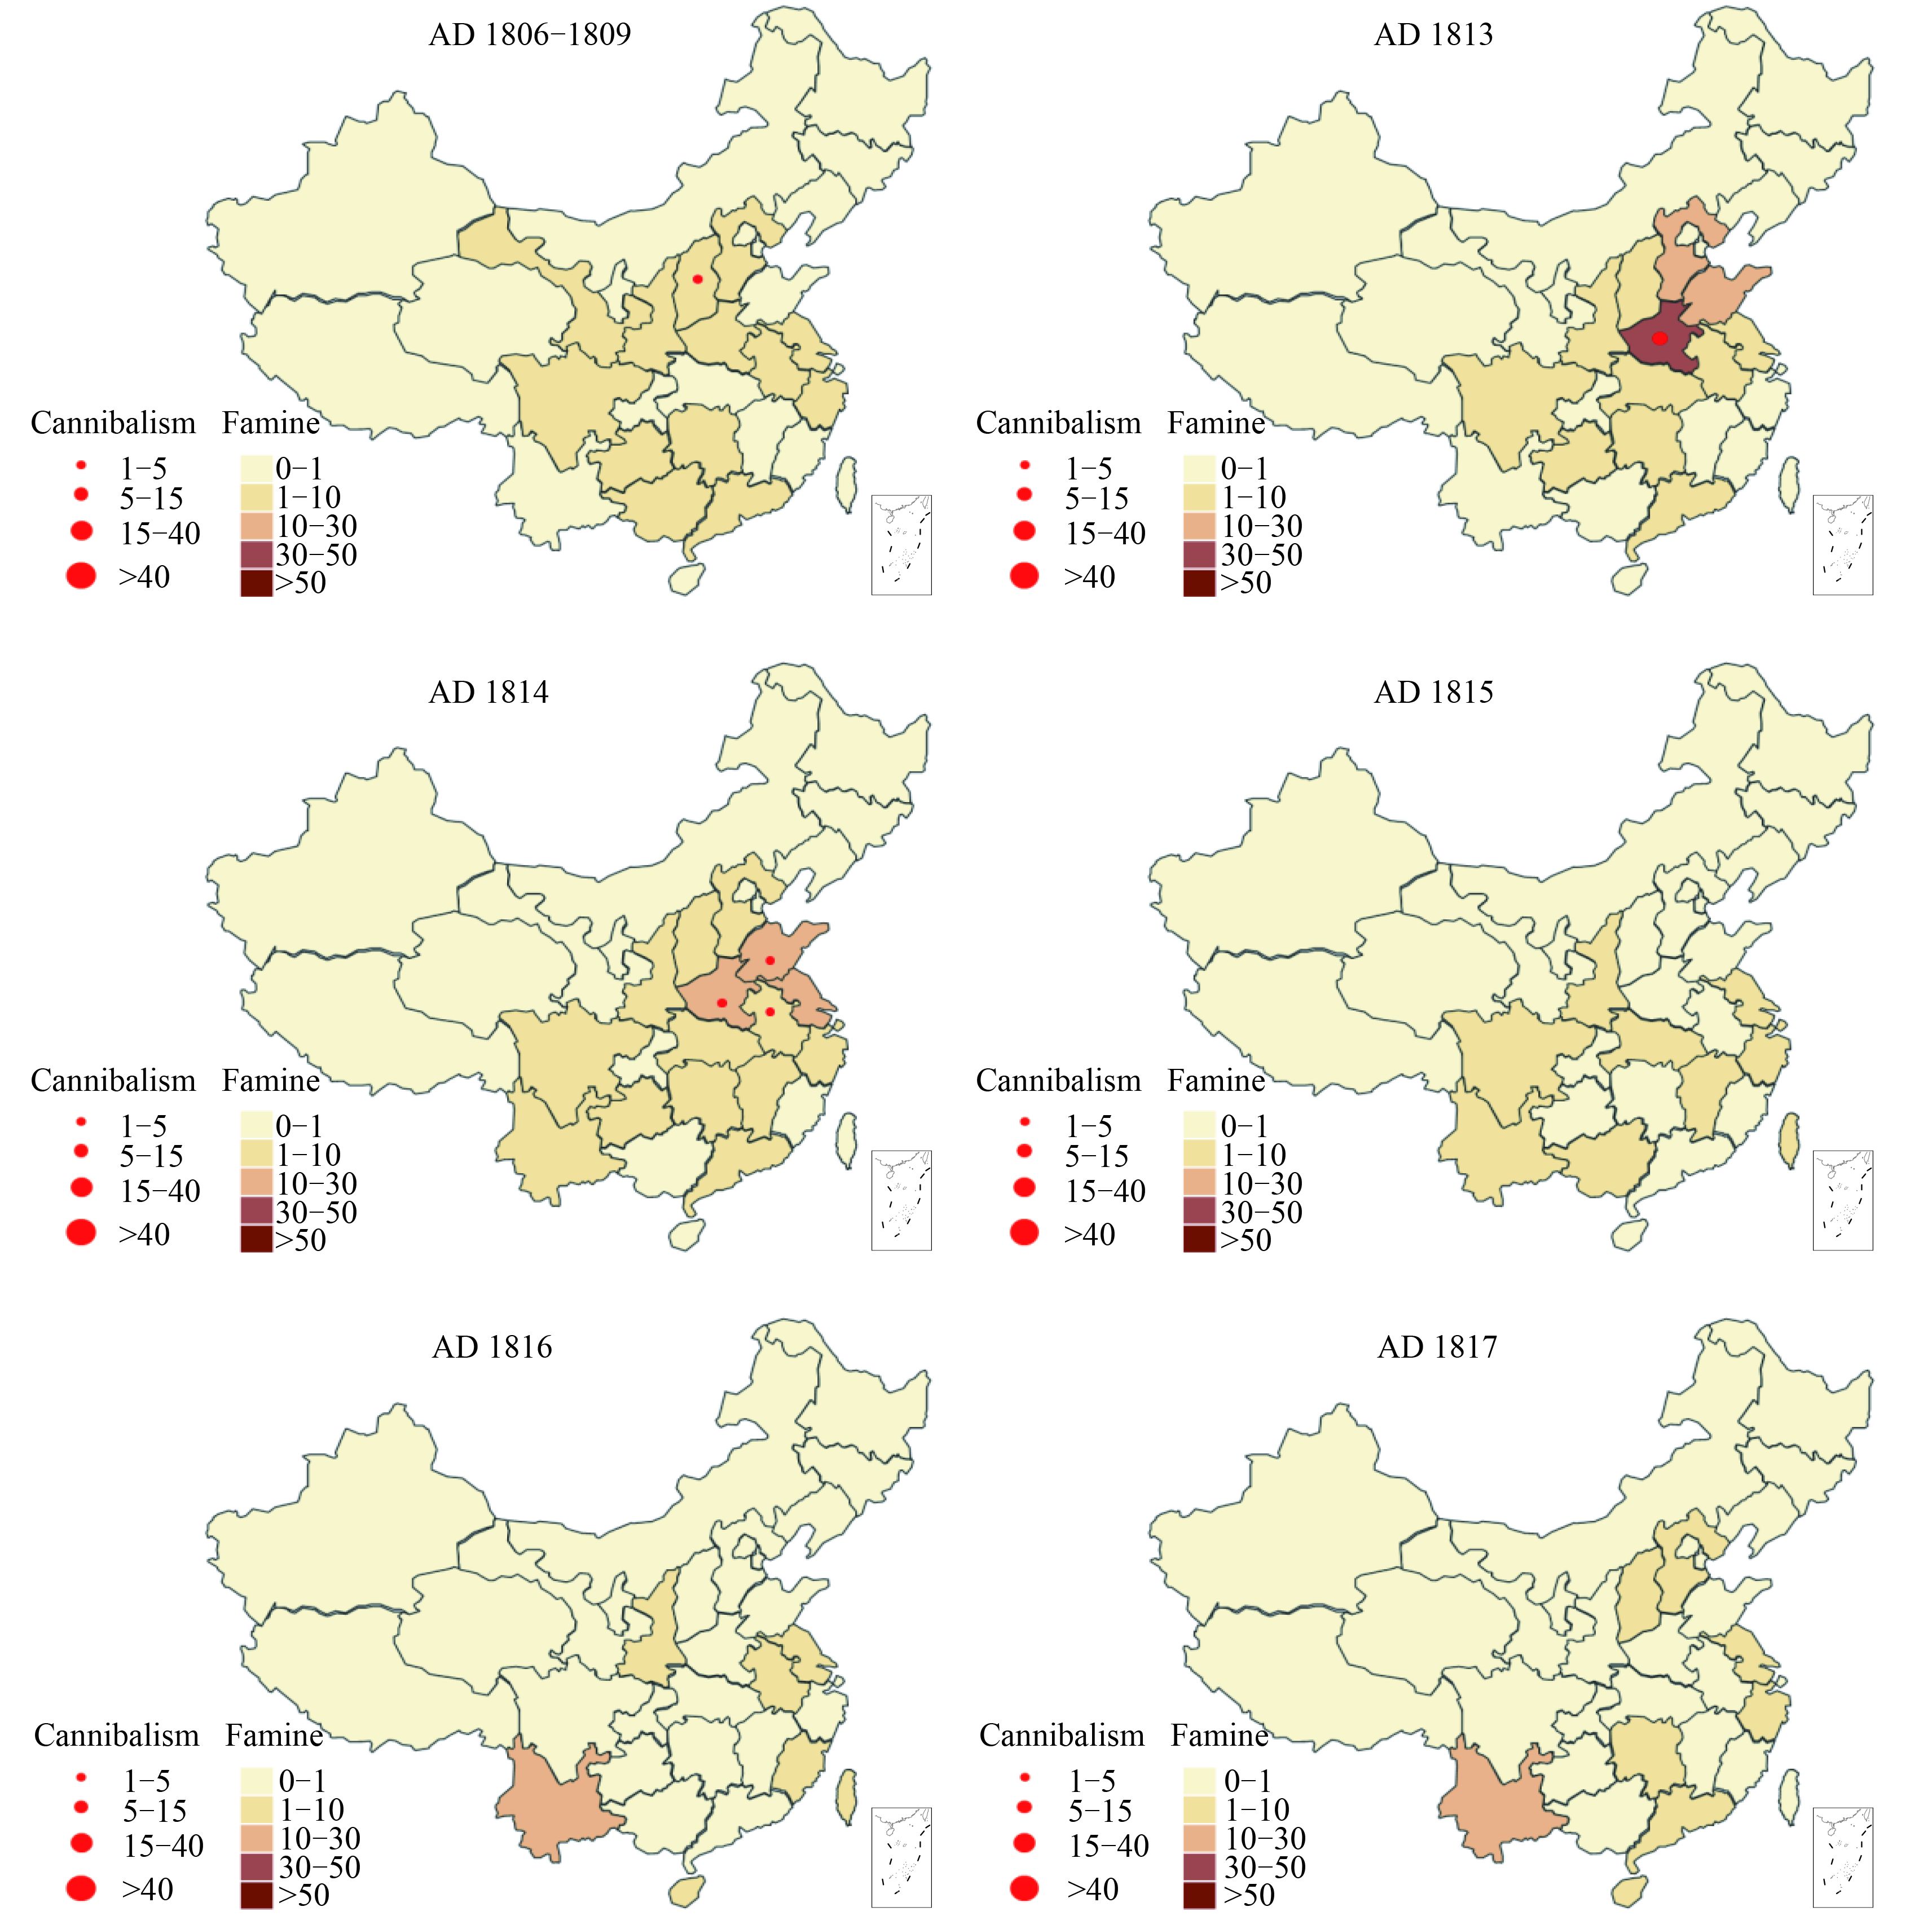
3.3 Sociological responsesBy causing coldness and dryness or flooding during the growing season, major volcanic eruptions like Tambora hold the potential to introduce a double jeopardy to agricultural production. In agronomy-based ancient China, agricultural failure may have caused food shortages and famine outbreaks. The Jiaqing Famine is used as an example of the Tambora climate aftermath in China (Yang et al., 2005;Oppenheimer, 2015). Our documentary reconstructions also show records of frost damage during later spring and summer (Fig. 7) and, as a consequence, an increased number of famine reports (Fig. 8) in Yunnan Province consecutively for the three summers of 1815–17. In addition, there are records of widespread plague in Shandong and Henan provinces during the winter of 1815 (Table 1). The plague was so severe that “only 1–2 out of 100 were not infected” and “crops were left un-harvested”. Interestingly, however, there are few records of severe cold or dryness outside the southern provinces summarized in Table 1. In fact, both the climatic and social conditions in the years following Tambora appear to have been mild for the entire nation in general, and for large areas of China even better than the years prior to the eruption (Figs. 7 and 8).
|
| Fig. 7 Spatial distributions of the climate disasters during 1804–17. The background colors indicate the number of recorded frost events within each year for individual provinces (the darker the color, the more severe the frost damage). The red and blues circles represent the number of recorded drought and flood events, respectively, within each year for individual provinces (the larger the circle, the higher the frequency). Due to the 1809 unknown eruption, the years of 1805–08 are used to represent the climatology and the years 1813–14 are used to represent the pre-eruption condition. |
|
| Fig. 8 As in Fig. 7, but for the social consequence, represented by the recorded number of famines (background colors) and cannibalism (red circles) events in each province for individual years. |
Historical documents may involve systematic biases, since more flood disasters were generally reported than drought- and cold-related events. For the latter, the temperature-sensitive low-latitude plateau region or the farming-pastoral ecotones in North China are more susceptible to agricultural damage under abnormal winter snow or cold summer weather, and therefore are more likely to have documentary evidence of relevant events (Yang et al., 2005). The bias may also come from the variation in the degree of effort that was devoted into systematically recording and collecting information on such disasters. During the Qing dynasty, there were in general more recording efforts in the Kangxi, Yongzheng, and Daoguang reigns than in the Jiaqing and Tongzhi reigns (Li, 2009). Such systematic biases cannot be avoided, even by using the information extracted from the same compilation with standard procedures. Therefore, the documentary results presented in this study are supplementary to the results drawn from the more quantitative proxy reconstructions, and need to be interpolated with caution.
3.4 Multiproxy comparisonThe tree-ring temperature reconstruction suggests an overall cooling response in China after the Tambora eruption, with northern and central China cooling more than the southern and coastal regions. Chinese documentary records, on the other hand, suggest a spatially restrained climatic stress after the Tambora perturbation, with abnormal or extreme cold weather mainly reported in southern China. The discrepancy may be attributable to the sensitivity of the historical records towards the weather parameters. For example, studies show that ancient weather reporting practices are in general more responsive to hydrological- than thermal-related extremes; and among the hydrological-related extremes, there is a greater likelihood to report pluvial than drought disasters (Yang et al., 2005). Therefore, it is possible that the temperature drop in northern China, though larger in absolute magnitude when compared to southern China, was less likely to cause extreme weather events in the eyes of lay people, and were thus not recorded. Besides, as shown in Fig. 1, the temperature in Asia had already started declining at the beginning of the 19th century, likely due to the lower solar insolation during the Dalton Minimum and the 1809 unknown eruption. The Tambora-induced cold excursion was experienced against this cold climatic background, and so its impacts may have been somewhat masked, especially in historical reports, as society might have been less sensitive to them or unable to distinguish them from the general climatic trend of the time.
Hydrologically, there are substantial discrepancies between the tree-ring-based MADA reconstruction and the Feng 2013 reconstruction, as well as between the proxy reconstruction and documentary records. The MADA reconstruction shows really significant dry conditions following Tambora in eastern China. No widespread drought, however, was recorded following the eruption in the documentary records. In fact, there was a light wetting tendency in eastern China, especially in Hubei, Jiangxi, Shandong, and Sichuan provinces (Fig. 7). The Feng 2013 reconstruction, by incorporating the documentary-derived dryness and wetness index, offers an integrated view on the hydrological response to the Tambora perturbation. The MADA-revealed response agrees well with the composite model results reported by Man et al. (2014), attributing the dry conditions in eastern China to the weakening of monsoonal rainfall resulting from the reduced land–sea thermal contrast. The revealed response of the Feng 2013 reconstruction agrees well with the observations for the 1982 El Chichón eruption, suggesting heterogeneous responses on the regional scale, especially when an individual event is under examination. Similar discrepancies between reconstructed and documentary records, and among various composites of historical eruptions, have also been found in Europe. For instance, the spatial distribution of the precipitation response in 1816 summarized in Luterbacher et al. (2015) is also very different from that for the 14 eruptions during the past 400 years as discussed in Wegmann et al. (2014).
4 Conclusions and outlookThe climatic aftermath of the 1815 Tambora eruption in China was studied by using both tree-ring-based temperature and precipitation reconstructions, and documentary-based disaster compilations. The results show that there is a substantial reduction in temperature following the Tambora perturbation, echoing the “Year without a Summer” phenomenon found in Europe and North America. The tree-ring proxy evidence suggests a larger temperature reduction in northern and central China, while documentary records of frost damage and abnormal snow and ice accumulations indicate a centering over southern China. Hydrologically, the tree-ring-based PDSI reconstructions show remarkable drought responses in eastern China as a result of weakened monsoonal circulation, while the multiproxy reconstruction incorporating documentary records show a slight wetting response around the Yangtze River valley. The discrepancies among different records may be partially due to the lack or incompleteness of written records during this period, or the different hydrological data, analytical methods, and time span of interest apply in difference studies. Nevertheless, it also reminds us of the complexity and uniqueness of the climatic response when only one event is considered.
This study systematically analyzed the climatic aftermath of the Tambora eruption in monsoonal China using the best available data and information, and therefore offers a complementary yet critical evaluation of the event in parallel to that in Europe and North America. Our results also support the previous suggestion that the record-breaking famine in Yunnan Province during 1815–17 is a result of crop damage from the anomalously cold growing season, rather than hydrological perturbation such as drought or flood.
Both the proxy and historical documentary evidence play an important role in studying the climatic impacts of historical volcanism. However, there is often a sensitive issue imbedded in both resources because individual records may differ in their sensitivity to specific weather events under different climatic backgrounds. Historical documentation may involve systematic biases due to the inherent preference of recording flooding rather than the drought- or cold-related disasters, as well as the variation in recording effort under different reigns. For individual events, documentation may also be biased by the vulnerability of local society, especially the agricultural sector, to climatic perturbations. Proxy reconstructions, on the other hand, may be limited by their spatial coverage and sensitivity towards the parameter under examination. Therefore, integrating multiple evidence types, including tree rings and historical records, as well as ice and lake sediments, speleothems, etc., with broad spatial coverage, is crucial to obtaining a better understanding of volcanic impacts.
Acknowledgments . We sincerely thank Dr. Tianjun Zhou and the organizing committee of this special edition for the invitation to submit the manuscript in memory of Prof. Shaowu Wang. We are grateful to the two anonymous reviewers for their very helpful suggestions for improving this paper.
| B. Adams, E. Mann J., C. M. Ammann M. ,2003: Proxy evidence for an El Niño-like response to volcanic forcing. Nature , 426 , 274–278. DOI:10.1038/nature02101 |
| Grosjean Brönnimann, Joos S., et al ,2015: Lessons from Tambora. PAGES Newsletter , 23 , 69. DOI:10.22498/pages |
| E. R. Cook, K. J. Anchukaitis, B. M. Buckley, et al ,2010: Asian monsoon failure and megadrought during the last millennium. Science , 328 , 486–489. DOI:10.1126/science.1185188 |
| E. R. Cook, P. J. Krusic, K. J. Anchukaitis, et al ,2013: Tree-ring reconstructed summer temperature anomalies for temperate East Asia since 800 C.E. Climate Dyn. , 41 , 2957–2972. DOI:10.1007/s00382-012-1611-x |
| A. G. Dai, K. E. Trenberth, T. T. Qian ,2004: A global dataset of Palmer Drought Severity Index for 1870–2002: Relationship with soil moisture and effects of surface warming. J. Hydrometeor. , 5 , 1117–1130. DOI:10.1175/JHM-386.1 |
| J. Fei, J. Zhou ,2015: The drought and locust plague of 942–944 AD in the Yellow River basin, China. Quat. Int. , 394 , 115–122. DOI:10.1016/j.quaint.2014.11.053 |
| J. Fei, J. Zhou, Y. J. Hou ,2007: Circa A. D. 626 volcanic eruption, climatic cooling, and the collapse of the Eastern Turkic Empire. Clim. Change , 81 , 469–475. DOI:10.1007/s10584-006-9199-y |
| S. Feng, Q. Hu, Q. R. Wu, et al ,2013: A gridded reconstruction of warm season precipitation for Asia spanning the past half millennium. J. Climate , 26 , 2192–2204. DOI:10.1175/JCLI-D-12-00099.1 |
| Harington, C. R., 1992:The Year Without a Summer?-World Climate in 1816. Ottawa: Canadian Museum of Nature, 576pp. |
| J. Haywood, A. Jones, N. Bellouin, et al ,2013: Asymmetric forcing from stratospheric aerosols impacts Sahelian rainfall. Nat. Climate Change , 3 , 660–665. DOI:10.1038/ nclimate1857 |
| C. E. Iles, G. C. Hegerl ,2014: The global precipitation response to volcanic eruptions in the CMIP5 models. Environ. Res. Lett. , 9 , 104012. DOI:10.1088/1748-9326/9/10/104012 |
| J. Klbauer, P. O. Hopcroft, P. J. Valdes, et al ,2013: Climate and carbon cycle response to the 1815 Tambora volcanic eruption. J. Geophys. Res. , 118 , 12497–12507. |
| D. R. Legates, C. J. Willmott ,1990: Mean seasonal and spatial variability in gauge-corrected global precipitation. Int. J. Climatol. , 10 , 111–127. DOI:10.1002/(ISSN)1097-0088 |
| Li, Y. S., 2009: The relationship between the harvest of Clupea pallasi and the abrupt climate change after 1816.Academics in China, No. 138, 42-55. |
| J. Luterbacher, C. Pfister ,2015: The year without a summer. Nat. Geosci. , 8 , 246–248. DOI:10.1038/ngeo2404 |
| W. M. Man, T. J. Zhou, J. H. Jungclaus ,2014: Effects of large volcanic eruptions on global summer climate and East Asian monsoon changes during the last millennium: Analysis of MPI-ESM simulations. J. Climate , 27 , 7394–7409. DOI:10.1175/JCLI-D-13-00739.1 |
| McKee, T. B., N. J. Doesken, and J. Kleist, 1993: The relationship of drought frequency and duration totimescales. Paper Presented at 8th Conference on Applied Climatology, Anaheim, Calif., Am. Meteor. Soc. |
| C. Oppenheimer ,2003: Climatic, environmental and human consequences of the largest known historic eruption: Tambora volcano (Indonesia) 1815. Prog. Phys. Geogr. , 27 , 230–259. DOI:10.1191/0309133303pp379ra |
| C. Oppenheimer ,2015: Eruption politics. Nat. Geosci. , 8 , 244–245. DOI:10.1038/ngeo2408 |
| 2K Consortium PAGES ,2013: Continental-scale temperature variability during the past two millennia. Nat. Geosci. , 6 , 339–346. DOI:10.1038/ngeo1797 |
| Y. B. Peng, C. M. Shen, W. C. Wang, et al ,2010: Response of summer precipitation over eastern China to large volcanic eruptions. J. Climate , 23 , 818–824. DOI:10.1175/2009JCLI2950.1 |
| C. Raible, Brönnimann C., Auchmann S., et al ,2016: Tambora 1815 as a test case for high impact volcanic eruptions: Earth system effects. WIRs: Climate Change , 7 , 569–589. DOI:10.1002/wcc.2016.7.issue-4 |
| Robock, A., 2001: Volcanic eruption, Tambora.Encyclopedia of Global Environmental Change. T. Munn, Ed. John Wiley and Sons, London, 1: 737-738. |
| Schmidt, A., and A. Robock, 2015: Volcanism, the atmosphere, and climate through time.Volcanism and Global Environmental Change. A. Schmidt, К.E. Fristad, and L. T. Elkins-Tanton, Eds. Cambridge University Press, Cambridge, UK, 195-207. |
| S. Self, R. Gertisser, T. Thordarson, et al ,2004: Magma volume, volatile emissions, and stratospheric aerosols from the 1815 eruption of Tambora. Geophys. Res. Lett. , 31 , L20608. DOI:10.1029/2004GL020925 |
| C. Shi, V. Daux, Q. B. Zhang, et al ,2012: Reconstruction of southeast Tibetan Plateau summer climate using tree ring δ18O: Moisture variability over the past two centuries . Climate Past , 8 , 205–213. DOI:10.5194/cp-8-205-2012 |
| M. Sigl, M. Winstrup, J. R. McConnell, et al ,2015: Timing and climate forcing of volcanic eruptions for the past 2500 years. Nature , 523 , 543–549. DOI:10.1038/nature14565 |
| R. B. Stothers ,1984: The great Tambora eruption in 1815 and its aftermath. Science , 224 , 1191–1198. DOI:10.1126/science.224.4654.1191 |
| Brönnimann Wegmann, Bhend M., et al ,2014: Volcanic influence on European summer precipitation through monsoons: Possible cause for “Years without Summer”. J. Climate , 27 , 3683–3691. DOI:10.1175/JCLI-D-13-00524.1 |
| Y. D. Yang, Z. M. Man, J. Y. Zheng ,2005: A serious famine in Yunnan (1815–1817) and the eruption of Tambola volcano. Fudan J. (Soc. Sci. Chin.) , 1 , 79–85. |
| Zhang De'er, 2004:A Compendium of Chinese Meteorological Records of the Last 3,000 Years. Jiangsu Education Press House, Nanjing, 2701-2843. (in Chinese) |
| Z. H. Zhuo, C. C. Gao, Y. Q. Pan ,2014: Proxy evidence for China's monsoon precipitation response to volcanic aerosols over the past seven centuries. J. Geophys. Res. , 119 , 6638–6652. |
 2017, Vol. 31


