 2016, Vol. 30
The Chinese Meteorological Society
Article Information
- MASHTAYEVA Shamshagul, DAI Liyun, CHE Tao, SAGINTAYEV Zhanay, SADVAKASOVA Saltanat, KUSSAINOVA Marzhan, ALIMBAYEVA Danara, AKYNBEKKYZY Meerzhan . 2016.
- Spatial and Temporal Variability of Snow Depth Derived from Passive Microwave Remote Sensing Data in Kazakhstan. 2016.
- J. Meteor. Res., 30(6): 1033-1043
- http://dx.doi.org/10.1007/s13351-016-5109-z
Article History
- Received December 31, 2015
- in final form July 10, 2016


2. (Key Laboratory of Remote Sensing of Gansu Province, Heihe Remote Sensing Experimental Research Station, Cold and Arid Regions Environmental and Engineering Research Institute, Chinese Academy of Sciences, Lanzhou 730000, China);
3. (Nazarbayev University, Astana 01000, Kazakhstan);
4. (National Hydrometeorological Service of the Republic of Kazakhstan, Astana 010000, Kazakhstan);
5. (Center for Excellence in Tibetan Plateau Earth Sciences, Chinese Academy of Sciences, Beijing 100101, China);
The snowpack and its spatial and temporal variability play an important role in the hydrological cycle and water resource management (Kuzmin, 1960; Iskakov and Medeu, 2006). Most river streams of Kazakhstan are fed by snow melt, which is the main water source for the vegetation growing season from April to September. Therefore, the spatial and temporal distributions of snow water equivalent (SWE) are important for determining the maximum spring water level and predicting runoff in mountainous rivers (Iskakov and Medeu, 2006; Georgiyevsky and Shanochkin, 2007).
Using traditional field studies to identify the spatial and temporal variability of snow characteristics is difficult because of sparse in-situ snow depth data, particularly over mountainous terrain. Satellite moni toring data provide supplementary information on the spatial and temporal variability of the snowpack. The application of satellite data to snow cover began in the 1960s (Denisov, 1963; Kondratev, 1966; Temnikov and Novikova, 1972; Kotlyakov et al., 1981). During recent decades, passive microwave remote sensing instruments, e.g., the Advanced Microwave Scanning Radiometer-Earth Observing System (AMSRE), have provided large-scale and long-term snow depth observational datasets (Armstrong and Brodzik, 2002). Deeper snowpacks contain more snow crystals that are available to scatter microwave energy. Hence, microwave brightness temperatures are generally lower for deeper snowpacks and higher for shallower snowpacks (Chang et al., 1987). Thus, both snow depth and SWE retrieval algorithms have been developed by using a temperature brightness difference (TBD) between frequencies of 18 and 37 GHz. The Chang spectral gradient algorithm (Chang et al., 1987), which provides a relationship between the snow depth and TBD (more information refers to Section 3), cannot describe all global snow conditions (Foster et al., 1997). Whilst regional algorithms to retrieve the snow depth have been developed in the past few decades for North American and Eurasian snowpacks (Foster et al., 1997; Kelly et al., 2003, Tedesco and Narvekar, 2010; Che et al., 2012), a number of scientists from different countries have found that Chang’s algorithm generates uncertainty in snow depth estimates (Che et al., 2008; Dai et al., 2012). There are two global SWE products currently. One is NASA’s AMSR-E standard SWE product, which was developed based on the Chang algorithm and snow feature changes model in Kelly et al. (2003). The other is the GlobSnow SWE, which was constructed by using an assimilation method. This method assimilates station snow depths into a snow radiation transfer model to optimize the snow particle size and then interpolates the optimized size over the entire area. The accuracy of GlobSnow has been proven to be higher than that of the NASA product in China, because of the absorption of observational data (Dai et al., 2012). However, whether the accuracy is also higher in Kazakhstan is still unknown.
In this study, the Chang algorithm was modified for Kazakhstan based on the modified algorithm. Daily snow depth information was retrieved for Kazakhstan, and the results were compared with the existing snow products from NASA and ESA (European Space Agency). The spatiotemporal distribution of snow cover in Kazakhstan was also analyzed based on the daily snow depth products from the Kazakh Hydrometeorological Agency (KazHydroMet). The results of this study are useful for predicting the maximum water level and runoff volume during spring flooding, evaluating the contribution of snowmelt water to soil moisture, determining mountain river runoff for the vegetation growing season, and calculating snow loading for hydro-technical construction projects (Dai and Che, 2010, 2011, 2014; Dai et al., 2012). A comparison with optical remote sensing will be the focus of our next piece of research for this region.
2DataWe collected daily snow depth data observed at meteorological stations from 2003 to 2005. The data for 2003 and 2004 were used for formulating the new algorithm and the data for 2005 were used for validating the modified algorithm.
2.1Meteorological station snow depth observationsKazakhstan extends from 41°N in the south to 55°N in the north, including steppe, desert, and semidesert zones. The elevation of the study location ranges from 132 m (above mean sea level) in southwestern Kazakhstan to over 6995 m in the southeastern region of the country (Khan Tengri). The snow season begins at different times across the country. Therefore, the spatial and temporal characteristics of snow are also different in various regions.
The KazHydroMed operates 287 meteorological stations and 24 snow-measuring sites. In this study, data from 80 stations were used, where the snow depth is measured on a daily basis. The locations of the meteorological stations in the study area are shown in Fig. 1.

|
| Figure 1 Locations of the meteorological stations in Kazakhstan. |
Data from the AMSR-E instrument were used in this study. This instrument is installed onboard NASA’s EOS Aqua satellite and provides global passive microwave measurements. The equal-area scalable earth grid brightness temperatures (6.9, 10.7, 18.7, 23.8, 36.5, and 89.0 GHz) have been available from the National Snow and Ice Data Center since June 2002. In this study, we used the 18-and 36-GHz brightness temperatures at horizontal polarization (H-Pol), which was proposed in the original Change algorithm, to retrieve snow depth information from 2003 to 2011 in the research area in Kazakhstan. However, recent studies have used vertical polarization (V-Pol) because H-Pol has been found to be more sensitive to ice layers in the snowpack and ice crust on top of the snow surface. These ice layers generate greater error when estimating the snow depth or SWE with radiance data (Rees et al., 2010). This topic will be our next area of study for the region of Kazakhstan.
3MethodologyIn this study, we modified the Chang algorithm to retrieve the snow depth in Kazakhstan. Chang and others developed the spectral gradient algorithm based on the scattering properties of snow particles, which provides a relationship between the snow depth and the TBD at 18 and 36 GHz: SD=a (TB18H-TB36H), where SD is snow depth, a is a coefficient that depends on the spatial variability of snow properties, and TB18H and TB36H are the TBDs at 18 and 36 GHz, respectively (Armstrong et al., 1993). A global coefficient of a was found to be unsuitable for Kazakhstan. Therefore, in this study, we modified the Chang algorithm using the observed snow depth and satellite brightness temperature data for Kazakhstan (Chang et al., 1976). A regression relationship was derived between the observed snow depth data from 80 stations in 2003 and 2004 and the corresponding TBD values (Fig. 2). In Kazakhstan, the snow depth retrieval algorithm was determined to be

|
(1) |

|
| Figure 2 The relationship between the TBD between bands 18 and 36 GHz (TB18H-TB36H) and the observed snow depth. |
The coefficient of 1.08 is less than the coefficient of 1.59 used in the global algorithm, and greater than the value of 0.78 used in the modified algorithm for China (Che et al., 2008).
The observed snow depths at 80 stations in 2005 were used to validate the modified algorithm. Snow depths that exceeded 0 were compared with the retrieved results because the criterion “TBD > 0” can successfully separate snow and snow-free conditions (Che et al., 2008). Figure 3 presents the observed and retrieved snow depth curves from the 80 selected stations, showing good agreement between the datasets. The average observed snow depth for the 80 stations, the corresponding bias between the observed and estimated snow depths, and the RMSEs were calculated. The average snow depth was found to be 17.06 cm, with a bias of 0.22 cm and an RMSE of 7.33 cm (Fig. 3).

|
| Figure 3 Comparison between the observed and estimated snow depth at the 80 selected stations (with observed snow depth exceeding 0) during the snow season. |
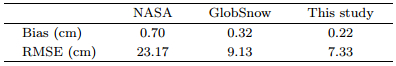
We also compared the results with existing snow products. Whilst the GlobSnow and NASA products measure the SWE, we retrieved the snow depth in this study, so the SWE products were converted to snow depth products by dividing by 0.24 g cm-3, which is the snow depth from the two products. The bias and RMSE were calculated between the remotely sensed SWE and observed SWE. We dealt only with snow depth data that were greater than 0 during the statistical process. The mean snow depth was 17.06 cm, and the bias and RMSE for the different methods are presented in Table 1. The results showed that both the bias and RMSE of this study were smaller than those from the other two products. Snow features were the key factors that influenced the estimation accuracy. The NASA product is a global algorithm and does not consider the spatial variation of the snow properties. Although the GlobSnow algorithm can incorporate station observations, no detailed information in Kazakhstan is available on the internet. In this study, we obtained the snow depth data from Kazakhstan’s National Weather Service. Although we did not directly consider the snow characteristics in the algorithm, the experimental method implied the snow feature information. Therefore, the accuracy of the retrieved results was higher than those of the other two products. However, this study did not consider the influence of temporal variations in snow properties because of a lack of efficient observations of snow characteristics. We hope that a detailed snow field measurements and monitoring can be implemented to develop dynamic coefficients and thus enhance the estimation accuracy.
The annual average snow depth (AASD), maximum monthly snow depth (MMSD), and snow cover duration (SCD) were calculated to analyze the spatiotemporal distribution of snow in Kazakhstan.
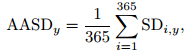
4.1Definition of parameters 4.1.1AASDThe average snow depth in every hydrological year from 2003/04 to 2010/11 was calculated based on the following:
|
(2) |
where y and i represent the yth year and the ith day in a particular year, respectively.
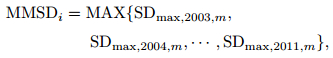
4.1.2MMSDThe MMSD was determined by the maximum snow depth of every month from 2003 to 2011, which can be expressed by using the following formula:
|
(3) |
where i represents the ith year beginning in 2003 and ending in 2011, m is the month, and 2003, 2004 s……, 2011 are the years. For example, SDmax, 2003, 1 represents the maximum snow depth for the first month in 2003.
4.1.3SCDThe SCD was defined as the number of days in which snow depth exceeded 0 in a hydrological year (from September through the following August) in this study.
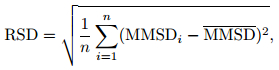
4.1.4Relative standard deviation (RSD)The RSD was computed to determine the amplitude of the interannual variations in the MMSD. For the MMSD data {MMSD2003, MMSD2004, ···, MMSD2011}, the RSD was calculated as follows:
|
(4) |
where MMSD is the average MMSD over multiple years, and i represents the ith year beginning in 2003 and extending for n years.
4.2Analysis of spatial and temporal variations in snow depth in KazakhstanThe snow depth data retrieved from AMSR-E were used to calculate the above four parameters, which were then used to analyze the temporal and spatial distribution of snow depth in Kazakhstan. Specifically, the AASD was used to analyze the interannual variations in snow cover, the MMSD was used to monitor seasonal variations, and the SCDs and average snow depth distribution during winter were adopted to describe the spatial distribution of snow cover. The RSDs of the MMSD variations were calculated to examine trends and fluctuations in the amplitude of the snow variation.
Daily snow depth information for Kazakhstan from 2003 to 2011 was retrieved based on the modified algorithm. A spectral gradient algorithm was developed based on the volume scattering of the snowpack. However, other scattering surfaces can result in the spectral gradient of snow particles, such as cold deserts, precipitation, and frozen ground. Therefore, other scattering events must be removed before retrieving the snow depth to avoid misclassification. The decision tree method that was developed by Grody and Basist (1996) was used to remove other scattering events during the retrieval process for long-term daily snow depth measurements.
4.2.1AASDThe spatiotemporal distribution of AASD is shown in Fig. 4. Spatially, the average snow depth exhibited non-uniform snow cover, with a minimum snow depth less than 0.5 cm over southern and southwestern Kazakhstan in each year. The AASD increased from the south to the north and maintained latitudinal zonality. AASD values between 10 and 15 cm occurred in the eastern and southwestern regions throughout the study period.

|
| Figure 4 Average annual snow depth distribution based on the AMSR-E data for (a) 2004, (b) 2005, (c) 2006, (d) 2007, (e) 2008, (f) 2009, (g) 2010, (h) 2011, and (i) average. |
The temporal variations in snow depth exhibited strong spatiotemporal heterogeneity. Snow depths exceeding 8 cm extended over the largest area in northern Kazakhstan in 2005 and eastern Kazakhstan in 2006. In 2008, the snow cover extended over the largest area; most of the southern regions were covered by snow. Furthermore, 2009 was a dry year in northern Kazakhstan, and a large portion of the country having average snow depths of less than 4 cm.
4.2.2MMSDFigure 5 presents the MMSD from 2003 to 2011 in Kazakhstan, indicating the spatial regularity of latitudinal zonality. Generally, snow began in September in the eastern and southern mountains, increased in depth and area until the following March, and sharply decreased in April. Snow nearly melted away in May throughout Kazakhstan during the entire study period. At the beginning of the snow season (October), the MMSD in the northern and eastern regions was often less than 10 cm. November was characterized by a large area of snow throughout Kazakhstan, and the MMSD in most areas ranged from 10 to 20 cm. The MMSD in December was indicative of snow cover in all areas except for small portions of southwestern Kazakhstan. The MMSD in most areas ranged from 20 to 30 cm.

|
| Figure 5 2003-2011 averaged monthly maximum snow depth (MMSD) in Kazakhstan from October to next April based on the AMSR-E data (left column) and its relative standard deviation (RSD) (right column). |
In January, snow covered all of Kazakhstan, with the MMSD reaching 70 cm in some areas of eastern and southeastern Kazakhstan. The MMSD gradually increased during this month from the south to the north, covering all of the country. By the end of January, the area in which the MMSD exceeded 20 cm was enlarged. Only a small portion of southeastern Kazakhstan had MMSD values of less than 20 cm. In March, MMSDs exceeded 40 and 30 cm, reaching their largest spatial extent. However, the snow cover area began to decrease, and there was no snow over a small region in the south.
In April, the snow began to melt throughout Kazakhstan. The snow cover area and MMSD decreased over the study area. In May, there was no snow in Kazakhstan except for the mountainous regions in eastern and southeastern Kazakhstan (Fig. 5a).
The standard deviation of the MMSD (Fig. 5b) was calculated to describe the interannual changes in the MMSD, and was found to vary with snow depth. Generally, higher MMSD values corresponded to greater standard deviations. April exhibited the largest area of standard deviations between 15 and 20 cm in northern Kazakhstan. Therefore, in the melting phase, the interannual change in snow depth exhibited large variability.
Generally, from October to April, the highest MMSD coverage was in January with snow depth reaching up to 70 cm. The highest standard deviation of the MMSD was in April, reaching up to 25 cm: in the melting phase, the interannual change in snow depth exhibited large variability.
4.2.3SCDBased on the daily snow depth data from 2003 to 2011, the SCDs in Kazakhstan were derived. The results showed significant spatial variations, with values ranging from 30 to 365 days. The SCDs exhibited latitudinal zonality across the country, but were broken in the mountainous regions because of the high elevation and relief (Fig. 6). The SCDs maintained the regularity of latitudinal zonality, in which they increased from less than 30 days in the south to more than 120 days in the north, except for the mountainous areas in southern and eastern Kazakhstan, which exceeded 150 days. However, in the highest mountains of eastern Kazakhstan, the SCDs were as high as 250 days. Figure 5 shows that the latitudinal zonality of the snow cover was broken in the northern region for the duration between 90 and 120 days, because of the local micro-relief and its surface characteristics, which influence the propagation of snowstorms. These results are consistent with those of previous studies (Kauazov, 2009, 2010a, b).

|
| Figure 6 Annual average distribution of the snow cover period in Kazakhstan for 2003-2011 based on the AMSR-E data. |
Figure 7 shows that the ASDW from 2003 to 2011 covered all of Kazakhstan. The ASDW values ranged from 15 to 20 cm in the eastern region. The AASD distribution during winter was also characterized by a spatial regularity of latitudinal zonality, which is consistent with the results of previous studies (Iskakov and Medeu, 2006; Kauazov, 2009, 2010a, b). In the mountainous areas, the ASDW exceeded 20 cm.

|
| Figure 7 Average snow depth distribution in Kazakhstan during winter (November-March) of 2003-2011 based on the AMSR-E data. |
In this study, a new snow depth retrieval algorithm was developed based on snow depth observations from meteorological stations and AMSR-E brightness temperatures in Kazakhstan, and the daily snow depth in Kazakhstan was estimated to analyze its spatial and temporal variations.
The spatial interannual snow depth distribution in Kazakhstan demonstrated that the snow cover increased from the south to the north in Kazakhstan. Kazakhstan was found to exhibit non-uniform snow cover and minimum snow depth values of less than 5 cm in the southern and southwestern portions of the country. The snow depth increased from the south to the north and maintained latitudinal zonality.
The annual average duration of snow cover exhibited significant variations, i.e., ranging from 30 to 365 days. The longest snow cover duration was found in the mountainous region of eastern Kazakhstan, ranging from 200 to 250 days. The analysis of the maximum monthly snow depth indicated the deepest snow depth months were February and March (Fig. 6). The disadvantage of the method used here is that the low resolution can make validation difficult, because observations at some sites cannot represent regional information within a single large (625 km2) pixel. Therefore, incorporating high-resolution remote sensing data, such as MODIS, or active microwave remote sensing data, should be useful in studying the regionalscale characteristics of seasonal snow cover.
The results of this work are of scientific and practical significance and can be used for the evaluation of hydrological spring runoff predictions in Kazakhstan’s small and large rivers.
An important point to highlight is that we used H-Pol in this work. However, V-Pol should also be analyzed for this region. H-Pol has been found to be more sensitive to ice layers in the snowpack and ice crust on top of the snow surface. These ice layers generate greater errors when estimating the snow depth or SWE with radiance data (Rees et al., 2010). This topic will be the focus of our next study for the region of Kazakhstan. Moreover, shallow snow is a major problem for passive microwave remote sensing, including the AMSR-E instrument, and especially over arid and semi-arid areas of deserts and frozen ground, which are the main factors that influence the marginal area along the southern boundary of Kazakhstan. More snow depth data should be measured with mapping over the northern and mountain areas through optical remote sensing and field data collection, which we also plan to focus upon in future research.
Finally, only long-term snow depth data were analyzed in this study. Further work should be conducted to analyze the SWE and the relationship between snow depth and climatic/hydrological factors.
| Armstrong R. L., Chang A., Rango A., et al ,1993: Snow depths and grain-size relationships with rele-vance for passive microwave studies. Ann. Glaciol. , 17 , 171–176. |
| DOI:10.3189/172756402781817428 Armstrong R. L., Brodzik M. J. ,2002: Hemispheric-scale comparison and evaluation of passive-micro-wave snow algorithms. Ann. Glaciol. , 34 , 38–44. DOI:10.3189/172756402781817428 |
| Chang A. T. C., Gloersen P., Schmugge T., et al ,1976: Microwave emission from snow and glacier ice. J. Glaciol. , 16 , 23–39. |
| Chang A. T. C., Foster J. L., Hall D. K. ,1987: NIMBUS-7 SMMR derived global snow cover parameters. Ann. Glaciol. , 9 , 39–44. |
| DOI:10.3189/172756408787814690 Che T., Li X., Jin R., et al ,2008: Snow depth de-rived from passive microwave remote-sensing data in China. Ann. Glaciol. , 49 , 145–154. DOI:10.3189/172756408787814690 |
| DOI:10.1016/j.jag.2011.10.014 Che T., Dai L. Y., Wang J., et al ,2012: Estimation of snow depth and snow water equivalent distribution using airborne microwave radiometry in the Bing-gou Watershed, the upper reaches of the Heihe River basin. Int. J. Appl. Earth Obs. , 17 , 23–32. DOI:10.1016/j.jag.2011.10.014 |
| Dai, L. Y., and T. Che, 2010:Cross-platform calibration of SMMR, SSM/I and AMSR-E passive microwave brightness temperature. Proceedings of SPIE 7841, Sixth International Symposium on Digital Earth:Data Processing and Applications, Beijing, China, 9 September. |
| Dai Liyun, Che Tao ,2011: Spatiotemporal distribu-tions and influences on snow density in China from 1999 to 2008. Sci. Cold Arid Reg. , 3 , 325–331. |
| DOI:10.1016/j.rse.2011.08.029 Dai L. Y., Che T., Wang J., et al ,2012: Snow depth and snow water equivalent estimation from AMSR-E data based on a priori snow characteristics in Xin-jiang, China. Remote Sens. Environ. , 127 , 14–29. DOI:10.1016/j.rse.2011.08.029 |
| DOI:10.1117/1.JRS.8.084693 Dai L. Y., Che T. ,2014: Spatiotemporal variability in snow cover from 1987 to 2011 in northern China. J. Appl. Remote Sens. , 8 , 084693. DOI:10.1117/1.JRS.8.084693 |
| Denisov U. ,1963: Calculation methods of snowpack distribution in the mountain on aeorophotographic data and air temperature. Izv. UzRRP. Technical Science Series , 73–79. |
| DOI:10.1016/S0034-4257(97)00085-0 Foster J. L., Chang A. T. C., Hall D. K. ,1997: Comparison of snow mass estimates from a proto-type passive microwave snow algorithm, a revised algorithm and a snow depth climatology. Remote Sens. Environ. , 62 , 132–142. DOI:10.1016/S0034-4257(97)00085-0 |
| Georgiyevsky Y., Shanochkin S.,2007: Hydrological Forecasts. Petersburg: RSHU Publishers. |
| DOI:10.1109/36.481908 Grody N. C., Basist A. N. ,1996: Global identification of snowcover using SSM/I measurements. IEEE Trans. Geosci. Remote Sens. , 34 , 237–249. DOI:10.1109/36.481908 |
| Iskakov, N. A., and A. R. Medeu, 2006:Republic of Kazakhstan, Vol. I:Natural Resources and Conditions.Ministry for Environmental Protection, Almaty, 32 pp.(in Russian) |
| Kauazov A. ,2009: Calculating of maximum snowpack in agricultural zone in North Kazakhstan using remote sensing data. Geographical Series (2), 96–103. |
| Kauazov A. ,2010a: Maximum moisture identification method in North Kazakhstan on remote sensing data. Natural and Technical Science Series (3), 149–153. |
| Kauazov A. ,2010b: Possibility of identification of snowpack descent in the North kazakhstan on NOAA/AVHRR data. Geographical Series (1), 95–99. |
| DOI:10.1109/TGRS.2003.809118 Kelly R. E., Chang A. T., Tsang L., et al ,2003: A pro-totype AMSR-E global snow area and snow depth algorithm. IEEE Trans. Geosci. Remote Sens. , 41 , 230–242. DOI:10.1109/TGRS.2003.809118 |
| Kondratev, K., 1966:Practical Using of Meteorological Satellite Data. Hydrometeoizda, 376 pp.(in Rus-sian) |
| Kotlyakov B., Hodakov B., Grinberg A. ,1981: Warming development of snow-ice objects as a method quantity interpretation aeorophotographic data. Geographical Series (3), 127–132. |
| Kuzmin P. ,1960: Identifying Methods of Snow Cover and Snowpack Formation. Hydrometeoizdat , 170 . |
| DOI:10.1016/j.rse.2009.08.013 Rees A., Lemmetyinen J., Derksen C., et al ,2010: Ob-served and modelled effects of ice lens formation on passive microwave brightness temperatures over snow covered tundra. Remote Sensing of Environ-ment , 114 , 116–126. DOI:10.1016/j.rse.2009.08.013 |
| DOI:10.1109/JSTARS.2010.2040462 Tedesco M., Narvekar P. S. ,2010: Assessment of the NASA AMSR-E SWE Product. IEEE Journal of Selected Topics in Applied Earth Observations and Remote Sensing , 3 , 141–159. DOI:10.1109/JSTARS.2010.2040462 |
| Temnikov S., Novikova I. ,1972: Same ques-tions of satellite data using for studying snowpack. Sarnigmi (65), 138–149. |