 2016, Vol. 30
The Chinese Meteorological Society
Article Information
- ZHANG Xia, YAO Xiuping, MA Jiali, MIMA-Zhuoga ${authorVo.mingEn} . 2016.
- Climatology of Transverse Shear Lines Related to Heavy Rainfall over the Tibetan Plateau during Boreal Summer. 2016.
- J. Meteor. Res., 30(6): 915-926
- http://dx.doi.org/10.1007/s13351-016-6952-7
Article History
- Received March 3, 2016
- in final form June 27, 2016


2. (Desert Atmosphere and Environment Observation Station at Taklimakan, Tazhong 841000, China);
3. (Lincang Meteorological Bureau of Yunnan Province, Lincang 677099, China);
4. (College of Applied Meteorology, Nanjing University of Information Science & Technology, Nanjing 210044, China);
5. (Bureau of Meteorology, Melbourne, VIC 3001, Australia);
The shear convergence line over the Qinghai-Xizang Plateau (SCLQXP) is a significant weather system in the Qinghai-Xizang boundary layer, especially at 500 hPa. It not only is the most important synoptic system that causes torrential rainfall over the Tibetan Plateau, but also influences the area east of the Tibetan Plateau, such as the middle and lower reaches of the Yangtze and Huang-Huai River basin, when it develops eastward under favorable circulation conditions. Meanwhile, the SCLQXP’s activity affects the Tibetan Plateau and its adjacent area in terms of drought or flooding. Many studies on floods or droughts show a close relationship with the activity of the SCLQXP. For example, Xue (1980) studied the heavy rainfall over the Qinghai-Xizang Plateau (QXP) triggered by a shear line during 22-23 June 1978. Dong (1993) analyzed the general circulation of the serious drought that occurred in the central area of Xizang Autonomous Region in the early summer of 1992. Yu et al. (1997) explored the influence of a shear line over the QXP on a heavy rainfall event in western Sichuan basin on 24 August 1995, based on numerical experiments. Li (2000), Yu (2000), and Yang et al. (2001) all investigated the relationship between the heavy rainfall-related flooding of the Yangtze River in 1998 and the general circulation over the QXP. Observational analysis by He et al. (2009) indicated that shear lines are more active than the plateau vortex over the Tibetan Plateau.
Since the “Qinghai-Xizang Plateau Meteorology Experiment” in 1979 and the “Tibetan Plateau Atmospheric Scientific Experiment” in 1998, much progress on the SCLQXP has been made in several aspects, including its climatological characteristics, genesis, structure, dynamics, thermodynamics, cloud characteristics, mechanisms of movement and maintenance, and even the interaction with other weather systems (He, 2013; Yao et al., 2014; Yu et al., 2016). Studies indicate that the SCLQXP can be classified into quasi-zonal shear lines (transverse shear lines; TSLs) and quasi-longitudinal shear lines (perpendicular shear lines; PSLs), according to their direction, with the former being more than twice as common than the latter (Meteorological Science Study Group in Lhasa on the Qinghai-Tibetan Plateau, 1981; Qiao and Zhang, 1994; Li et al., 2009, 2010).
An SCLQXP can generate near the zero line between the easterly and westerly, or in the westerly/easterly, and its thermal characteristics and dynamic structure can be significantly different depending on the large-scale circulation background. According to its thermal properties, an SCLQXP can be classified as warm, baroclinic or cold, among which the height of a cold SCLQXP can reach the 300-hPa level (Qiao and Tan, 1984). By using monthly mean upperlevel data from 1960 to 1969, studies on the thermal and dynamic characteristics of shear lines at the 500-hPa level over the plateau show that the formation of shear lines may be mainly due to the dynamic effect of orographically induced rounding flow, when the westerly increases to the north of the plateau and decreases over the plateau owing to the heating effect of the plateau’s ground in summer (Xu, 1984). Tao (1984) indicated that the heating effect of the plateau also strengthens its formation. Some studies indicated that there is a close relationship between the maintenance of the SCLQXP and that of the subtropical jet, or the eastward extent of the ridge of the Iran high, or the moisture carried by the Southwest Indian monsoon and the release of latent heat (Leshan Meteorological Bureau of Sichuan Province, 1976; Liu and Pan, 1987; Tang, 2002). Statistical analysis of shear line activity over the QXP shows that most SCLQXPs maintain less than 12 h, and no longer than 84 h. The longer the lifetime of the shear line in the summer half of the year, the larger the region and intensity of precipitation in and near the QXP (Yu et al., 2013). Shi and He (2011) showed that specific background circulation conditions dictate whether a plateau shear line can or cannot move out of the Tibetan Plateau region. Meanwhile, a number of studies have indicated that about one in three TSLs move out of the plateau to affect the occurrence of torrential rainfall over central and southwestern China, and even eastern, southern and northern China (Xu, 1987; He et al., 2009). In general, TSLs are less likely to move towards and affect the weather of the eastern plateau, while PSLs often move out of the plateau region to incur rain storms over the adjacent area of the QXP (Li and Luo, 1986; Yu et al., 1997; Jiao et al., 2005; Zhao, 2015).
Much progress has been made based on SCLQXP observational analysis; however, owing to the lack of observational data in the early stages of SCLQXP development, and observations being too coarse, a number of deficiencies exist as follows. Firstly, the continuity and length of data coverage is insufficient. For example, the Meteorological Science Study Group in Lhasa on the Qinghai-Tibetan Plateau (1981) used data from 1969 to 1976, while Li et al. (2010) and Yu et al. (2013) used data from 1998 to 2004 and 2007 to 2010, respectively. He et al. (2009) used only 7-yr data from 2000 to 2007. Secondly, the sounding data used are only recorded twice a day, and their resolution is very low. Finally, there are inconsistencies in the statistical criteria used in different studies, and the statistical methods are largely subjective; thus, unified knowledge on the spatiotemporal characteristics of TSLs, their activity, and their relationship with disastrous rainfall events, has yet to be obtained. Nevertheless, with the accumulation of intensive observational data over the plateau, along with reanalysis data, it is possible to carry out research on the climatology of TSLs, and reveal the relationship between the occurrence of heavy rainfall over the plateau and the adjacent area near the southern part of the plateau, with the SCLQXP.
In recent years, ERA-Interim data and NCEP-NCAR reanalysis data, with their finer temporal and spatial resolutions compared with many observational datasets, have been employed in synoptic and climatological studies (Dee et al., 2011; Li et al., 2014; Lin, 2015a, c). Furthermore, objective identification methods, such as those for Yangtze River shear lines, southern branch troughs, zonal shear lines, and plateau vortexes, now offer references for the study of TSLs (Sun et al., 2012; Neu et al., 2013; Lin, 2015b; Ma and Yao, 2015). Based on ERA-Interim data during May-October from 1981 to 2013 and daily rainfall observations, the present study explored the number of TSL days, plateau torrential rainfall days, and TSL torrential rainfall days, by using objective analysis, to update and improve our understanding of the relationship between the SCLQXP and rain storms related to TSLs.
2Data and methodology 2.1DataThe ERA-Interim reanalysis dataset (Dee et al., 2011) used in this study consisted of a 6-h wind profile at 500 hPa with a 1° × 1° horizontal resolution from 1981 to 2013. The 24-h accumulated rainfall collected from national meteorological stations, i.e., the daily precipitation dataset (version 3.0), with quality control applied by the National Climate Center of the China Meteorological Administration, was also used.
2.2Methodology 2.2.1DefinitionsThe Tibetan Plateau is defined as the region 25°-40°N, 70°-103°E (He et al., 2009; Shi and He, 2011; Yu et al., 2011), as shown in Fig. 1. The area encircled by the black border includes Qinghai Province, Tibetan Autonomous Region and southern Xinjiang Autonomous Region, northern Yunnan Province, western Sichuan Province, and southwestern Gansu Province. Boreal summer is defined as the period from May to October.

|
| Figure 1 Map of the Tibetan Plateau (black border) and the locations of observation stations (dots). |
Over the plateau region, we define the days with the daily rainfall equal to or larger than 25 mm as a heavy rainfall day (Zhuo, 2006; Yu et al., 2012).
2.2.2The TSL objective identification methodThe SCLQXP is defined as the TSL and PSL (Meteorological Science Study Group in Lhasa on the Qinghai-Tibetan Plateau, 1981; Qiao and Zhang, 1994; Li et al., 2009, 2010). In this paper, based on the ERA-Interim wind field data at 500 hPa during May-October of 1981-2013, we identified TSLs using three criteria, i.e., the meridional shear of zonal wind, the relative vorticity, and the zero line of zonal wind. The details of the methods are as follows.
Referring to zonal and meridional wind speeds as u and v, and relative vorticity as ζ,
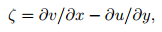
|
where x is the meridional coordinate and y is the zonal coordinate. Then, only when the following three criteria are satisfied simultaneously, do we define the SCLQXP:
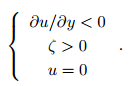
|
(1) |
In the study area, when the data at a station (dots in Fig. 1) satisfied the above three criteria in Eq. (1) simultaneously, and the distance between stations meeting these requirements was longer than five degrees of longitude, the shear line could be identified as a TSL.
2.2.3Statistical definitionsThree statistical measures are used in this study: the number of TSL days, the number of torrential rain days, and the number of TSL torrential rain days.
At any of four times on a “day” (1800 UTC of the previous solar day, and 0000, 0600, and 1200 UTC on the following solar day), if the wind field data at 500 hPa met the criteria of Eq. (1), then we considered that day as a TSL day. Note, however, that it only counted once if a criterion was satisfied more than once. When there was more than one observation of 24-h rainfall being larger than 25 mm over the plateau, the day was classified as a plateau torrential rain day. If the day was not only a plateau torrential rain day, but also a TSL day, with the rain storm occurring adjacent to the TSL within 5 degrees of latitude, the day was considered to be a TSL torrential rainfall day. Figure 2 illustrates TSL day and TSL torrential rain day over the plateau region.

|
| Figure 2 Illustration of (a) a plateau transverse shear line (TSL) day without torrential rain (10 June 2012), (b) a plateau TSL day with torrential rain (2 June 2012), and (c) a torrential rain day without a TSL (8 July 2012). The thicker black line indicates the objectively analyzed plateau TSL, the black border encircles the major body of the Tibetan Plateau, black wind barbs indicate 500-hPa wind, black plus signs indicate daily precipitation < 25 mm, grey filled circles indicate daily precipitation between 25 and 50 mm, and black filled triangles indicate daily precipitation > 50 mm. |
To analyze the relationship between TSLs and plateau topography, the accumulated frequency of TSLs was determined by using the ERA-Interim fourtimes-daily dataset.
3.1Geographic distributionThe accumulated frequency distribution of TSLs and the movement of the high frequency axis by month in boreal summer from 1983 to 2013 are shown in Fig. 3.

|
| Figure 3 (a) The accumulated frequency distribution of plateau TSLs during boreal summer from 1981 to 2013, and (b) the high frequency axis distribution from May to October. In (a), the contours indicate the TSL frequency, and the thick solid line indicates the high averaged frequency axis. In (b), the thick solid lines are the high frequency axes for May, June, July, and August from north to south, respectively; the dot-dashed line is for September; and the dotted line is for October. |
It can be seen from Fig. 3a that the TSL is situated across the whole plateau area in boreal summer, and moves within the area 30°-35°N (occasionally moving to the north of 35°N over the eastern plateau to affect the middle and northern parts of Qinghai Province). Its high frequency area is from 32° to 35°N, with the high frequency axis lying close to 33°N. Clearly, the occurrence of a TSL close to 33°N is most common, and it decreases northward or southward with its orientation parallel to the plateau’s topography. During boreal summer, there are two centers for high TSL frequency: one is located in the area south of the Tuotuo River (33.5°N, 92.5°E), and the other in the northwestern area of Tibet Gerze (34°N, 82.5°E).
Over 1981-2013, from May to October, we found that the movement area, frequency activities, high frequency center location, and the axis direction of the TSL are different each month. From June to August of the main flood period, the TSL high frequency axis location is south of that in the other months. The TSL high frequency region extends obviously southward in July and August, with the frequency region of over 400 spreading to southern Tibet; while the southern boundary of the high frequency region in May, September, and October is in central Tibet. The TSL frequency in June is maximum, while that in October is minimum. Meanwhile, the TSL frequency in May, July, and August is quite similar, but decreases noticeably in September. It can be seen from Fig. 3b that the high frequency axis moves southward from May to August, and returns northward from September to October with a slight shift (about 2° of latitude).
In this study, a long time series data with high spatial and temporal resolutions were used to explore the TSL’s geographical characteristics. The results obtained are similar to those of Qiao and Zhang (1994). However, the high frequency axis position is slightly to the north of that in Qiao and Zhang (1994), and the center location is different to that located near Nagqu in Qiao and Zhang (1994).
3.2Temporal statisticsThe results reported in Section 3.1 indicate that the TSL usually moves over the region 30°-35°N, 80°-103°E. However, as is well known, 96% of ground stations on the QXP are situated in the area east of 85°E, with altitude higher than 4000 m. Therefore, the statistics on the number of TSL days, heavy rainfall days, and TSL heavy rainfall days, refer to this area, and satisfy the criteria described in Sections 2.2.2 and 2.2.3.
In this paper, the sum (difference) between the average number of TSL days and its standard deviation is the threshold to determine high-incidence (lowincidence) years. When the number of TSL days is larger (smaller) than the sum (difference) of the average and its standard deviation, we consider this year to be a high-incidence (low-incidence) year. The method is applied in the following statistical study on the high-and low-incidence years of heavy rainfall days and TSL heavy rainfall days.
The annual evolution of TSL days in boreal summer from 1981 to 2013 is shown in Fig. 4a. It can be seen from Fig. 4a that the 33-yr average number of TSL days is 65.3 over the plateau study region, which accounts for 36% of the total number of boreal summer days. Furthermore, there are five high-incidence years in 1986, 1987, 1989, 1993, and 2008, with 78 days in 1987. Low-incidence years include 1983, 1988, 1994, and 2003, with only 49 days in 1994. There is a difference of 29 days between the highest-and lowestincidence years.

|
| Figure 4 (a) Annual variation, (b) monthly variation, and (c) Morlet wavelet power spectrum (shading indicates the area that is statistically significant at the 95% confidence level) of the number of the TSL days during May-October from 1981 to 2013. In (a), the numbers from top to bottom on the right axis indicate the upper threshold, mean, and lower threshold of TSL frequency, respectively. |
Further analysis shows that the annual variation in TSL days is the greatest in the 1980s to early 1990s, with over half of the high-and low-incidence years occurring in the 1980s. In the last six years of the 1990s, the annual variation is the lowest, and the number of TSL days is close to the average. After the turn of the 21st century, the annual variation increases again, but the amplitude is smaller than that of the 1980s. Since 2010, the number of TSL days has been close to the average. The trend line for the number of TSL days almost coincides with the line for the 33-yr average, with no obvious change to an increase or decrease. The above results match the conclusions obtained by Huang and Zhang (2007) and Lu et al. (2007).
By exploring the monthly evolution of the number of TSL days in boreal summer, it is found that the total number of TSL days in June is 471, accounting for 49% of the total, with its maximum average number of days reaching 14.7, followed by 14.3 in July (Fig. 4b). The number of days from May to August varies slightly, and the annual average is 12.6, 14.3, 13.6, and 12.4, respectively. As for September and October, the number decreases noticeably to the minimum of 4.6 in October. Therefore, to a certain extent, the monthly evolution is connected with the intensification and weakening of the summer monsoon.
It can be seen from Fig. 4c, by means of the Morlet wavelet power spectrum, that the number of TSL days shows significant periodic variation. In the mid and late 1980s, the number of TSL days shows a 4-6-yr period, whereas a 2-4-yr period since then to the mid-late 1990s is apparent, before returning to a quasi-4-yr period thereafter. All of the above periods passed the 95% confidence level.
4Relationship between the TSL and torrential rainfall 4.1Temporal evolution of plateau torrential rainfall daysThe monthly variation in the number of plateau torrential rainfall days from May to October of 1981-2013 is shown in Fig. 5a, revealing that the number of average days reached 83.1, accounting for 45% of the total number of days in boreal summer. The number of torrential days varies in a large range. There are 16 yr with torrential days higher than the average, among which 11 yr occurred from the late 1990s to date. The high-incidence years for torrential days are 1985, 1998, 1999, and 2010, with the highest frequency being 96 days in 1985. Besides, the low-incidence years for torrential days are 1983, 1994, 1997, and 2011, among which the number of the minimum torrential days in 1997 is 62 days-34 days less than the maximum of the high-incidence days.

|
| Figure 5 As in Fig. 4, but for the number of plateau torrential rain days. |
The interannual variation of torrential days indicates that the largest fluctuation in torrential days occurs during the early 1980s and late 1990s. Meanwhile, little variation from the average number of days occurs in the late 1980s, early 1990s, and the beginning of the 21st century. In addition, the variation increases after 2010. The trend line for the number of torrential days almost coincides with the line for the 33-yr average, which suggests that there is no clear variation trend for the number of torrential days over the main area of the plateau.
By analyzing the monthly variation of plateau torrential days, we draw the same conclusion that the torrential days mainly occur in the main flood period from June to August (JJA), with its summation reaching 1888 days, accounting for 69% of the total number of boreal summer days. The maximum number of torrential days (722) is in July, followed by August. The months with the least number of torrential days are May (252) and October (152), accounting for 5.5% of the total number of days in the summer half of the year during the study period (1981-2013).
The Morlet wavelet power spectrum of plateau torrential days shows a 2-4-yr period (Fig. 5c). Besides, decadal characteristics exist in which there is a 3-4-yr cycle in the 1980s and 2-4-yr cycle in the early 1990s to the beginning of the 21st century, while after 2005 the significant period is a 2-3-yr cycle.
4.2Temporal evolution of TSL heavy rain daysDifferent degrees of rainfall are induced during the period of the TSL’s activity. The torrential rainfall induced by the TSL often appears over the region of the QXP, with only a few occurrences over the adjacent area of the QXP when the TSL moves eastward or southward to the southeast of the QXP. Note that the days of rainfall caused by the PSL transformed by the moving TSL or the vortex evolved by the TSL are not counted in this study.
It can be inferred from the interannual variation and evolution trend for the TSL-induced torrential rainfall days in boreal summer from 1981 to 2013 that 33.1 days are the 33-yr average number of days. The high-incidence years are 1981, 1984, 1986, 1989, 1991, and 2007, with the maximum number of days being 45 in 1991. The low-incidence years are 1983, 2003, 2006, and 2007, with the minimum number of days being 26 in 2006, and the rest being 25. There is a 20-day difference between the high-incidence year maximum and low-incidence year minimum.
Figure 6a shows that the largest annual variation of TSL-induced torrential rainfall days occurs in the 1980s, and the amplitude decreases from the 1990s to the beginning of the 21st century. The amplitude then increases again during 2006-2010, and thereafter the annual number of TSL-induced torrential rainfall days is close to the average. It can be seen that the temporal evolution of TSL-induced torrential rainfall days in the past 33 years shows a slight descending tendency, with a rate of descent of 0.147 day yr-1; however, this trend is not significant at the 95% confidence level.

|
| Figure 6 As in Fig. 4, but for the number of plateau TSL-induced torrential rainfall days. Note that the monthly variation is not shown. |
By using Morlet wavelet power spectrum analysis on the time series of TSL torrential rainfall days, the results show the existence of a 2-3-and 4-6-yr cycle (Fig. 6b). Before the 1990s, the two cycles exist simultaneously, and both are statistically significant at the 95% confidence level. After the 1990s, the cycle is 2-3 yr, and then becomes a quasi-3-yr cycle. These statistical features are similar to those of TSL days. Both have a remarkable 4-6-yr cycle in the 1980s, and the cycles change after the late 1990s. The cycle for TSL days shifts to a quasi-4-yr period from 2-4 yr, while the cycle for TSL torrential rainfall days shifts to a qusi-3-yr period from 2-3 yr.
4.3Relationship between the TSL and torrential rainfall daysBased on the statistical explorations in Sections 3.2, 4.1, and 4.2, the average numbers of TSL days, plateau torrential days, and TSL torrential days are 65.3, 83.1, and 33.1 days, respectively. In terms of climatology, the number of TSL days accounts for 35.5% over the total 184 days in the plateau’s boreal summer, while the number of torrential days accounts for 45.2% and the number of TSL torrential rainfall days only 18%.
The relationships among plateau TSL days, torrential rain days, and TSL torrential rain days are shown in Fig. 7. Area A in Fig. 7 denotes the number of TSL days, area B indicates the number of plateau torrential rainfall days, and area C-the intersection of areas A and B-is the number of TSL torrential rainfall days. It can be seen from Fig. 7 that the 33-yr average of TSL torrential days is 33.1 days, accounting for 50.7% of TSL average days (65.3 days) and 39.8% of plateau torrential average days (83.1 days). The results reveal that, in boreal summer, more than half of TSLs can cause torrential rainfall in the region of the plateau, and about 40% of torrential rainfall events are triggered by TSLs.

|
| Figure 7 Illustration of the relationships among TSL-induced days, torrential rain days, and TSL torrential rain days. A: plateau TSL days (65.3 days); B: plateau torrential rain days (83.1 days); and C: TSL-induced torrential rain days (33.1 days). |
The above relationships represent the average state for the whole of boreal summer. Based on the relationships between the TSL days and torrential rainfall days in the flooding season of June-August, we conclude that the average number of TSL torrential days is 23.9 days, the average for TSL days is 40.3 days, and the average for torrential rainfall days is 57.2 days. Furthermore, the number of TSL torrential rainfall days in JJA accounts for 59.3% of the TSL days and 41.8% of the torrential rainfall days. Thus, nearly 60% of TSLs can trigger torrential rainfall, which means over 40% of torrential rainfall events are caused by TSLs.
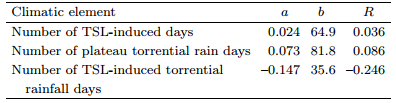
4.4Relationship between TSL and torrential rainfall day evolution tendencyThe annual variations of TSL days, plateau torrential rainfall days, and TSL torrential rainfall days are discussed respectively in Sections 3.2 (Fig. 4a), 4.1 (Fig. 5a), and 4.2 (Fig. 6a), and there are differences among them. In order to further reveal the differences, liner fitting is carried out on the annual variation series of TSL days, plateau torrential rainfall days, and TSL torrential rainfall days, over the 33-yr study period. The linear fitting is set to be Y=ax + b, in which Y is climatic factors (TSL days, plateau torrential rainfall days, and TSL torrential rainfall days), a is growth rate, x is the year (from 1981 to 2013), and b is the intercept. R is the correlation coefficient of the climatic factors against the time series x. The linear fitting values of a, b, and R are given in Table 1.
|
When a > 0, there is an increasing trend for climatic factors; when a < 0, there is a decreasing trend; and when a=0, there is no change in trend. As the length of the climatic factors time series is 33, the thresholds of the correlation significant level for the significance tests over 0.05 and 0.01 are Ra0.05 (=0.344) and Ra0.01 (=0.442), respectively.
It can be seen from Table 1 that the annual growth rates of TSL days and plateau torrential rainfall days are 0.024 and 0.073 day yr-1, respectively. Both rates are lower in magnitude than the absolute growth rate of the number of plateau torrential rainfall days (-0.147 day yr-1), and the variation trend correlation coefficients of the three climatic factors are not statistically significant at the 95% confidence level. To summarize, there is no apparent variation trend for the numbers of TSL days and plateau torrential rainfall in almost 33 yr, and there is a slight decreasing trend for the number of TSL torrential rainfall days.
The correlation coefficient between the number of TSL days and plateau torrential rainfall days in the JJA is 0.499, while that in August can even reach 0.588, both of which are statistically significant at the 99% confidence level. The preceding analysis shows that the low-incidence years of TSL days correspond to low-incidence years of plateau torrential rainfall days (e.g., 1983 and 1994). Meanwhile, the high-incidence years of TSL days correspond to those of plateau torrential rainfall days. For example, 1998 is a highincidence year of plateau torrential rainfall days, and is the year that the number of TSL days increases to its peak after 1994. These studies indicate that there is a close relationship between TSL and plateau torrential rainfall. Although the mechanisms of torrential rainfall are complex, and plateau topography is only one of many factors impacting upon torrential rainfall, the activities of the TSL still represent one of the most important synoptic systems affecting torrential rainfall.
5SummaryBased on a statistical analysis of TSL climatology and its relationship with plateau torrential rainfall during boreal summer 1981-2013, the following conclusions are drawn.
(1) The TSL can cross the whole QXP in the east-west direction, and its high frequency activity axis is located near 33°N. The high frequency axis moves southward on a monthly basis from May to August, and then northward from September to October, with an amplitude of movement of less than 2° of latitude.
(2) The annual average number of TSL days in boreal summer is 65.3 days, with the maximum appearing in June and the minimum in October. There are significant interannual and decadal variations for the TSL. In the high-incidence year of 1987, the number of TSL days is 78, while in the low-incidence year of 1994 it is only 49. Besides, the annual variation in TSL days in the 1980s is the largest, and in the following six years it is the smallest. In the 21st century, the degree of fluctuation again increases, but less than the maximum variation in the 1980s. Furthermore, the variation in the number of TSL days shows significant periodicity, such as a 4-6-yr cycle in the 1980s, 2-4-yr cycle in the late 1980s to 1990s, and a quasi-4-yr cycle after the late 1990s.
(3) The absolute growth rate values in the number of TSL days and plateau torrential rainfall days are smaller in magnitude than that of TSL torrential rainfall days. There is no significant variation trend for TSL days and plateau torrential rainfall days in the 33-yr study period. The temporal variation of TSL torrential rainfall days decreases slightly with time, but the tendency is not obvious. The correlation coefficient between TSL days and plateau torrential rainfall days in the main flood period (JJA) is 0.499, which is statistically significant at the 99% confidence level.
(4) More than 50% of TSLs can cause torrential rainfall in the plateau region, 40% of plateau torrential rainfall events are triggered by a TSL.
Despite the above findings, there remain a number of open questions regarding the TSL. For example: Why does the tendency of TSL torrential rainfall decrease while there are no obvious variations in the number of TSL days and plateau torrential rainfall days? Is there any relationship with the PSL? Or, with the thermodynamic conditions resulting from climate warming? Is there any quantitative relationship between the number of TSL days and regional rainfall intensity/amount over central-eastern or northern parts of China? Is there any relationship between the TSL and the generation of rain over the western part of South China? All of these questions are worthy of further exploration.
| DOI:10.1002/qj.v137.656 Dee D. P., Uppala S. M., Simmons A. J., et al ,2011: The ERA-Interim reanalysis:Configuration and perfor-mance of the data assimilation system. Quart. J. Roy. Meteor. Soc. , 137 , 553–597. DOI:10.1002/qj.v137.656 |
| Dong Jinhu ,1993: An analysis of the general circulation of the early summer drought in central Xizang, 1992. Meteor. Mon. , 19 , 41–43. |
| He Guangbi ,2013: Review of the plateau shear-line stud-ies. Plateau and Mountain Meteorology Research , 33 , 90–96. |
| He Guangbi, Gao Wenliang, Tu Nini ,2009: The observational analysis of shear line and low vortex over the Tibetan Plateau in summer from 2000 to 2007. Plateau Meteor. , 28 , 549–555. |
| Huang Yimin, Zhang Xinping ,2007: Character analysis in variation of seasonal precipitation over the Tibetan Plateau. Resources and Environment in the Yangtze Basin , 16 , 537–542. |
| Jiao Meiyan, Li Chuan, Li Yanxiang ,2005: Mesoscale analyses of a Sichuan heavy rainfall. J. Appl. Me-teor. Sci. , 16 , 699–704. |
| Leshan Meteorological Bureau of Sichuan Province ,1976: The Qinghai-Xizang Plateau shear line and the rain-fall of Leshan County. Meteor. Mon. , 3 , 10–12. |
| Li Guoping, Zhao Fuhu, Huang Chuhui, et al ,2014: Analysis of 30-yr climatology of the Tibetan Plateau vortex in summer with NCEP reanalysis data. Chinese J. Atmos. Sci. , 38 , 756–769. |
| Li Weijing, Luo Siwei ,1986: An numerical experi-ment of the effect of Tibetan Plateau on a synoptic system in its neighbourhood. Plateau Meteor. , 5 , 245–255. |
| Li Yueqing ,2000: The PBL wind field at the eastern edge of the Tibetan Plateau and its relations with heavy rain-flood of the Changjiang River in 1998. Chinese J. Atmos. Sci. , 24 , 641–648. |
| Li Yueqing, Yu Shuhua, Peng Jun, et al,2009: Year-book for the Vortex Shear Line Over Qinghai-Tibet Plateau (2003). Beijing: Science Press: 102-112. |
| Li Yueqing, Yu Shuhua, Peng Jun, et al,2010: Year-book for the Vortex Shear Line Over Qinghai-Tibet Plateau (2007). Beijing: Science Press: 148-160. |
| Lin Zhiqiang ,2015a: An objective analysis of the Tibetan Plateau vortexes based on the ERA-Interim reanalysis data:1979-2013. J. Meteor. Res. , 73 , 925–939. |
| Lin Zhiqiang ,2015b: Objective identify method and cli-matic characteristics of the southern branch trough. Plateau Meteor. , 34 , 684–689. |
| DOI:10.1007/s13351-015-4273-x Lin Zhiqiang ,2015c: Analysis of Tibetan Plateau vortex activities using ERA-Interim data for the period 1979-2013. J. Meteor. Res. , 29 , 720–734. DOI:10.1007/s13351-015-4273-x |
| Liu Fuming, Pan Pingshan ,1987: A study on the moving southward of shear line with quasi-E-W orientation over Qinghai-Xizang Plateau. Plateau Meteor. , 6 , 56–64. |
| Lu Heli, Shao Quanqin, Liu Jiyuan, et al ,2007: Temporo-spatial distribution of summer precipita-tion over Qinghai-Tibetan Plateau during the last 44 years. Acta Geographica Sinica , 62 , 946–958. |
| Ma Jiali, Yao Xiuping ,2015: Statistical analysis of the shear lines and torrential rains over the Yangtze-Huaihe River region during June-July of 1981-2013. Acta Meteor. Sinica , 73 , 883–894. |
| DOI:10.1175/BAMS-D-11-00154.1 Neu U., Akperov G. M., Bellenbaum N., et al ,2013: IM-ILAST:A community effort to intercompare extra-tropical cyclone detection and tracking algorithms. Bull. Amer. Meteor. Soc. , 94 , 529–547. DOI:10.1175/BAMS-D-11-00154.1 |
| Qiao Quanming, Tan Haiqing ,1984: The structure of 500-mb shear line and large-scale circulation over Qingzang Plateau in summer. Plateau Meteor. , 3 , 50–57. |
| Qiao Quanming, Zhang Yagao,1994: Synoptic Mete-orology of Qinghai-Tibetan Plateau. Beijing: China Meteo-rological Press: 102-116. |
| Qinghai-Tibetan Plateau Meteorological Science Study Group in Lhasa,1981: Vortex Shear Line Study at 500 hPa over the Qinghai-Tibetan Plateau in Sum-mer. Beijing: Science Press: 1-12. |
| Shi Rui, He Guangbi ,2011: Contrast analysis on background circulation of plateau shear line moving out and not moving out of the Tibetan Plateau. Plateau Meteor. , 30 , 1453–1461. |
| Sun Xingchi, Wang Xilei, Zhou Xuesong ,2012: Fine analysis on the rainfall distribution of zonal shear line heavy rain. Meteor. Mon. , 38 , 779–785. |
| Tang Hong ,2002: Research on the process of the strong precipitation in the summer of Tibetan Plateau. Ti-bet Science and Technology , 51–55. |
| Tao Shiyan, Luo Siwei, Zhang Hongcai ,1984: The Qinghai-Xizang Plateau meteorological science experiment and its observation system from May to August in 1979. Meteor. Mon. , 10 , 2–5. |
| Xu Guochang ,1984: The climatologically synoptic characteristics of the shear line on the 500 mb surface over the Qinghai-Xizang Plateau. Plateau Meteor. , 3 , 36–41. |
| Xu Xihua ,1987: Analysis on the motion of quasi-east-west direction wind shear line. Journal of Chengdu Meteorological Institute , 80–87. |
| Xue Zhi ,1980: A case study of a shear line producing heavy rainfall on Qinghai-Xizang Plateau. Acta Meteor. Sinica , 38 , 142–149. |
| Yang Keming, Bi Baogui, Li Yuean, et al ,2001: On flood-causing torrential rainfall in the upstream dis-trict of Changjiang River in 1998. Meteor. Mon. , 27 , 9–14. |
| Yao Xiuping, Sun Jianyuan, Kang Lan, et al ,2014: Ad-vances on research of shear convergence line over Qinghai-Xizang Plateau. Plateau Meteor. , 33 , 294–300. |
| Yu Shuhua ,2000: An analysis of impact of the heavy rain in upper reaches of the Yangtze River on the flood peak of the river in 1998. Meteor. Mon. , 26 , 56–57. |
| Yu Shuhua, He Guangbi, Teng Jiamo ,1997: The numerical experiments of influence of shear line over Qinghai-Xizang Plateau on a sharp heavy rain in West Sichuan basin. Plateau Meteor. , 16 , 306–311. |
| Yu Shuhua, Gao Wenliang, Pengjun ,2012: Statisti-cal analysis on influence of Qinghai-Xizang Plateau vortex activity on precipitation in China. Plateau Meteor. , 31 , 592–604. |
| Yu Shuhua, Gao Wenliang, Peng Jun ,2013: Sta-tistical analysis of shearline activity in QXP and its influence on rainfall in China in recent 13 years. Plateau Meteor. , 32 , 1527–1537. |
| DOI:10.1007/s00376-015-5039-1 Yu Shuhua, Gao Wenliang, Xiao Dixiang, et al ,2016: Observational facts regarding the joint activities of the southwest vortex and plateau vortex after its departure from the Tibetan Plateau. Adv. Atmos. Sci. , 33 , 34–46. DOI:10.1007/s00376-015-5039-1 |
| Yu Zhongshui, Kang Shicang, Jiang Jianyin ,2011: Spatial and temporal variations of the night-rain rate during summer over the Tibetan Plateau. Journal of Mountain Science , 29 , 627–632. |
| DOI:10.1007/s00703-014-0356-y Zhao Y. C. ,2015: A study on the heavy-rain-producing mesoscale convective system associated with diurnal variation of radiation and topography in the eastern slope of western Sichuan Plateau. Meteor. Atmos. Phys. , 127 , 123–146. DOI:10.1007/s00703-014-0356-y |
| Zhuo Ga ,2006: The analysis of middle and upper reaches Yarlung Zangbo River local rainstorm and dry wa-terlogging and rainstorm weather system. Tibet Science and Technology , 29 , 29–31, 35. |