 2016, Vol. 30
The Chinese Meteorological Society
Article Information
- CAO Xi, CHEN Guanghua, XIAO Xiao . 2016.
- Simulation of Tropical Cyclogenesis in Association with Large-Scale Cyclonic Circulation over the Western North Pacific. 2016.
- J. Meteor. Res., 30(6): 897-914
- http://dx.doi.org/10.1007/s13351-016-5086-2
Article History
- Received October 12, 2015
- in final form July 7, 2016


2. (State Key Laboratory of Severe Weather, Chinese Academy of Meteorological Sciences, Beijing 100081);
3. (Longquanyi District Meteorological Service of Chengdu, Chengdu 610100);
The western North Pacific (WNP) is the world’s most active basin in terms of tropical cyclogenesis (Neumann, 1993). In boreal summer, the monsoonal circulation over the WNP is characterized by convergence between monsoon westerlies and trade easterlies and a meridional shear, where there is abundant convection (Li, 2012; Wu et al., 2012). The monsoonal convergence and meridional shear are two components of the monsoon trough. Based on 20-yr reanalysis data, Feng et al. (2014) indicated that monsoon shear, monsoon confluence, and a reverse-oriented monsoon trough account for about 80% of the TC genesis over the WNP.
The monsoon trough sometimes manifests itself as a large-scale monsoon gyre, which is a near-cyclonic vortex with a diameter of about 2000-2500 km (Lander, 1994; Harr et al., 1996). Such a monsoon gyre can significantly impact TC formation and motion in the WNP (Carr and Elsberry, 1995; Chen et al., 2004; Wu et al., 2011, 2013). For example, Lander (1994) conducted a case study on TC formation within the monsoon gyres over the WNP in August 1991. He found that the monsoon gyre was associated with six TC formations and ultimately, the monsoon gyre itself developed into a giant typhoon. Ritchie and Holland (1999) employed 8-yr data to identify 5 characteristic patterns associated with TC formation in the WNP, of which the monsoon gyre pattern accounted for 3% of the total genesis events. Chen et al. (2004) investigated the role of monsoon gyres in the interannual variations of TC formation over the WNP and indicated that about 70% of TC formations were related to monsoon gyres. Further, Yoshida and Ishikawa (2013) employed an objective algorithm and defined contribution scores for the five flow patterns identified by Ritchie and Holland (1999), of which the monsoon gyre pattern accounted for 6% of the total genesis events. These differences may be related to the definition of a monsoon gyre. Although the associated mechanisms are not well known, these studies suggest that monsoon gyres play an important role in TC genesis over the WNP.
Recently, Wu et al. (2013) conducted an observational study on monsoon gyres associated with TC formations during the period 2000-2010. They identified a total of 37 monsoon gyres associated with TC genesis during May-October of this period. At the same time, they showed that most of the TCs associated with monsoon gyres formed near the center of the monsoon gyre and the northeastern end of the enhanced southwesterly flow, which they attributed to relatively weak vertical wind shear. Liang et al. (2014) examined the tropical cyclogenesis associated with Rossby wave energy dispersion with an initial monsoon gyre using idealized numerical model simulations.
Based on previous studies, the current understanding of TC formation associated with monsoon gyres or cyclonic circulation derives mainly from observational and composite studies. Composite studies suggest that large-scale monsoon gyres favor TC formation near the center of the monsoon gyres and the northeastern quadrant. However, it is still unclear whether the relationship between monsoon gyres and the position of TC formation can be simulated well through numerical experiments. In addition, the mechanism responsible for TC formation within a favorable or an unfavorable position of a monsoon gyre is not yet well known.
Two recent modeling studies have shown that monsoon trough intraseasonal oscillation and interannual variation exert a strong control over TC formation through both dynamic (positive vorticity and convergence) and thermodynamic (moisture) effects (Cao et al., 2014a, b). They noted that an active monsoon trough intraseasonal oscillation phase is associated with a cyclonic circulation anomaly in the lower level and high relative humidity in the middle level, as obtained from observational data. Experiments that separated the dynamic and thermodynamic impacts of the monsoon trough intraseasonal oscillation during the active phase showed that the thermodynamic anomalies from monsoon trough intraseasonal oscillation contributed more to TC development compared to dynamic anomalies (Cao et al., 2014a). This study motivates us to further investigate where the most favorable position for tropical cyclogenesis is under the cyclonic circulation over the WNP using idealized numerical model simulations. The objective of this research is to address the aforementioned question.
The rest of this paper is organized as follows: The large-scale cyclonic circulation anomalies and numerical experiment design are illustrated in Section 2. In Section 3, the vortex evolutions in the different positions of cyclonic circulation are examined. The mechanisms for TC formation within the cyclonic circulation are examined in Section 4. Finally, summary and discussion are given in Section 5.
2Cyclonic circulation and model experiment design 2.1Large-scale cyclonic circulation anomaliesThe large-scale cyclonic circulation anomalies are derived from NCEP reanalysis data, which are added to the mean background to examine how the cyclonic circulation modulates vortex development (Kalnay et al., 1996). In this study, we focus on how the dynamic variables associated with the cyclonic circulation affect TC formation. Firstly, an intensity index of monsoon trough intraseasonal oscillation over the WNP is defined by using the daily satellite outgoing longwave radiation (OLR) dataset from the NOAA (Liebmann and Smith, 1996). The climatological annual cycle in the above variables is removed from the long-term daily mean for the period 1979-1998. Then, we perform a Lanczos bandpass filter to extract the 20-80-day signals (Duchon, 1979). According to the maximum variance of intraseasonal OLR anomalies, a box (12°-22°N, 123°-133°E) averaged OLR index is defined as a reference time series to obtain active monsoon trough intraseasonal oscillation cases [see Fig. 1 in Cao et al. (2014a)]. The composite technique is then applied to obtain anomalous circulation fields during the active phase of monsoon trough intraseasonal oscillation. The active monsoon trough intraseasonal oscillation phase is characterized by a largescale cyclonic circulation anomaly at the lower level, with a width of about 3000-4000 km. The detail of the method and vertical profiles of area-averaged tangential wind and divergence within the cyclonic circulation can be referred to in Cao et al. (2014a).

|
| Figure 1 Vertical profiles of (a) zonal wind (m s-1), (b) meridional wind (m s-1), and (c, d) relative vorticity (contours; 10-6 K s-1) and temperature anomalies (shaded; K) along the (c) south-north and (d) east-west directions during the active phase of monsoon trough intraseasonal oscillation. The zero on the abscissa corresponds to the center of the cyclonic circulation. |
In order to compare the vertical profiles of cyclonic circulation with the monsoon gyre from Wu et al. (2013), Figs. 1a and 1b show the vertical profiles of the zonal and meridional wind components centered in the cyclonic circulation anomaly (20°N, 122.5°E) for the active phase of the monsoon trough intraseasonal oscillation. The center of the cyclonic circulation is defined according to the zero line of wind in the middle level. The enhanced southwesterly winds can be clearly seen in the vertical profiles. The maximum westerly (easterly) component of 4 (2.5) m s-1 occurs around 850 hPa, about 600-800 km away from the cyclonic circulation center (Fig. 1a). In the west-east vertical profile of the meridional wind, the maximum of the southerly wind appears around 900 hPa on the eastern side (Fig. 1b).
The vertical profiles of relative vorticity and temperature anomalies of composited cyclonic circulation are further shown in Figs. 1c and 1d. In the south-north vertical profile, the maximum of the relative vorticity appears around 650 hPa and is replaced by negative vorticity above 200 hPa; while in the west-east vertical profile, the maximum of the relative vorticity appears around 900 hPa and deviates from the center of the cyclonic circulation to the east, which may be due to the enhanced southerly winds at 900 hPa, as shown in Fig. 1b. The cyclonic circulation decreases gradually with height from 900 hPa and changes into anticyclonic circulation above 250 hPa. Meanwhile, the composite cyclonic circulation has a warm core with a maximum around 250 hPa in both the south-north and west-east vertical profiles (Figs. 1c and 1d).
To conclude, the distributions of wind and temperature within the cyclonic circulation are not completely the same as the monsoon gyre in Wu et al. (2013). First, the composited cyclonic circulation is weaker than the composited monsoon gyre. Second, the vertical positions of relative vorticity are a little different. According to Wu et al. (2013), the maximum relative vorticity of the monsoon gyre is located in the center of the gyre at 900 hPa along the south-north or west-east direction. However, the maximum relative vorticity of the cyclonic circulation is located about 700 km east of the cyclonic circulation along the east-west direction and around 600 hPa along the south-north direction. Note that the structure of the monsoon gyre may change from case to case. Due to the different definitions of a monsoon gyre (Lander, 1994; Carr and Elsberry, 1995; Chen et al., 2004; Wu et al., 2013), we still call it cyclonic circulation.
2.2Experimental designIn this study, we employ the non-hydrostatic Advanced Research Weather Research and Forecasting model (version 3.3.1) developed by the NCAR (Skamarock et al., 2008). The model is triple-nested with two-way interaction. The mesh sizes in all three domains are 241 × 241, 241 × 241, and 481 × 481, with horizontal grid sizes of 27, 9, and 3 km, respectively. Stationary domains are used since the vortex-following tool in the model has trouble following a weak vortex during its early stage. There are 35 levels in the vertical direction. The Kain-Fritsch convective scheme is applied to the two outer meshes (Kain and Fritsch, 1993) and an explicit microphysics scheme (Lin et al., 1983) is used in all meshes. The other model physics includes the Yonsei University planetary boundary layer (PBL) scheme and the Monin-Obukhov surfacelayer scheme (Hong et al., 2006). The model is set on a beta plane, and a constant SST of 29℃ is specified. The background environment flow is quiescent. Details regarding the other modeling configuration and the initial vortex structure can be referred to in Cao et al. (2014a).
In order to examine the relationship between the cyclonic circulation and TC formation, five experiments are performed. In the control experiment, an initial vortex with a maximum tangential wind of 8 m s-1 at a radius of 150 km is placed in a resting environment (hereafter CTL). In the remaining four experiments, dynamic variables including zonal wind, meridional wind, surface pressure, geopotential height, and temperature anomalies associated with the cyclonic circulation anomalies are set to the background state. The removal of specific humidity anomalies is done to ensure constant humidity in the horizontal direction. Then, the initial vortices are placed in four different positions within the cyclonic circulation: in the south (16°N, 122°E), center (20°N, 122°E), north (24°N, 122°E), and east (19°N, 130°E) of the cyclonic circulation. These four experiments are identified as B16N, B20N, B24N, and B130E, respectively. Thus, the sole difference between CTL and the other four experiments is the background dynamic fields, which induce dynamic and thermodynamic effects. Due to the rapid development of the vortex in B24N, the model difference between B24N and the remaining four experiments is that the mesh sizes of the three domains in B24N are 241 × 241, 241 × 241, and 541 × 541, with a larger innermost domain in case the TC development is affected by the lateral boundary. In fact, we also perform an experiment in which an initial vortex is placed in the west (18°N, 115°E) of the cyclonic circulation. It is found that the development of the vortex is similar to that in the CTL case (figure omitted).
Figure 2 shows the initial cyclonic circulation, the vertical zonal wind shear between 200 and 850 hPa, and the different positions in which the initial weak vortices are imposed. At the initial time, the vertical zonal wind shears near the weak vortices are generally less than 3.5 m s-1. Therefore, the diversity of vortex development in the different positions of cyclonic circulation can be attributed to reasons other than the weak vertical wind shear. We investigate these reasons in the following section.

|
| Figure 2 The initial wind field (vectors), vertical zonal wind shear (contours), and positions of weak vortices in the large-scale cyclonic circulation. The black, purple, blue and green lines indicate the tracks of the vortices from t=0 h to t=72 h at an interval of 6 h in the B16N, B20N, B24N, and B130E runs, respectively (see text in Section 2.2 for details of these runs). |
Figure 3 shows the simulated wind fields at 850 hPa at t=0, 48, and 96 h in CTL, B16N, B20N, B24N, and B130E, from 27-km simulation data. Due to the large-scale cyclonic circulation field involved, the initial wind fields of vortices are different in these five cases (Figs. 3a, 3d, 3g, 3j, and 3m). The initial maximum winds are located in the south of the vortices in B16N and B20N (Figs. 3d and 3g), while they are located in the north of the vortex in B24N (Fig. 3j). In B130E, the initial maximum winds are located in the southeastern part of the vortex (Fig. 3m). With the beta effect, a wavenumber-1 beta gyre is induced (Fiorino and Elsberry, 1989), causing a northwest-southeast orientation of the vortices, as shown at t=48 h in CTL, B20N, B24N, and B130E (but not B16N) (Figs. 3b, 3e, 3h, 3k, and 3n). Meanwhile, the maximum winds located in the northeastern part of the vortex behave differently due to the interaction between cyclonic circulation and the vortex in these four cases. For example, the maximum wind in B24N is the most obvious due to the superposition of beta gyres and easterly winds of cyclonic circulation (Fig. 3k). In contrast, the maximum winds in B16N are still located in the south of the vortex due to the superposition of the vortex and the westerly winds of cyclonic circulation in B16N (Fig. 3e). Under the steering westerly winds, the vortex moves eastward slightly in the early stage (Fig. 2). The maximum winds decrease in the south and concentrate mainly in the southeastern part of the vortex. Meanwhile, it is found that the westerly winds of the cyclonic circulation have decreased (Fig. 3e). This may be associated with the nonlinear interaction between the cyclonic circulation and vortex. In B20N and B130E, the distributions of the wind fields are similar and the maximum winds in the northeastern part are a little weaker than in B24N (Figs. 3h and 3n). This indicates that the large-scale cyclonic circulation has a larger effect on the development of the vortex when the vortex is located in the center and northeastern parts of the cyclonic circulation. At t=96 h, the maximum winds are all located in the northeastern parts of the vortices in these five runs under the beta effects, accordingly with different intensity (Figs. 3c, 3f, 3i, 3l, and 3o).

|
| Figure 3 The wind field (vectors) and wind speed (color-shaded) for the vortex at 850 hPa at t=0 h (left panels), 48 h (middle panels) and 96 h (right panels) for (a-c) CTL, (d-f) B16N, (g-i) B20N, (j-l) B24N, and (m-o) B130E from 27-km simulation data. The point (0, 0) represents the merged cyclonic circulation center. |
Figure 4 shows the temporal evolutions of the minimum sea level pressure (MSLP) and maximum azimuthal-mean wind at the height of 10 m in the five experiments. In the first 60 hours, the vortices rarely develop in all five cases, followed by different formation sequences. The vortex placed in the north of the cyclonic circulation develops fastest, while the vortices placed in the center and east of the cyclonic circulation have similar evolutionary pathways, but develop a little slower than that in B24N after t=60 h. However, the vortex placed in the south of the cyclonic circulation develops slowest among all the experiments. At t=108 h, strong TCs appear with the MSLP of 947 hPa in B24N and with the MSLP of 967 hPa both in B20N and B130E (Fig. 4a). In contrast, the vortex in B16N fails to develop into a strong TC throughout the whole 108-h simulation, with the MSLP of 1003 hPa at t=108 h. Meanwhile, the vortex in CTL develops moderately with the MSLP of 980 hPa in the end. If the maximum azimuthal-mean wind at 10 m greater than 15 m s-1 is defined as the tropical cyclogenesis time, TC genesis appears at t=78 h in B24N, at t=87 h both in B20N and B130E, and at t=99 h in CTL, respectively. Due to the similar evolution of the vortices in B20N and B130E, we focus mainly on the vortex development in B130E in the subsequent analysis.

|
| Figure 4 Temporal evolution of the (a) minimum sea level pressure (MSLP; hPa) and (b) maximum azimuthal-mean wind speed (MAMW; m s-1) at 10 m in CTL (black line), B16N (red line), B20N (blue line), B24N (green line), and B130E (orange line). The abscissa represents time (h) and the ordinate corresponds to the intensity. The black dashed line in (b) denotes the tropical cyclone genesis time when the maximum azimuthal-mean wind speed exceeds 15 m s-1. |
After 108 h into the integration, the simulated TCs in CTL, B20N, B24N, and B130E have a vertical structure typical of a mature TC. Figure 5 displays the vertical-radial cross-section of the azimuthalmean tangential wind, radial wind, and diabatic heating fields in CTL, B24N, and B130E. The TCs in the three experiments are all characterized by a tilted eyewall and a salient “in-up-out” secondary circulation. In B24N, the maximum tangential wind reaches 60 m s-1 at a radius of nearly 40 km at 900 hPa (Fig. 5b). Meanwhile, the strong radial inflow and outflow layers occur in the PBL and upper level, respectively (Fig. 5e). The structures of axisymmetric TC wind and heating fields in CTL and B130E are similar to those in B24N, but with apparently weaker magnitudes, particularly in the former (Figs. 5a, 5c, 5d, and 5f). For instance, the maximum tangential winds are only 24 and 50 m s-1 in CTL and B130E, respectively (Figs. 5a and 5c).

|
| Figure 5 The vertical-radial cross-section of azimuthal-mean tangential wind (contours; m s-1) and diabatic heating (color-shaded; 10-3 K s-1) in (a) CTL, (b) B24N, and (c) B130E at t=108 h. (d-f) As in (a-c), except for the radial wind (contours; m s-1). |
These experiments indicate that the tropical disturbances located in the center and northeastern parts of the cyclonic circulation are favorable to form into TCs, and those located in the south part are unfavorable. Note that this numerical result is different to the composite observational analysis of Wu et al. (2013). In the numerical initial condition, the vertical wind shears are relatively weak in any direction of cyclonic circulation. Therefore, there may be other processes that contribute to the different formation rates of TCs within the different positions of cyclonic circulation. In the next section, we seek to understand the specific dynamic and thermodynamic processes through which the cyclonic circulation influences the development of the vortex.
4Effect of cyclonic circulation on development of the vortexIn the previous section, the simulated wind fields at 850 hPa at t=0, 48, and 96 h in the five cases from 27-km simulation data are discussed roughly. The marked difference at t=48 h shown in Fig. 3 warrants a more detailed analysis. In Figs. 6-9, the simulated wind fields at 850 hPa are shown in CTL, B16N, B24N, and B130E from the 3-km simulation data with a smaller time interval from t=0 h to t=60 h. In CTL, the wind flows are axisymmetric around the vortex center at the initial time (Fig. 6a). However, after 12 h into the integration, the vortex becomes asymmetric under the beta effect, with the maximum wind located in the east side of the vortex (Fig. 6b). This is due to the cyclonic-vortex-induced beta gyre with a negative vorticity anomaly to the east of the vortex center and positive vorticity anomaly to the west of the vortex center at the lower level (Holland, 1983). Meanwhile, the PBL friction leads to a decrease in tangential wind at t=24 h (Fig. 6c). Afterwards, the primary cyclonic vortex can rotate the counterrotating beta gyre cyclonically, which are oriented in the northeast-southwest direction. Therefore, the maximum winds are located in the northeastern part of vortex (Figs. 6d-f). In B16N, meanwhile, the initial maximum winds are located in the south-southeast of vortices due to the westerly winds of large-scale cyclonic circulation (Fig. 7a). At t=12 h, the maximum winds shift to the southeast due to the advection effect of cyclonic circulation (Fig. 7b). Likewise, the southwesterly winds in the southeast of the vortex feature an obvious decrease at t=24 h (Fig. 7c). This may be due to surface friction and the southeasterly ventilation flow over the vortex center against the westerly winds (Holland, 1983). The southeasterly ventilation flow is associated with the northeast-southwest orientation of beta gyres. As shown in Fig. 3b, the large-scale westerly winds are decreased. Therefore, the interaction between large-scale westerly winds of cyclonic circulation and the vortex is decreased and the vortex-induced beta effect is dominant afterwards (Figs. 7d-f).

|
| Figure 6 The wind field (vectors) and wind speed (color-shaded) for the vortex at 850 hPa from t=0 h to t=60 h at intervals of 12 h in the CTL run from 3-km simulation data. |

|
| Figure 7 As in Fig. 6, but in B16N. |

|
| Figure 8 As in Fig. 6, but in B24N. |

|
| Figure 9 As in Fig. 6, but in B130E. |
In contrast, the initial maximum winds are located in the north-northwest of the vortex in B24N because of the easterly winds of large-scale cyclonic circulation (Fig. 8a). In the following 24 hours, the vortex moves westward under the steering easterly winds, but with little development (Figs. 2, 8b, and 8c). However, under the superposition of beta gyres and easterly winds of cyclonic circulation, the asymmetric winds in the north of the vortex develop remarkably. At t=36 h, the strong wind regiment just appears to be highly scattered in the north within the 120-240-km radial band from the vortex center (Fig. 8d), and then the winds more than 12 m s-1 denoted by the red area cover a large extent in the northeast quadrant of the vortex at t=60 h (Fig. 8f). In B130E, meanwhile, the initial maximum winds are located in the southeast of the vortex (Fig. 9a). At t=24 h, the southerly winds in the east of the vortex are characterized by an obvious decrease (Fig. 9c). In the following 24 hours, the vortex moves northward and then northwestward (Fig. 2). Thus, the asymmetric winds of the vortex in B130E evolve in a similar way to those in B24N after t=36 h, but with a weaker magnitude (Figs. 9d-f). Based on Figs. 6-9, we conclude that, although the MSLP and maximum azimuthal-mean wind at 10 m are similar in the first 60 hours of integration, as shown in Fig. 4, among the five experiments, the asymmetric wind fields exhibit large differences, especially after t=36 h when the maximum winds are all located in the northeastern parts of the vortices under the beta effects.
The asymmetric distribution of the 850-hPa wind of the vortex in the five experiments can be further examined and compared, as follows. In cylindrical coordinates, any variable can be decomposed into a symmetric part that is equal to the azimuthally averaged variable and a purely asymmetric part that can be further decomposed into a Fourier series. Figure 10 displays the wavenumber-1 asymmetric 850-hPa wind fields at t=12 and 48 h in four cases from the 3-km simulation data. In CTL, the location of positive anomalous winds beyond 120 km is changed from the eastern part at t=12 h to the northeastern part at t=48 h (Figs. 10a and 10b). In B16N, the positive wind anomalies are always located in the southeastern part of the vortex due to the westerly wind effect of the cyclonic circulation (Figs. 10c and 10d); while in B24N, it is always located in the northeastern part of the vortex due to the easterly wind effect of the cyclonic circulation, with obviously greater asymmetry compared with the other three cases (Figs. 10e and 10f). In B130E, the change of positive wind anomalies beyond 120 km is consistent with that in CTL, but with greater intensity (Figs. 10a and 10b, Figs. 10g and 10h). It can be seen that the distribution of asymmetric winds is basically consistent with that of total winds, as shown in Fig. 3. This indicates that the intensity of the asymmetric winds is closely associated with the development of the vortex. Larger asymmetric winds induce a stronger TC formation rate during the early stage. This is consistent with the study of Cao (2015), in which it was shown that uniform easterly flows can result in a faster TC genesis rate compared with uniform westerly flows.

|
| Figure 10 The wavenumber-1 asymmetric 850-hPa wind field (vectors) and wind speed (color-shaded; m s-1) at t=12 h (the first and third columns) and 48 h (the second and fourth columns) in (a, b) CTL, (c, d) B16N, (e, f) B24N, and (g, h) B130E. The point (0, 0) indicates the center of the 850-hPa cyclonic circulation. |
Figure 11 shows the surface heat fluxs and 10-m wind from t=24 h to t=72 h at a 24-h interval in CTL, B16N, and B24N. In the initial 24 hours, the wind and heat flux are relatively symmetric (Fig. 11a). After t=48 h, the surface heat flux and wind are maximized in the northeastern part of the vortex due to the beta effect (Fig. 11b). At the initial time, the near-surface inflow begins to develop because the surface friction decreases the tangential wind and leads to a gradient wind imbalance. This can induce ascending motion and upward moisture transport, which contribute to convective heating in the maximum region of heat flux. This heating can further strengthen the low-level inflow by changing the temperature and surface pressure. Meanwhile, the diabatically induced radial inflow can bring angular momentum into the inner region of the vortex, leading to an increase in tangential wind. The increased tangential wind near the surface would further enhance surface heat flux and thus enhance convection and diabatic heating. This is a positive feedback mechanism resulting in the development of the vortex. From t=48 h to t=72 h, the surface heat flux in the northeastern part of the vortex increases gradually (Fig. 11c). In B16N, it can generate maximum wind flow and surface heat flux on the south side of the vortex in the initial 24 hours due to the large-scale westerly winds (Fig. 11d). However, at t=48 h the wind increased by the beta effect is dominant and the maximum of surface heat flux gradually moves to the north side of the vortex (Fig. 11e). As shown in Fig. 2, the change of the background flow associated with the vortex movement in B16N is secondary to the change of the asymmetry, because the vortex in B16N propagates to a weaker background flow. At t=72 h, the surface heat flux is obviously weaker compared with CTL (Figs. 11f and 11c). As a result, the vortex in B16N develops very slowly, as shown in Fig. 4. Compared with CTL, in the initial 24 hours, the surface heat flux in B24N has been asymmetric with the maximum in the north side of the vortex due to the effect of large-scale easterly winds (Fig. 11g). Subsequently, the greater surface heat flux will accelerate the positive feedback (Fig. 11h). At t=72 h, the surface heat flux in B24N is obviously greater and broader than that in CTL (Figs. 11i and 11c), thus resulting in a stronger TC (Fig. 4). In B130E, at t=24 h, the maximum wind flow and surface heat flux are located in the east side of the vortex due to the large-scale southerly winds (Fig. 11j). In the following 48 h, the asymmetric surface heat flux of the vortex in B130E displays a similar evolution as that in B24N, but with a weaker magnitude (Figs. 11h, 11i, 11k, and 11l). The surface heat flux can supply moisture into the atmosphere from the ocean, leading to a similar distribution of mid-level humidity and maximum reflectivity in the four runs (figures omitted).

|
| Figure 11 The surface heat fluxes (shaded; W m-1) and 10-m winds (vectors; m s-1) at t=24 h (left), t=48 h (middle), and t=72 h (right) in (a-c) CTL, (d-f) B16N, (g-i) B24N, and (j-l) B130E. |
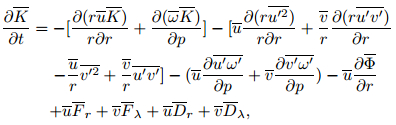
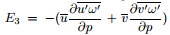
Nolan et al. (2007) suggested that the symmetric response of the vortex to the asymmetric motions is smaller than the symmetric response to the azimuthally averaged heating. The discussion above focuses on the asymmetric winds. Next, we examine the differences in the vortices in four runs from the perspective of symmetric kinetic energy. Figure 12 shows the time-radial cross-section of azimuthal-mean kinetic energy 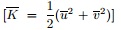
|
where EKEt=


|
| Figure 12 Time-radius cross-section of azimuthal-mean kinetic energy (m2 s-2) at 850 hPa for (a) CTL, (b) B16N, (c) B24N, and (d) B130E from t=0 h to t=84 h. |
We calculate the radial (30-150 km) and vertical (1000-850 hPa) averaged kinetic energy budget averaged from t=60 h to t=72 h to compare the difference of the respective terms in the lower-level kinetic energy equation in the four runs (Fig. 13). The tendency of the kinetic energy for the azimuthal-mean vortex is similar to the evolutions of the maximum azimuthal-mean wind, as shown in Fig. 4. In the four runs, the two major components leading to the development of azimuthal-mean kinetic energy in the lower level are the barotropic conversion of eddy kinetic energy to mean kinetic energy and the mean potential energy conversion into mean kinetic energy, while the flux divergence of the mean kinetic energy due to the azimuthal-mean vortex and the baroclinic conversion contribute negatively to the mean kinetic energy development. The result of the kinetic energy budget in the whole vertical column is almost similar to Fig. 13, but with weaker magnitude (figure omitted).

|
| Figure 13 The radial (30-150 km) and vertical (1000-850 hPa) averaged kinetic energy budget for CTL, B16N, B24N, and B130E, averaged from t=60 h to t=72 h. |
Based on the four experiments, it is found that the stronger wavenumber-1 wind established in the northeastern quadrant could lead to the faster development of azimuthal-mean tangential wind through the energy conversion. Based on the analysis above, we hypothesis the following processes. In CTL, the asymmetric circulation induced by the beta effect peaks in the northeastern quadrant of the vortex. When the cyclonic circulation is involved, the interaction between the cyclonic circulation and vortex induces the difference of the wavenumber-1 winds. The strong wavenumber-1 winds in the northeastern quadrant contribute positively to the mean kinetic energy development through the barotropic conversion (E2). Meanwhile, the strong wind induces strong surface heat flux and thus more humidity in the atmosphere in the northeast of the vortex (Fig. 11). The nearsurface inflow induces the ascending motion and more upward moisture transport, and thus facilitates to result in convective heating in the maximum region of heat flux. The heating can further strengthen the lowlevel inflow by changing the temperature and surface pressure. A part of the convective heating could be transformed into the kinetic energy of the symmetric wind field, leading to the increase of tangential wind at the lower level (E4). Thus, the barotropic conversion of eddy kinetic energy to mean kinetic energy and the mean potential energy conversion into mean kinetic energy are the two major components leading to the development of symmetric kinetic energy in the lower level, as shown in Fig. 13. The increased tangential near-surface wind would further enhance surface heat flux, and thus enhance convection and diabatic heating. This is a positive feedback mechanism resulting in the development of the initial weak vortex.
When the initial vortex is placed in the south of the cyclonic circulation (B16N), the interaction between the cyclonic circulation and vortex delays the vortex from establishing the positive feedback. On the contrary, when the initial vortex is placed in the north of the cyclonic circulation (B24N), the superposition of beta gyres and easterly winds of the cyclonic circulation induces stronger wavenumber-1 winds in the northeastern part of vortex than in CTL. The asymmetric wavenumber-1 wind is closely associated with the symmetric tangential wind, thus accelerating the positive feedback and facilitating development into a stronger TC than in CTL. Meanwhile, when the initial vortex is placed in the center and eastern part of the cyclonic circulation (B20N and B130E), the vortex development is between those in CTL and B24N. In general, the large-scale cyclonic circulation favors the tropical disturbances located in the center and northeastern quadrants of the cyclonic circulation to form into strong TCs.
5Summary and discussionMany previous studies have suggested the importance of cyclonic circulation flows in providing favorable large-scale background conditions for TC formation over the WNP (e.g., Ritchie and Holland, 1999; Wu et al., 2013); however, the specific dynamical processes, through which the cyclonic circulation flow influences tropical cyclogenesis, are not well known. In the present study, we expand upon the previous work of Cao et al. (2014a) by designing a group of idealized numerical experiments to investigate how the cyclonic circulation during the active phase of monsoon trough intraseasonal oscillation impacts the development of the vortex, which is imposed in different positions of the cyclonic circulation.
The results of the experiments show that weak vortices in the center and northeast of the cyclonic circulation are favorable to form into TCs, whereas vortices in the south of the cyclonic circulation develop slowly. We find that when the initial vortex is placed in the southern part of the cyclonic circulation, the wind of the vortex begins to develop in the south due to the effect of the westerly winds of the cyclonic circulation. However, due to the interaction between the cyclonic circulation and vortex, the westerly winds of the cyclonic circulation gradually decrease and thus the vortex is contributed mainly by the beta effect. Thus, the vortex needs to take more time to establish positive feedback and becomes weaker compared with that in CTL. On the contrary, when the initial vortex is placed in the northern part of the cyclonic circulation, the superposition of the beta effect and easterly winds of the cyclonic circulation induces larger wavenumber-1 winds in the northeastern parts of the vortex than in CTL. The greater asymmetric wavenumber-1 wind is closely associated with the symmetric tangential wind, thus accelerating positive feedback and facilitating development into a stronger TC. Meanwhile, when the initial vortex is placed in the center and eastern parts of the cyclonic circulation, the development of the vortex is between that in CTL and B24N. This indicates that the stronger wavenumber-1 wind established in the northeastern quadrant could lead to the faster development of tangential wind through the energy conversion during the formation stage of the vortex.
A number of previous studies have indicated that purely asymmetric perturbations could lead to intensification of the symmetric circulation (Shapiro, 2000; Enagonio and Montgomery, 2001). However, other studies have suggested that the symmetric response to the purely asymmetric part of the heating can have a negative impact on the intensity of the vortex (Nolan et al., 2007). Therefore, it is necessary to quantify the relative role of the symmetric response to the purely asymmetric motions, and the symmetric response to the symmetric motions, in the intensification of the vortex, in future work. In the meantime, sensitivity experiments with the vortex inserted at different distances from the cyclonic circulation center in four directions will be examined next.
Acknowledgments: The authors thank the two anonymous reviewers, editors, and Prof. Tim Li for their constructive suggestions, which helped improve the paper.| DOI:10.3878/AOSL20150042 Cao Xi ,2015: An idealized numerical study of the ef-fects of uniform zonal winds on tropical cyclogen-esis. Atmos. Oceanic Sci. Lett. , 8 , 345–351. DOI:10.3878/AOSL20150042 |
| DOI:10.1175/JAS-D-13-0407.1 Cao X., Li T., Peng M., et al ,2014a: Effects of the monsoon trough intraseasonal oscillation on tropi-cal cyclogenesis over the western North Pacific. J. Atmos. Sci. , 71 , 4639–4660. DOI:10.1175/JAS-D-13-0407.1 |
| DOI:10.1002/2014GL060307 Cao X., Li T., Peng M., et al ,2014b: Effects of monsoon trough interannual variation on tropical cyclogenesis over the western North Pacific. Geophys. Res. Lett. , 41 , 4332–4339. DOI:10.1002/2014GL060307 |
| DOI:10.1175/1520-0493(1995)123<0265:MILTST>2.0.CO;2 Carr L. E., Elsberry R. L. ,1995: Monsoonal in-teractions leading to sudden tropical cyclone track changes. Mon. Wea. Rev. , 123 , 265–290. DOI:10.1175/1520-0493(1995)123<0265:MILTST>2.0.CO;2 |
| DOI:10.1175/1520-0434(2004)019<0776:ROTMGI>2.0.CO;2 Chen T.-C., Wang S.-Y., Yen M.-C., et al ,2004: Role of the monsoon gyre in the interannual variation of tropical cyclone formation over the western North Pacific. Wea. Forecasting , 19 , 776–785. DOI:10.1175/1520-0434(2004)019<0776:ROTMGI>2.0.CO;2 |
| DOI:10.1175/1520-0450(1979)018<1016:LFIOAT>2.0.CO;2 Duchon C. E. ,1979: Lanczos filtering in one and two dimensions. J. Appl. Meteor. , 18 , 1016–1022. DOI:10.1175/1520-0450(1979)018<1016:LFIOAT>2.0.CO;2 |
| DOI:10.1175/1520-0469(2001)058<0685:TCVCFV>2.0.CO;2 Enagonio J., Montgomery M. T. ,2001: Tropical cyclogenesis via convectively forced vortex Rossby waves in a shallow water primitive equation model. J. Atmos. Sci. , 58 , 685–705. DOI:10.1175/1520-0469(2001)058<0685:TCVCFV>2.0.CO;2 |
| DOI:10.1002/joc.2014.34.issue-1 Feng T., Chen G.-H., Huang R.-H., et al ,2014: Large-scale circulation patterns favourable to tropical cy-clogenesis over the western North Pacific and as-sociated barotropic energy conversions. Int. J. Climatol. , 34 , 216–227. DOI:10.1002/joc.2014.34.issue-1 |
| DOI:10.1175/1520-0469(1989)046<0975:SAOVSR>2.0.CO;2 Fiorino M., Elsberry R. L. ,1989: Some aspects of vortex structure related to tropical cyclone motion. J. Atmos. Sci. , 46 , 975–990. DOI:10.1175/1520-0469(1989)046<0975:SAOVSR>2.0.CO;2 |
| DOI:10.1175/1520-0493(1996)124<2625:TOALMD>2.0.CO;2 Harr P. A., Elsberry R. L., Chan J. C. L. ,1996: Transformation of a large monsoon depression to a tropical storm during TCM-93. Mon. Wea. Rev. , 124 , 2625–2643. DOI:10.1175/1520-0493(1996)124<2625:TOALMD>2.0.CO;2 |
| DOI:10.1175/1520-0469(1983)040<0328:TCMEIP>2.0.CO;2 Holland G. J. ,1983: Tropical cyclone motion:Envi-ronmental interaction plus a beta effect. J. Atmos. Sci. , 40 , 328–342. DOI:10.1175/1520-0469(1983)040<0328:TCMEIP>2.0.CO;2 |
| DOI:10.1175/MWR3199.1 Hong S.-Y., Noh Y., Dudhia J. ,2006: A new vertical diffusion package with an explicit treatment of entrainment processes. Mon. Wea. Rev. , 134 , 2318–2341. DOI:10.1175/MWR3199.1 |
| Kain, J. S., and J. M. Fritsch, 1993:Convective param-eterization for mesoscale models:The Kain-Fritsch scheme. The Representation of Cumulus Convection in Numerical Models. Emanuel, K. A., and D. J. Raymond, Eds., American Meteor Society, Wash-ington DC, 165-170. |
| DOI:10.1175/1520-0477(1996)077<0437:TNYRP>2.0.CO;2 Kalnay E., Kanamitsu M., Kistler R., et al ,1996: The NCEP/NCAR 40-year reanalysis project. Bull. Amer. Meteor. Soc. , 77 , 437–471. DOI:10.1175/1520-0477(1996)077<0437:TNYRP>2.0.CO;2 |
| DOI:10.1175/1520-0434(1994)009<0640:DOAMGA>2.0.CO;2 Lander M. A. ,1994: Description of a monsoon gyre and its effects on the tropical cyclones in the western North Pacific during August 1991. Wea. Forecast-ing , 9 , 640–654. DOI:10.1175/1520-0434(1994)009<0640:DOAMGA>2.0.CO;2 |
| Li, T., 2012:Synoptic and climatic aspects of tropical cyclogenesis in western North Pacific. Cyclones:Formation, Triggers and Control, Chap 3. Oouchi, K., and H. Fudeyasu, Eds., Nova Science Publishers, Inc., 61-94. |
| DOI:10.1007/s00376-013-2282-1 Liang Jia, Wu Liguang, Zong Huijun ,2014: Idealized numerical simulations of tropical cyclone formation associated with monsoon gyres. Adv. Atmos. Sci. , 31 , 305–315. DOI:10.1007/s00376-013-2282-1 |
| Liebmann B., Smith C. A. ,1996: Description of a complete (interpolated) outgoing longwave radiation dataset. Bull. Amer. Meteor. Soc. , 77 , 1275–1277. |
| DOI:10.1175/1520-0450(1983)022<1065:BPOTSF>2.0.CO;2 Lin Y.-L., Farley R. D., Orville H. D. ,1983: Bulk parameterization of the snow field in a cloud model. J. Appl. Meteor. , 22 , 1065–1092. DOI:10.1175/1520-0450(1983)022<1065:BPOTSF>2.0.CO;2 |
| Neumann, C. J., 1993:Global overview. Global Guide to Tropical Cyclone Forecasting, WMO/TD-560, World Meteorological Organization, Geneva, 1.1-1.42. |
| DOI:10.1175/JAS3988.1 Nolan D. S., Moon Y. M., Stern D. P. ,2007: Tropical cyclone intensification from asymmetric convection:Energetics and efficiency. J. Atmos. Sci. , 64 , 3377–3405. DOI:10.1175/JAS3988.1 |
| DOI:10.1175/1520-0493(1999)127<2027:LSPAWT>2.0.CO;2 Ritchie E. A., Holland G. J. ,1999: Large-scale pat-terns associated with tropical cyclogenesis in the western Pacific. Mon. Wea. Rev. , 127 , 2027–2043. DOI:10.1175/1520-0493(1999)127<2027:LSPAWT>2.0.CO;2 |
| DOI:10.1175/1520-0469(2000)057<3645:PVAATC>2.0.CO;2 Shapiro L. J. ,2000: Potential vorticity asymmetries and tropical cyclone evolution in a moist three-layer model. J. Atmos. Sci. , 57 , 3645–3662. DOI:10.1175/1520-0469(2000)057<3645:PVAATC>2.0.CO;2 |
| Skamarock, W. C., J. B. Klemp, J. Dudhia, et al., 2008:A description of the advanced research WRF version 3.NCAR Technical Note NCAR/TN-475+STR. Na-tional Center for Atmospheric Research, Boulder, Colorado, USA. |
| Wang Y. Q. ,2002: Vortex Rossby waves in a numerically simulated tropical cyclone. Part Ⅰ:Overall structure, potential vorticity, and kinetic energy budgets. J. Atmos. Sci. , 59 , 1213–1238. |
| DOI:10.1175/2010JAS3559.1 Wu L. G., Zong H. J., Liang J. ,2011: Observational analysis of sudden tropical cyclone track changes in the vicinity of the East China Sea. J. Atmos. Sci. , 68 , 3012–3031. DOI:10.1175/2010JAS3559.1 |
| DOI:10.1175/JAS-D-12-0117.1 Wu L. G., Zong H. J., Liang J. ,2013: Observational analysis of tropical cyclone formation associated with monsoon gyres. J. Atmos. Sci. , 70 , 1023–1034. DOI:10.1175/JAS-D-12-0117.1 |
| DOI:10.1175/MWR-D-11-00078.1 Wu L., Wen Z. P., Huang R. H., et al ,2012: Possible linkage between the monsoon trough variability and the tropical cyclone activity over the western North Pacific. Mon. Wea. Rev. , 140 , 140–150. DOI:10.1175/MWR-D-11-00078.1 |
| DOI:10.1175/MWR-D-11-00309.1 Yoshida R., Ishikawa H. ,2013: Environmental factors contributing to tropical cyclone genesis over the western North Pacific. Mon. Wea. Rev. , 141 , 451–467. DOI:10.1175/MWR-D-11-00309.1 |