 2016, Vol. 30
The Chinese Meteorological Society
Article Information
- GONG He, HUANG Mei, ZHU Lin, GUO Shengli, SHAO Yaping. 2016.
- Spatial and Temporal Variations of Global Frictional Torque during the Period 1948-2011
- J. Meteor. Res., 30(1): 128-134
- http://dx.doi.org/10.1007/s13351-015-5066-y
Article History
- Received July 27, 2015;
- in final form October 13, 2015


2 Key Laboratory of Ecosystem Network Observation and Modeling, Institute of Geographic Sciences and Natural Resources Research, Chinese Academy of Sciences, Beijing 100101, China;
3 National Satellite Meteorological Center, China Meteorological Administration, Beijing 100081, China;
4 Institute for Geophysics and Meteorology, University of Cologne, Germany
Frictional torque is the torque exerted by the atmosphere on the surface of the solid earth due to friction(Driscoll,2010). It is one of the most important means for angular momentum exchange between these two components of the earth system. For the atmosphere,the tropical easterlies act as angular momentum sources and the midlatitude westerlies as angular momentum sinks(Weickmann and Sardeshmukh, 1994). The variations in atmospheric angular momentum(AAM)influence the earth’s rotation,with possible yet unknown feedbacks on atmospheric circulation(De Viron and Dehant, 1999).
Much is known about the frictional torque and AAM cycle from earlier studies,but the results are not always consistent. In the 1950s,the concept of torque was already used to explain changes in AAM and the earth’s rotation. Oort(1989)used meteorological data for the period 1963–1973 to calculate the meridional profiles of the total surface torque and mountain torque, and later,Peixoto and Oort(1992)gave a more detailed review on torques and the AAM balance. Madden(1995)used data from the ECMWF to estimate the frictional torque from May 1978 to May 1988, and found that on the 50-day timescale,the frictional torque works together with the mountain torque to alter the AAM. In contrast,Egger and Hoinka(2002)reported that these two torques act almost independently. Weickmann(2003)found that frictional torque anomalies are associated with high-latitude SLP anomalies. Studies on frictional torques also suggest that the fluctuations of AAM can be attributed to major climate events,such as ENSO and MJO events(Weickmann et al., 1997; Ponte and Rosen, 1999; De Viron et al., 2001; Egger and Weickmann, 2007).
It is important to study the spatial pattern and temporal(especially long-term)variations of frictional torque to improve underst and ing of angular momentum exchanges between the atmosphere and earth, and the AAM balance. To this end,we estimated the frictional torque for the period 1948–2011 using NCEPNCAR reanalysis data and studied its trend and the likely causes of its long-term variations. In Section 2,the theory of angular momentum balance and the data used are described. The results are presented in Section 3, and interpreted in Section 4. Concluding remarks are given in Section 5.
2. Data and methodThe data used for calculating the frictional torque,including the surface frictional stresses and the wind speed at the 10-m level for the period 1948–2011,were from NCEP-NCAR reanalysis I. The surface frictional stresses data have a temporal resolution of fourtimes per day and a spatial resolution of 192 × 94(Gaussian grid). The wind speed data have a spatial resolution of 2.5°× 2.5°(Kalnay et al., 1996).
The total AAM,Matm,is composed of a georotational component,MΩ,determined by the mass distribution of the atmosphere, and a relative AAM,Mr,determined by the zonal winds(Oort,1989; Weickmann and Sardeshmukh, 1994),i.e.,
where Ω is the earth’s angular velocity,ρ is air density,u is zonal wind,a is the earth’s radius, and ϕ is latitude. The integration is over the entire volume(V)of the atmosphere.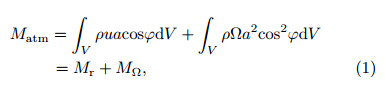
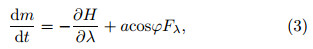
Based on the equation of motion,the angular momentum for unit air mass,m,satisfies(Pu,1994)
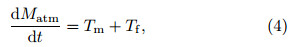
where λ is longitude,p is atmospheric pressure, and Fλ is meridional frictional force. In the pressure coordinate system,Eq.(2)can be written aswhere H is geopotential. An integration of Eq.(3)over the atmosphere giveswhere T m is mountain torque and Tf is frictional torque. The global frictional torque is approximatelywhere τ is the surface stress due to the zonal wind. For a westerly surface wind,τ is negative,the atmosphere speeds up the earth’s rotation, and the angular momentum is transferred from the atmosphere to the earth. For an easterly surface wind,τ is positive,the atmosphere slows down the earth’s rotation, and the angular momentum is transferred from the earth to the atmosphere.3. Results3.1 Seasonal variations of frictional torque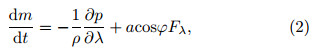
We used the months of December,January, and February(DJF); March,April, and May(MAM); June,July, and August(JJA); and September,October, and November(SON)to represent the seasons of winter,spring,summer, and autumn,respectively. The spatial patterns of the seasonal mean frictional torque,averaged over the study period,are shown in Fig. 1.
 |
| Fig. 1. Seasonal mean friction torque (1016 kg m2 s−2) averaged over 1948–2011 for (a) spring, (b) summer, (c) autumn, and (d) winter. |
For all four seasons,the spatial patterns of the frictional torque have almost the same characteristics: near the equator,where easterlies prevail,the frictional torque is positive,while in the mid and high latitudes,where westerlies prevail,the frictional torque is negative. In the polar region,the distance from an air particle to the earth’s axis is small, and thus the frictional torque is small despite the strong nearsurface easterlies in that region.
In summer and autumn,the positive frictional torque centers are mainly located in the tropics of the Southern Hemisphere(SH)(Figs. 1b and 1c),while in winter and spring,they are located in the Northern Hemisphere(NH)(Figs. 1a and 1d). Over the Asian and African continents around the Indian Ocean,the frictional torque changes from positive in winter to negative in summer,as a consequence of the Indian monsoon.
The meridional profiles of the annual and seasonal mean frictional torques are shown in Fig. 2. The frictional torques vary from strongly positive in winter to negative or nearly zero in summer. This result is in agreement with the earlier study of Madden and Speth(1995),although the range of the variations found in this study is larger. A likely reason for this difference is that the wind stress data used in the latter are the ECMWF 24-h forecasts; it has been found that forecasted wind stress data tend to give more negative frictional torques(Arpe and Esbensen, 1989).
 |
| Fig. 2. Meridional profile of annual and seasonal mean frictional torques (1018 kg m2 s−2), averaged over 1948– 2011. |
Figure 3 shows the spatial and temporal variations of frictional torque anomalies. The anomalies are defined as the zonally aggregated annual frictional torque minus the 1948–2010 mean. Strong variations occurred in the mid and low latitudes of the SH. In the midlatitudes(40°–60°S),the frictional torque anomaly was positive prior to 1985 but turned to be negative after 1985. In the low latitudes(0°–20°S),it was positive prior to 1975 but became negative thereafter. Observations consistent with this finding have been made in the AAM cycle and East Asian monsoon index(Li and Zeng, 2005; Yang et al., 2014). Overall,the frictional torque decreased with time in the mid and low latitudes of the SH.
 |
| Fig. 3. Spatial and temporal distribution of frictional torque anomalies (1018 kg m2 s−2). |
A decline of near-surface wind speed in recent years has been observed in China,the Czech Republic,the United States, and Australia(McVicar et al., 2008; Brázdil et al., 2009; Pryor et al., 2009; Yang et al., 2012). It has been reported that wind speed declined by 5%–15% in the midlatitudes of the NH between 1979 and 2008(Vautard et al., 2010). Figure 4a compares the variations of global frictional torque with global-mean zonal wind at 10 m(U10m hereafter)over 1948–2011. As seen,the stronger the wind,the larger the absolute value of frictional torque. During 1948–1972,U10m was easterly but its magnitude was decreasing, and correspondingly,the frictional torque was positive but decreasing. After 1972,westerly wind steadily increased,reaching a maximum of 0.14 m s−1 in 1994; correspondingly,the frictional torque became more negative and reached its lowest value in 1994. Since 1994,the westerly wind weakened, and the frictional torque gradually increased.
 |
| Fig. 4. (a) Frictional torque and global-mean zonal wind at 10 m (U10m). (b) Cross-correlation coefficients between the frictional torque at time t and global-mean zonal wind at time (t + k), where k is the time lag in yr. |
The above discussion confirms that frictional torque and global mean zonal wind speed are closely(negatively)correlated,as expected. The negative cross-correlation between the two quantities is shown in Fig. 4b. The maximum of the correlation coefficient occurs at zero-time lag,reaching –0.89. With time lag,the correlation coefficients are smaller.
4.2 Zonal wind speed and frictional torque indifferent latitudesIn order to study the spatial pattern of correlations between the frictional torque and near-surface zonal wind,we divided the earth’s surface into six latitudinal zones of 0°–30°,30°–60°, and 60°–90° in both hemispheres. Figure 5 compares the time series of U10m(annually averaged)with the integrals of the frictional torque in these zones. Obviously,the frictional torque changes simultaneously with the wind.
 |
| Fig. 5. Five-year running mean of zonal wind (m s−1; solid line) and frictional torque (1018 kg m2 s−2; dashed line) for different latitudinal zones: (a) 0°–30°N, (b) 30°–60°N, (c) 60°–90°N, (d) 0°–30°S, (e) 30°–60°S, and (f) 60°–90°S. |
In the NH low latitudes,the averaged easterly wind speed fell between –2.2 and –2.0 m s−1 and fluctuated quasi-periodically with a period of around 10 years(Fig. 5a). It reached minima in 1952,1974,1989, and 2004, and maxima in 1966,1982, and 1996. The frictional torque for this zone fell between 18.5 and 21.5 Hadley units(1 Hadley unit=1018 kg m2 s−1), and fluctuated similarly to the wind speed.
In the SH low latitudes,the averaged easterly wind fell between –3 and –2.7 m s−1. It strengthened before the 1960s and weakened from then until the mid 1980s. It again strengthened between the late 1980s and 2011. The frictional torque of this zone fell in the range of 31–35 Hadley units, and again,it showed similar changes to the wind(Fig. 5d).
In the NH midlatitudes,the westerly wind was about 1.0 to 1.2 m s−1. It increased from the late 1960s to the late 1970s, and remained steady after in the 1980s(Fig. 5b). The frictional torque of this zone ranged between –19.5 and –16.5 Hadley units. The strongest westerly wind of 3.5–4.5 m s−1 occurred in the SH midlatitudes,which showed an increasing trend of about 0.16 m s−1(10 yr)−1(P < 0.0001)during 1948–2011. Only after 1995 did this increasing rate begin to slow down. The frictional torque in this zone ranged between –32.0 and –42.0 Hadley units and decreased with time; and correspondingly,the frictional torque increased(Fig. 5e).
In the northern polar region,the averaged wind was westerly in most years and the wind speed was generally low(between –0.5 and 0.25 m s−1). The frictional torque was also low(–1.2 to –0.2 Hadley units). The westerly wind peaked in the mid 1950s,early 1970s, and early 1990s(Fig. 5c).
In the southern polar region,the wind speed was in the range of –0.9 to –0.5 m s−1. It exhibited two peaks and two valleys before the 1980s and the easterly wind increased after the late 1980s(Fig. 5f). The frictional torque was in the range of 0.6 to 1.6 Hadley units.
By comparing the frictional torques in the different latitudinal zones,we found their magnitudes in the mid and low latitudes to be much larger than those in the polar regions. The magnitude of the frictional torque in the SH is generally larger than that in the NH. This suggests that wind changes in the SH mid and low latitudes play a dominant role in the variations of frictional torque on the global scale. The continuous enhancement of the westerlies in the midlatitudes of the SH appears to be the main contributor to the increasingly negative frictional torque globally. After 1995,the westerly wind weakened while the easterly wind strengthened in the SH low latitudes,corresponding to a frictional torque in that area.
5. ConclusionsIn this paper,we used NCEP-NCAR reanalysis data to estimate the spatial and temporal variations of global frictional torque and studied its relationship with wind speed for the period 1948–2011. The following conclusions can be drawn:
(1)The pattern of frictional torque exhibits significant seasonal variation. In boreal summer and autumn,a positive frictional torque center is located in the SH low latitudes,which moves to the NH low latitudes in winter and spring. The Indian monsoon has a strong effect on this relocation of the frictional torque center.
(2)Regarding the long-term frictional torque distribution,large variations occur in the mid(40°–60°S) and low(0°–20°S)latitudes of the SH. In the midlatitudes,the frictional torque anomaly was positive prior to 1985 but negative thereafter. In the low latitudes,it was positive prior to 1975 and has been substantially negative since that time.
(3)The global frictional torque was in the range of –12 to 10 Hadley units during the study period. It was positive but decreasing during 1948–1972, and then turned to be negative in 1972. It continued to decrease and reached its most negative value in 1994,but has increased since then.
(4)Global frictional torque variations are mainly determined by the zonal winds in the mid and low latitudes of the SH. During the study period,the westerly in the midlatitudes increased after the 1980s,while the easterly decreased.
The innovation of this paper lies in the fact that we used new and longer data series to compute the frictional torque. Also,it reveals the spatial pattern and temporal(especially long-term)variations of frictional torque. Lastly,comparisons were made with zonal wind speed globally and in different latitudes. This is important for underst and ing angular momentum exchanges and optimizing climate models.
Acknowledgments. We thank Prof. Gongbing Peng,Prof. Suxia Liu,Prof. Ziniu Xiao,Dr. Yafei Wang, and Dr. Klaus M. Weickmann for their helpful comments.
| Arpe, K., and S. K. Esbensen, 1989: Surface stresses and latent heat fluxes over oceans in short range forecasts: Their annual and interannual variability and comparison with climatological estimates. Ann. Meteor., 26, 128-130. |
| Brázdil, R., K. Chromá, P. Dobrovolný, et al., 2009: Climate fluctuations in the Czech Republic during the period 1961-2005. Int. J. Climatol., 29, 223-242. |
| De Viron, O., and V. Dehant, 1999: Earth's rotation and high frequency equatorial angular momentum budget of the atmosphere. Surv. Geophys., 20, 441-462. |
| De Viron, O., S. L. Marcus, and J. O. Dickey, 2001: Atmospheric torques during the winter of 1989: Impact of ENSO and NAO positive phases. Geophys. Res. Lett., 28, 1985-1988. |
| Driscoll, S., 2010: The earth's atmospheric angular momentum budget and its representation in reanalysis observation datasets and climate models. Master dissertation, University of Reading, England, UK, 74 pp. |
| Egger, J., and K.-P. Hoinka, 2002: Covariance analysis of the global atmospheric axial angular momentum budget. Mon. Wea. Rev., 130, 1063-1070. |
| Egger, J., and K. Weickmann, 2007: Latitude-height structure of the atmospheric angular momentum cycle associated with the Madden-Julian oscillation. Mon. Wea. Rev., 135, 1564-1575. |
| Kalnay, E., M. Kanamitsu, R. Kistler, et al., 1996: The NCEP/NCAR 40-year reanalysis project. Bull. Amer. Meteor. Soc., 77, 437-471. |
| Li Jianping and Zeng Qingcun, 2005: A new monsoon index, its interannual variability and relation with monsoon precipitation. Climatic Environ. Res., 10, 351-365. (in Chinese) |
| Madden, R. A., and P. Speth, 1995: Estimates of atmospheric angular momentum, friction, and mountain torques during 1987-1988. J. Atmos. Sci., 52, 3681-3694. |
| McVicar, T. R., T. G. Van Niel, L. T. Li, et al., 2008: Wind speed climatology and trends for Australia, 1975-2006: Capturing the stilling phenomenon and comparison with near-surface reanalysis output. Geophys. Res. Lett., 35, L20403. |
| Oort, A. H., 1989: Angular momentum cycle in the atmosphere-ocean-solid earth system. Bull. Amer. Meteor. Soc., 70, 1231-1242. |
| Peixoto, J. P., and A. H. Oort, 1992: Physics of Climate. American Institute of Physics, 241-269. |
| Ponte, R. M., and R. D. Rosen, 1999: Torques responsible for evolution of atmospheric angular momentum during the 1982-83 El Niño. J. Atmos. Sci., 56, 3457-3462. |
| Pryor, S. C., R. J. Barthelmie, D. T. Young, et al., 2009: Wind speed trends over the contiguous United States. J. Geophys. Res., 114, D14105. |
| Pu Yukang, 1994: Basic of the Atmospheric Circulation. China Meteorological Press, Beijing, 57-70. |
| Vautard, R., J. Cattiaux, P. Yiou, et al., 2010: Northern Hemisphere atmospheric stilling partly attributed to an increase in surface roughness. Nature Geosci., 3, 756-761. |
| Weickmann, K., 2003: Mountains, the global frictional torque, and the circulation over the Pacific-North American region. Mon. Wea. Rev., 131, 2608-2622. |
| Weickmann, K., and P. D. Sardeshmukh, 1994: The atmospheric angular momentum cycle associated with a Madden-Julian oscillation. J. Atmos. Sci., 51, 3194-3208. |
| Weickmann, K., G. N. Kiladis, and P. D. Sardeshmukh, 1997: The dynamics of intraseasonal atmospheric angular momentum oscillations. J. Atmos. Sci., 54, 1445-1461. |
| Yang Ping, Shi Wenjing, Xiao Ziniu, et al., 2014: Spatial and temporal variations of atmospheric angular momentum and its relation to the earth length of day. J. Meteor. Res., 28, 150-161. |
| Yang, X. M., Z. X. Li, Q. Feng, et al., 2012: The decreasing wind speed in southwestern China during 1969-2009, and possible causes. Quatern. Int., 263, 71-84. |