 2015, Vol. 28
The Chinese Meteorological Society
Article Information
- WANG Fei, ZHANG Yijun, ZHENG Dong. 2015.
- Impact of Updraft on Neutralized Charge Rate by Lightning in Thunderstorms:A Simulation Case Study
- J. Meteor. Res., 28(6): 997-1010
- http://dx.doi.org/10.1007/s13351-015-5023-9
Article History
- Received 2015-03-11;
- in final form 2015-08-27


2 Laboratory of Lightning Physics and Protection Engineering, CAMS, Beijing 100081
Lightning activity is an important phenomenonof strong convective systems, and has a close relationship with observed atmospheric convection. For example,many researchers have found that the radarecho top of a thunderstorm is related to the lightningrate(Shackford,1960; Jacobson and Krider, 1976;Williams,1985). Based on this correlation,Price and Rind(1992)established a parameterized scheme between the cloud top and lightning rate in a globalnumerical model. Also,the lifting condensation level(LCL)is found to have a very high correlation with thelog value of the lightning rate(Williams et al., 2005;Fuchs et al., 2014), and the combination of dry bulbtemperature and convective available potential energy(CAPE)has an evident correlation with the lightningrate,although the correlation coefficient is not veryhigh(Fuchs et al., 2014). Williams and Stanfill(2002)found that high frequency lightning activity tendedto be observed in thunderstorms with high LCL and moderate CAPE,rather than in thunderstorms withhigh CAPE and low LCL.
The above studies indicate that many parameterscharacterizing strong convection bear a relationshipwith lightning activity. In fact,most of these parameters directly reflect the characteristics of updraft. Observations have shown that the existence of a strongupdraft in the mixed-phase region(–40–0℃)is necessary to produce lightning(Workman and Reynolds, 1949; Williams and Lhermitte, 1983; Dye et al., 1988;Rutledge et al., 1992; Carey and Rutledge, 1996; Petersen et al., 1996,1999; Pickering et al., 1998; Baker et al., 1999; Black and Hallett, 1999; Wang et al., 2009; Heymsfield et al., 2010; Palucki et al., 2011; Yao et al., 2013; Zhang et al., 2013; Reinhart et al., 2014;Wang et al., 2015). Moreover,quantitative observational studies on the role of convective updrafts havebeen carried out. Lang and Rutledge(2002)reportedthat thunderstorms that predominantly produced positive cloud-to-ground lightning were accompanied bya large area of strong updraft(with speed > 20 ms−1). Tessendorf et al.(2005) and Wiens et al.(2005)found a good correlation between the updraft volumewith speed exceeding 10 m s−1 and lightning activity. Deierling and Petersen(2008)found that updraftvolumes above the –5℃ isotherm,with vertical velocities greater than 5 and 10 m s−1,were well correlatedwith mean total lightning activity; the correlation coefficients were 0.93 and 0.92,respectively. They alsoindicated that the relationship between updraft volume and total lightning activity varied as a function oftemperature and ,depending on the temperature,alsowith region. Barthe et al.(2010)also found that themaximum updraft speed correlated well with lightningfrequency only in thunderstorms with a very strongupdraft.
Although the close relationship between updraft and lightning activity has been confirmed by manystudies,it is still not clear as to the mechanism throughwhich updraft affects lightning activity. Much research has focused on the impact of updraft on thecharging process,while other studies have also indicated that updraft should have an evident influenceon the discharging process(Zhang et al., 1999,2003;Miller et al., 2001). However,most of the work carried out on these two problems amounts to logicalspeculation based on observations,because of a lackof direct observations of updrafts and the chargingprocess. Carey and Rutledge(1996)found that thevolume and mass of graupel appearing in the upperpart of a strong updraft correlated closely with thelightning rate,suggesting that updraft may affect thelightning frequency through its impact on the charging process occurring on graupel. Lang and Rutledge(2002)indicated that a strong updraft produced moresuper-cooled water and caused more collision and intensive charging between ice particles,resulting in theclose relationship between updraft and lightning activity. Deierling and Petersen(2008)proposed thatstrengthening of the updraft produces more ice particles in the mixed-phase region, and thus a higher number of collisions with subsequent charge separation,which relate the updraft to the lightning frequencyvia positive correlation. They believed that the relationship between the updraft volume and lightningfrequency is less regime-variant as the cold-cloud active precipitation-based charging zone is approached.Meanwhile,theoretical analysis has indicated that theupdraft area—in particular,the area in the subfreezing layer of cloud—should be related to the generatorcurrent density,which in turn is linked to the electrical activity of the storm(Boccippio,2002).
Lightning frequency is,in many studies,taken tobe the main parameter representative of the intensityof lightning activity. Usually,a thunderstorm withdeeper convection will produce more frequent lightningactivity(McCaul et al., 2009). However,recent observations have also revealed that the lightning frequencyin a particular period is relative to the location of thedeep convective updraft: lightning flashes tend to besmaller and more frequent in and near a strong updraft, and the flashes will show the opposite tendencywhen they are far away from the strong updraft(Carey et al., 2005; Kuhlman et al., 2009; Weiss et al., 2012;Bruning and MacGorman, 2013). Recent research indicates that the flash length scales and flash areasare generally anti-correlated to the lightning flash rate(Mecikalski et al., 2015),reminding us that the lightning frequency cannot represent the characteristics oflightning activity intensity comprehensively. In thispaper,we define RNCL,which is the charge neutralized by lightning flashes on the whole-thunderstormscale in a specific period of time,to represent the in-tensity of lightning activity. This parameter considersthe effects of lightning frequency and flash scales comprehensively, and thus should be more appropriate forthe lightning activity intensity.
Additionally,most previous studies support thepositive influence of updraft on the charging process, and subsequently,the lightning activity. However,some researchers have also found that the relationshipbetween updraft and lightning activity could sometimes vary,or be evident only under certain conditions(Deierling and Petersen, 2008). This suggests that theimpact of updraft on lightning activity is complex, and that present underst and ing is insufficient. Accordingly,the present study first aims to identify themain factors affecting RNCL, and then examine therelationships between updraft and these factors,suchthat the impact of updraft on RNCL can be analyzedcomprehensively. This study is important not only forunderst and ing the relationship between updraft and electrical activity in a thunderstorm,but also for furthering research progress on lightning activity.
2. Model and definitions2.1 ModelThe model used here is a 3D cloud resolutionmodel constructed firstly by Hu and He(1988), and then coupled with charging and discharging processesby Tan et al.(2006). The nonhydrostatic balanceequation is adapted to construct the dynamic framework. The air is treated as a tack free and compressible fluid. Hydrometeors in clouds include five categories: cloud drop,ice crystal,rain drop,graupel, and hail. The sedimentation and the dragging force of allhydrometeors,except for cloud drop,are considered.Twenty seven kinds of cloud microphysical processes,such as evaporation-condensation,coagulation,automatic transformation,nucleation-multiplication, and melting-freezing,are simulated in the model. The initiation field of the model can be established based onsounding data. The convection is initiated by a damp and hot bubble,which is a restricted perturbation fieldwith higher humidity and temperature than the environment added in the low level artificially, and developed according to the calculation result of buoyancy in the vertical motion equation.
Three charging schemes,including the noninductive charging process in the process of collision and rebound between graupel/hail and ice crystal(Gardiner et al., 1985; Pereyra et al., 2000; Tan et al., 2006),the inductive charging process betweengraupel/hail and cloud drop in the dry growth process(Ziegler et al,1991), and the charging process dueto the surface temperature difference in the ice crystal multiplication process(Hallet and Saunders, 1979),are used here to simulate the charging process in thethunderstorm.
In the discharging scheme,the electrical fieldthreshold of lightning initiation was defined by Marshall et al.(1995)as a function of air density,which isrelated to height; the main points of the r and om discharging model proposed by Mansell et al.(2002)areadopted in the discharging scheme; and the propagation of positive and negative leaders and the inductivecharge in the lightning channel are all calculated basedon the concept of the bidirectional leader(Kasemir, 1960,2012). The lightning channel is treated as a goodconductor with resistance when the electrical potentialof a new grid of the lightning channel is calculated byusing the formula:

where φini is the reference potential,usually replacedby the environmental potential value; p is the polarity of charge in the channel; n is the number of pathsegments that the channel has propagated; Einner isthe inner electrical field in the channel,set to a constant of 500 V m−1; and di is the length of every pathsegment. After a new step of the lightning channelis finished,the distribution of the electric field outside the channel is recalculated. The inductive chargedensity within the channel,ρinduced,is calculated asfollows:
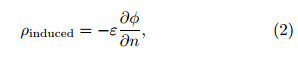
where ε is the dielectric constant of air, and n indicatesthe normal direction of the conductor surface. Whenthere is no probability for development of both ends of the lightning channel,or either end of the channel reaches the border of the simulation domain,thissimulated discharging process will stop. After a discharging process stops,all charges in the channel willbe redistributed according to the proportion of surfacearea of hydrometeors within and near the channel(theoriginal charge on the hydrometeors will be ignored).The redistribution formula(Ziegler and MacGorman, 1994; Mansell et al., 2002)is as follows:
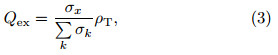
where Qex is the redistribution charge density on thehydrometeor x,σx is the total surface area of the hydrometeor x, is the total surface area of all hydrometeors in this grid, and ρT is the charge densityin one grid of the lightning channel.
The horizontal resolution and vertical resolutionof the model are set to 1 and 0.5 km,respectively. Thetime step is 1 s, and the simulation time is set to 60min.
2.2 DefinitionsIn the analysis,RNCL is the total charge neutralized by all lightning flashes in the thunderstorm,occurring within the specified time interval. CR isthe total charge of one kind of polarity(e.g.,negative)of two polarities obtained by all kinds of hydrometeors in the thunderstorm,in the same time interval,through the non-inductive charging process,the inductive charging process, and the charging process in the ice crystal multiplication process. The total amountof one kind of polarity charge(TAOC)in the thunderstorm is the rest of TAOC in the thunderstorm afterall lightning flashes in the time interval have finished, and CROP in the thunderstorm is the change betweenTAOC in the present time interval and TAOC in theprevious interval. ORCP is the total charge of one kindof polarity(e.g.,negative)on the precipitation fallingout of the thunderstorm in the time interval, and theprecipitation is all hydrometeors that fall down to theheight at or below 1 km. The updraft region is definedas the region where the vertical speed is upward and greater than 1 m s−1.
3. General case descriptionA series of strong convective systems occurredover Beijing from the night of 6 September to themorning of 7 September 2008. Based on the sounding at 1200 UTC 6 September in Beijing,a thunderstorm simulation was carried out by using the 3Dcharging-discharging cloud resolution model. The simulation results are shown in Fig. 1. The first simulated lightning occurs at the 16th minute, and endsat the 31st minute. In total,the simulated lightning activity lasts for about 15 min. The simulatedlightning frequency increases at first,before the 19thminute,when the frequency reaches its peak of 12 flashmin−1, and then decreases(Fig. 1a). The observationof the first thunderstorm cell of the system,based onon SAFIR3000,indicates the lightning frequency of the thunderstorm at the first 15 minutes to be similar to the simulated lightning frequency. The observedlightning frequency also increases at first, and reachesits peak of 14 flash min−1 at the 6th minute after thestart of lighting activity. The observed peak value isvery close to that value of the simulated lightning frequency.
 |
| Fig. 1. (a) Comparison between the observed and simulated lightning flash frequency and (b) charge structure (color scale) along the vertical profile of the positive charge center at the 24th minute, and the distribution (line) of the heights of lightning radiation. Sources from SAFIR3000. |
According to the height distribution of the radiation sources of the lightning observed by SAFIR3000,the peak distribution range is from 9 to 11 km,whichindicates the height of the main positive charge layershould also be located near the height of 9–11 km.Along the vertical profile of the simulated thunderstorm,together with the position of the maximumpositive charge density when the simulated lightingfrequency reaches its peak,the charge structure in thethunderstorm illustrates a dipolar structure,with themain positive charge layer above the main negativecharge layer. The height range of the main positivecharge layer is also from 9 to 11 km,which is the sameas the height range of the main positive charge layerderived from the observation.
The comparisons above suggest that,in terms ofthe lighting frequency and charge structure,the simulated thunderstorm is very similar to the observedthunderstorm in the system. Therefore,the simulatedresults are considered credible and appropriate for further analysis.
In the simulated results,RNCL keeps increasing after lightning activity starts at the 13th minute.From the 23rd to 24th minutes,RNCL reaches a peakof about 408 C min−1; then,it decreases graduallyuntil lightning activity ends at the 31st minute.
4. Simulation result analysisFrom the perspective of microphysical processes,lightning is not only a simple neutralized charge process,but also a complex process of interaction withcharge structure. In fact,lightning is a non-transientprocess. During the process,charge that is widely distributed in the thunderstorm(in spatial terms)mixeswith charge deposited in the lightning channel throughthe processes of turbulent exchange,advection,gravity setting and charging. Part of the charge is neutralized, and part of the residual charge will participate inthe reconstruction of the charge structure before thenext lightning process begins(Tan et al., 2007). However,on larger spatial and longer temporal scales,thecomplexity of an individual lightning process can beneglected if the balance between the source and remitof the charge in the whole thunderstorm is considered;only the overall result of all lightning in the thunderstorm within a particular time interval can be shown.The source and remit of the charge with one kind ofpolarity in a thunderstorm should be balanced,as inthe following formula:

where Qt+∆t and Qt are TAOC at t + ∆t and t,respectively; Qchar is the charge produced by all kindsof charging processes at ∆t; Qout is the charge fallingout of the thunderstorm with precipitation at ∆t; and Qneu is the charge neutralized by all lightning flashesin the thunderstorm occurring at ∆t. Equation(4)can be transformed into Eq.(5)as follows:
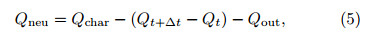
which shows that RNCL(Qneu)is principally influenced by three factors: CR(Qchar),CROP(Qt+∆t −Qt), and ORCP(Qout). The impact of updraft onthese three factors will be analyzed next.
4.1 CRThe model used in this study includes three kindsof charging processes: the non-inductive charging process during the collision and rebound between graupel/hail and ice crystal(Gardiner et al., 1985); the inductive process between graupel/hail and cloud drop(Ziegler et al,1991); and the charging process during ice crystal multiplication(Hallett and Saunders, 1979). Although these three charging processes areonly part of all charging processes in the thunderstorm,many studies have demonstrated that at leastthe first two charging processes are the main chargingprocesses generating most of the charge in the thunderstorm. In particular,the non-inductive chargingprocess considered here should be the most important charging process in the thunderstorm(Takahashi, 1978,1984).
The simulation verifies that the CR of the noninductive charging process during the lightning activity is considerably greater than the CRs of the inductive charging process and the ice crystal multiplication charging process(Fig. 2a). The mean CR of thenon-inductive charging process is about 6.54 × 10⁹nC s−1,which is almost three times the mean CR ofthe inductive charging process. Even from the 17th to20th minutes,the CR of the non-inductive chargingprocess is one order of magnitude higher than the CRof the inductive charging process. The mean CR ofthe ice crystal multiplication charging process is thesmallest; the magnitude is only 107 nC s−1,whichis much less than the first two CRs. This indicatesthat the CR of the non-inductive charging process isdominant,at least during the time of main lightningactivity. Therefore,using the CR of the non-inductivecharging process to represent the overall CR duringlightning activity should be reasonable.
 |
| Fig. 2.(a) Efficiencies of three types of charging mechanism and (b) evolution of the updraft volume and non-inductive charging rate. |
A comparison of the updraft volume and the CRof the non-inductive charging process is illustrated inFig. 2b. It reveals that they have a similar trend:before the 19th minute,they keep increasing. Then,after the 19th minute,both of them begin to decrease.Statistically,there is good correlation between them;the correlation coefficient is 0.87. This suggests thatthe updraft volume affects the intensity of the CR ofthe non-inductive charging process,which process isrepresentative of the total CR in the thunderstormduring lightning activity. The positive correlation between the CR of the non-inductive charging process and the updraft volume reflects the fact that the CRas a whole is also positively correlated with the updraftvolume. This result is coincident with many observations,in which researchers have found good correlationbetween the updraft volume and lightning frequency(Tessendorf et al., 2005; Wiens et al., 2005; Deierling and Petersen, 2008; Barthe and Barth, 2008; Barthe et al., 2010).
The spatial relationship between the region withthe non-inductive charging process and the updraft(Fig. 3)indicates that:(1)The main non-inductivecharging process occurs in the top part of the updraftwhen the updraft is strong(Fig. 3a);(2)The mainnon-inductive charging process still occurs near thetop part of the updraft when the updraft begins toweaken and the vertical channel of the updraft becomes gradually inclined(Fig. 3b). However,the region with the non-inductive charging process becomeswider and its center starts to deviate to the center ofthe updraft in the horizontal direction,although anobvious charging process still occurs around the coreof the updraft;(3)The main non-inductive chargingprocess still occurs over the region with weak updraftwhen the updraft weakens considerably(Fig. 3c), and the region with the non-inductive charging process and the region with the updraft show evident separation inthe horizontal direction;(4)When the updraft continues to weaken and the vertical channel of the updraftalmost disappears,the region with the evident noninductive charging process also lessens until it disappears,but it is still distributed near the region with a certain updraft speed(Figs. 3d–f).
 |
| Fig. 3. Charging rate (contours; absolute charging rate > 0.01 nC m−3 s−1) and wind field (vectors; only winds with speed greater than 1 m s−1 are shown) in the profile of the non-inductive charging rate center at the (a) 13th, (b) 16th, (c) 19th, (d) 22nd, (e) 25th, and (f) 28th minute. |
The region with the non-inductive charging process should bear a close relationship with the updraftregion. Indeed,when a strong updraft exists,themain region with the non-inductive charging processis always located in and near the updraft region. Despite the evident updraft disappearing and the regionwith the non-inductive charging process not coincidingwith the updraft region spatially,the non-inductivecharging process nevertheless occurs near the regionwith weak updraft speed. This should be the reasonthat causes updraft to correlate well with the CR ofthe non-inductive charging process. This correlationshould lead to a positive influence of updraft on thenon-inductive charging process.
4.2 CROPThe charging process on hydrometeors primarily occurs within and near the region of updraft.Charged hydrometeors are carried to a wider region by air transport. This makes the distribution regionof charge become wider and wider, and the processshould bring about the relationship between updraft and CROP.
In the case of negative charge in the thunderstorm,the total amount of negative charge reaches apeak of –1.3 × 10¹² nC at the 21st minute,then begins to decrease, and the total amount keeps below 5× 10¹¹ nC near the end of lightning activity(Fig. 4a).The peak CROP for negative charge appears at the16th minute and reaches about 5.5 C s−1.
 |
| Fig. 4. Evolution of the (a) total mass of negative charge on hydrometeors and (b) volumes with negative charge density on hydrometeors greater than 0.1 and 1 nC m−3. |
As we know,the total amount of charge is decided by the volume and density. Here,0.1 and 1 nCm−3 are chosen as criteria of charge density to discussthe relationship of charge density with TAOC and thevolume. The comparisons between TAOC for negativecharge and the volumes with the two kinds of negativecharge density criteria show that the trend of TAOCis obviously consistent with the trend of the volumewith high charge density(Fig. 4): they reach a peakat the same time and correlate well(correlation coefficient: 0.93). The volume with low charge densitykeeps increasing,which is different to the change ofTAOC. This suggests that CROP should have a closerrelationship with the change of the volume with highcharge density.
Meanwhile,the spatial relationship between updraft and the distribution of hydrometeors with negative surface charge(Fig. 5)shows that the first region with negative charge appears in the upper partof the updraft. The distribution region of negativecharge firstly extends in the vertical direction, and then spreads horizontally along the outflow near thetop of the updraft. When the updraft is strong enough(Figs. 5a–d),the negative charge distribution regionalso changes evidently; when the evident updraft channel disappears(Figs. 5e–j),the change in the negativecharge distribution region is inconspicuous, and themain change is expressed via a change in shape and height.
 |
| Fig. 5. Profiles of negative charge on hydrometeors and updrafts at the (a) 14th, (b) 16th, (c) 18th, (d) 20th, (e) 22nd, (f) 24th, (g) 26th, (h) 28th, (i) 30th, and (j) 32nd minute. Lines indicate the contours of absolute charge density greater than 0.1 nC m−3. Vectors indicate the wind. |
A comparison between the volume with negativecharge on hydrometeors and the volumes with updraft speeds greater than 1 and 5 m s−1 shows thatthree curves have similar change if time is not takeninto account(Fig. 6). The volumes of both updraftsreach their peak earlier than the volume with negativecharge on hydrometeors. This is reasonable becausewhen the updraft begins to decrease,the region of hydrometeors with negative charge will keep exp and ingunder the influence of the weakening updraft. Consequently,the peak time for the volume with negativecharge on hydrometeors will arrive later than for theupdraft volume.
 |
| Fig. 6. Evolutions of the updraft volumes for w > 1 and w > 5 m s−1, and the updraft volume with negative charge on hydrometeors. |
These results suggest that CROP should havea close relationship with the change of updraft volume. Although they might not be synchronous,theirchanges are similar. This makes updraft have a positive impact on CROP. According to Eq.(5),the positive influence of updraft on CROP,(Qt+∆t − Qt),willbe offset by that on CR. This causes updraft to inhibitthe strengthening of RNCL through its positive impact on CROP,although this inhibition should,mostof the time,be weaker than the strengthening effect ofupdraft on RNCL through its impact on CR.
4.3 ORCPBesides the neutralization of lightning,the chargein a thunderstorm could be reduced through precipitation(referred to as cold cloud precipitation),dischargein the upper atmosphere, and so on. Most of thesephenomena have been studied,but quantitative observation is rare, and theoretical studies are primarilyin the exploration stage. Therefore,in this study,only the reduction of charge through precipitation is analyzed.
In the case of negative charge in the thunderstorm,the magnitude of CR is the same as the magnitude of ORCP, and the maximum of ORCP is evenslightly higher than that of CR(Fig. 7). This indicates that the value of ORCP is significant. ORCPwill severely weaken the promoting effect of CR onRNCL, and could even lead to a stop in lightning activity if they occur synchronously. However,in the thunderstorm simulated here,they are not synchronous.The main precipitation occurs after when the lightning activity finishes. During the lightning activity,CR has a significant advantage compared to ORCP.
 |
| Fig. 7.Evolutions of the charging rate by charging mechanisms in clouds and the charge fallout rate via precipitation. |
The observation of the first thunderstorm showsFig. 7. Evolutions of the charging rate by charging mechanisms in clouds and the charge fallout rate via precipitation.that the precipitation was weak over a very long period during this thunderstorm. The automated raingauge in Beijing recorded precipitation of several millimeters only during about 2 h after the first lightningwas detected. After the lightning activity had lastedfor nearly 2 h,the recorded precipitation began to increase evidently, and the maximum reached 168 mmh−1. The tendency of the most evident precipitationlagging behind the main lightning activity is consistentbetween the observation and simulation. Indeed,suchnon-synchronization between precipitation and lightning activity has also been found in many other observations(e.g.,Zheng et al., 2010). Liu and Zipser(2008)analyzed the diurnal variation of precipitation and lightning activity in different regions of the tropicsusing satellite data. They found that the peak timeof lightning activity was asynchronous with the peaktime of precipitation in four of five regions,based onsimultaneous precipitation and lightning data. Theseobservations suggest that,on the whole,the time withfrequent lightning flashes may not overlap with thetime of heavy precipitation. Therefore,the simulation result with respect to the temporal relationshipbetween lightning activity and the main precipitationshould be typical for most thunderstorms. Consequently,ORCP(Qout)could be negligible comparedwith CR(Qchar)during most of the lightning activityperiod.
From another point of view,it is conceivable thatthe non-synchronization of frequent lightning activity and heavy precipitation appears simply because theheavy ORCP seriously impairs the lightning activity.
4.4 Discussion of the overall effectAccording to the above analysis,Eq.(5)could besimplified as follows for most of the lightning activityperiod:
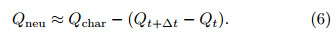
The polynomial fitting of the updraft volume withCR(Qchar) and CROP(Qt+∆t − Qt)is given separately in Fig. 8. Note that in order to express thedifferent contributions of CR and CROP intuitively,the negative value of CROP for negative charge showsthe increasing of TAOC. As can be seen,they both correlate well with the updraft volume; the correlation coefficients are 0.96 and 0.90,respectively. Thetrends of the fitting curves indicate that:(1)CR and CROP both have accelerated increases with increasing updraft volume;(2)CR keeps increasing as theupdraft volume grows;(3)CROP increases with thegrowth of updraft volume only when the updraft volume is greater than 133 km3, and the value of CROPremains positive when the updraft volume is below 280km3. This is because the volume and the mass of negative charge keep decreasing,although there is stilla small region with weak updraft,while the updraftweakens considerably. Therefore,CROP is positive.However,when the updraft volume is greater than thethreshold,CROP also increasingly accelerates.
 |
| Fig. 8.Combined effect of the charging rate and changing rate of total negative charge in the thunderstorm. |
A comparison between both of the accelerationsshows that CR has higher acceleration than CROPwith the growth in updraft volume. According to thefitting equations(Fig. 8) and Eq.(6),RNCL(y1+y2),synthesizing the results of CR and CROP,also illustrates an increasing acceleration with the growth inupdraft volume. The inhibition of updraft on lightning activity becomes relatively evident only when theupdraft is sufficiently strong,e.g.,the updraft volumeis greater than 280 km3. As the updraft volume becomes larger in Fig. 8,so does the difference betweeny1 and y1 + y2. During the final period of lightningactivity,CROP becomes positive,which reduces thedecreasing speed of RNCL.
5. ConclusionsToimprove underst and ing of the factors impacting upon lightning activity, and according to the principle of the balance between the source and remit ofone kind of polarity charge on the whole-thunderstormscale,this study proposes that there should be threefactors affecting RNCL,which represents the intensity of lightning activity,from the macro perspectiveof the thunderstorm: CR,CROP, and ORCP. Basedon a simulation by using a 3D cloud resolution modelcoupled with charging and discharging processes,theimpact of updraft on CR and CROP was analyzed.The results show that:
1)Updraft has a positive influence on CR. Thesize of the region with the charging process is the keyfactor for CR. The main charging process always occurs within and near the updraft region. This causesa positive correlation between the updraft volume and the volume with the charging process. The correlation coefficient can reach approximately 0.96. Strengthening of the updraft promotes an increasing of CRthrough this correlation, and further,an increasing ofRNCL.
2)Updraft has a positive influence on CROP. Thedelivery and divergence of charge in both the vertical and horizontal directions caused by the updraftlead to increasing TAOC,while the charging processkeeps producing new charge. Therefore,strengtheningof the updraft also promotes an increasing of TAOCover most of the time. This results in a positive correlation between the updraft volume and CROP,witha correlation coefficient of about 0.9. However,thispositive influence of updraft on CROP will inhibit theincreasing of RNCL.
Additionally,the magnitude of ORCP is comparable to the magnitude of CR. The peak of ORCP(23C s−1)in the simulated thunderstorm is even slightlygreater than the peak of CR(20 C s−1). Becausethe main precipitation occurs after lightning activity,the inhibitory effect of ORCP on RNCL is negligiblehere. According to above analysis,strengthening ofthe updraft can not only promote lightning activity,but also inhibit it. Indeed,updraft has opposite influences on lightning activity simultaneously. On thewhole,however,promotion is the dominant effect.
A more comprehensive underst and ing of updrafton lightning activity can not only promote underst and ing of the relationship between dynamics and electrical activity in thunderstorms,but also providea theoretical basis for explaining the relationship between lightning activity and other observed weatherphenomena. It also supports further research on theconstruction of a logical and reliable lightning warningmethod,as well as a warning method for other severeweather using lightning data.
| Baker, M. B., A. M. Blyth, H[J]. Christian, et al., 1999: Relationships between lightning activity and various thundercloud parameters:Satellite and modelling studies. Atmos. Res., 51, 221-236. |
| Barthe, C., and M. C. Barth, 2008: Evaluation of a new lightning-produced NOx parameterization for cloud resolving models and its associated uncertainties. Atmos. Chem. Phys., 8, 4691-4710. |
| Barthe, C., W. Deierling, and M. C. Barth, 2010: Esti-mation of total lightning from various storm param-eters:A cloud-resolving model study. J. Geophys. Res., 115, doi:10.1029/2010JD014405. |
| Black, R. A., and J. Hallett, 1999: Electrification of the hurricane. J. Atmos. Sci., 56, 2004-2028. |
| Boccippio, D. J., 2002: Lightning scaling relations revis-ited. J. Atmos. Sci., 59, 1086-1104. |
| Bruning, E. C., and D. R. MacGorman, 2013: Theory and observations of controls on lightning flash size spectra. J. Atmos. Sci., 70, 4012-4029. |
| Carey, L. D., and S. A. Rutledge, 1996: A multiparameter radar case study of the microphysical and kinematic evolution of a lightning producing storm. Meteor. Atmos. Phys., 59, 33-64. |
| Carey, L. D., M[J]. Murphy, T. L. McCormick, et al., 2005: Lightning location relative to storm structure in a leading-line trailing-stratiform mesoscale con-vective system. J. Gophys. Res., 110, D03105, doi:10.1029/2003JD004371. |
| Deierling, W., and W. A. Petersen, 2008: Total light-ning activity as an indicator of updraft charac-teristics. J. Geophys. Res., 113, D16210, doi:10.1029/2007JD009598. |
| Dye, J. E., J[J]. Jones, A[J]. Weinheimer, et al., 1988: Observations within two regions of charge during initial thunderstorm electrification. Quart[J]. Roy. Meteor. Soc., 114, 1271-1290. |
| Fuchs, B., S. Rutledge, T. Lang, et al., 2014: Factors affecting lightning behavior in various regions of the United States. 5th International Lightning Meteoro-logical Conference. 20-21 March, Tucson, Arizona, USA. |
| Gardiner, B., D. Lamb, R. L. Pitter, et al., 1985: Mea-surements of initial potential gradient and particle charges in a Montana summer thunderstorm. J. Geophys. Res., 90, 6079-6086. |
| Hallett, J., and C. P. R. Saunders, 1979: Charge sepa-ration associated with secondary ice crystal produc-tion. J. Atmos. Sci., 36, 2230-2235. |
| Heymsfield, G. M., L. Tian, A[J]. Heymsfield, et al., 2010: Characteristics of deep tropical and subtropi-cal convection from nadir-viewing high-altitude air-borne Doppler radar. J. Atmos. Sci., 67, 285-308. |
| Hu Zhijin and He Guanfang, 1988: Numerical simulation of microphysical processes in cumulonimbus-Part I:Microphysical model. Acta Meteor. Sinica, 2, 471-489. (in Chinese) |
| Jacobson, E. A., and E. P. Krider, 1976: Electrostatic field changes produced by Florida lightning. J. At-mos. Sci., 33, 103-117. |
| Kasemir, H. W., 1960: A contribution to the electrostatic theory of a lightning discharge. J. Geophys. Res., 65, 1873-1878. |
| Kasemir, H. W., 2012: Theoretical and Experimental Determination of Field, Charge and Current on an Aircraft hit by Natural or Triggered Lightning. American Geophysical Union Washington, D.C., 885-693. |
| Kuhlman, K. M., D. R. MacGorman, M. I. Biggerstaff, et al., 2009: Lightning initiation in the anvils of two supercell storms. Geophys. Res. Lett., 36, L07802, doi:10.1029/2008GL036650. |
| Lang, T. J., and S. A. Rutledge, 2002: Relationships between convective storm kinematics, precipitation, and lightning. Mon. Wea. Rev., 130, 2492-2506. |
| Liu, C. T., and E[J]. Zipser, 2008: Diurnal cycles of precipitation, clouds, and lightning in the tropics from 9 years of TRMM observations. Geophys. Res. Lett., 35, L04819, doi:10.1029/2007GL032437. |
| Marshall, T. C., M. P. McCarthy, and W. D. Rust, 1995: Electric field magnitudes and lightning initiation in thunderstorms. J. Geophys. Res., 100, 7097-7103. |
| Mansell, E. R., D. R. MacGorman, C. L. Ziegler, et al., 2002: Simulated three-dimensional branched lightning in a numerical thunderstorm model. J. Geophy. Res., 107, ACL2-1-ACL2-12, doi:10.1029/2000JD000244. |
| McCaul, E. W. Jr., S[J]. Goodman, K. M. LaCasse, et al., 2009: Forecasting lightning threat using cloud-resolving model simulations. Wea. Forecasting, 24, 709-729. |
| Mecikalski, R. M., A. L. Bain, and L. D. Carey, 2015: Radar and lightning observations of deep moist con-vection across northern Alabama during DC3:21 May 2012. Mon. Wea. Rev., 143, 2774-2794. |
| Miller, K., A. Gadian, C. Saunders, et al., 2001: Mod-elling and observations of thundercloud electrifica-tion and lightning. Atmos. Res., 58, 89-115. |
| Palucki, J. L., M. I. Biggerstaff, D. R. MacGorman, et al., 2011: Comparison between low-flash and non-lightning-producing convective areas within a mature mesoscale convective system. Wea. Fore-casting, 26, 468-486. |
| Pereyra, R. G., E. E. Avila, N. E. Catellano, et al., 2000: A laboratory study of graupel charging. J. Geophys. Res., 105, 20803-20812. |
| Petersen, W. A., S. A. Rutledge, and R. W. Orville, 1996: Cloud-to-ground lightning observations to TOGA COARE:Selected results and lightning lo-cation algorithm. Mon. Wea. Rev., 124, 602-620. |
| Petersen, W. A., S. A. Rutledge, R. C. Cifelli, et al., 1999: Shipborne Dual-Doppler operations during TOGA COARE:Integrated observations of storm kinematics and electrification. Bull. Amer. Meteor. Soc., 80, 81-97. |
| Pickering, K. E., Y. S. Wang, W.-K. Tao, et al., 1998: Vertical distributions of lightning NOx for use in regional and global chemical transport models. J. Geophys. Res., 103, 31203-31216. |
| Price, C., and D. Rind, 1992: A simple lightning param-eterization for calculating global lightning distribu-tions. J. Geophys. Res., 97, 9919-9933. |
| Reinhart, B., H. Fuelberg, R. Blakeslee, et al., 2014: Understanding the relationships between lightning, cloud microphysics, and airborne radar-derived storm structure during Hurricane Karl (2010). Mon. Wea. Rev., 142, 590-605. |
| Rutledge, S. A., E. R. Williams, and T. D. Keenan, 1992: The down upper Doppler and electricity ex-periment (DUNDEE):Overview and preliminary results. Bull. Amer. Meteor. Soc., 73, 3-16. |
| Shackford, C. R., 1960: Radar indications of a precipitation-lightning relationship in New England thunderstorms. J. Meteor., 17, 15-19. |
| Takahashi, T., 1978: Riming electrification as a charge generation mechanism in thunderstorms. J. Atmos. Sci., 35, 1536-1548. |
| Takahashi, T., 1984: Thunderstorm electrification-A numerical study. J. Atmos. Sci., 41, 2541-2558. |
| Tan Yongbo, Tao Shanchang, Zhu Baoyou, et al., 2006: The simulation of double-layer and branching-structure of lightning in thunderstorm. Sci. China(Ser. D.), 36, 486-496. (in Chinese) |
| Tan Yongbo, Tao Shanchang, Zhu Baoyou, et al., 2007: A simulation of the effects of intra-cloud lightning discharges on the charges and electrostatic potential distributions in a thundercloud. Chinese J. Geo-phys., 50, 1053-1065. (in Chinese) |
| Tessendorf, S. A., L[J]. Miller, K. C. Wiens, et al., 2005: The 29 June 2000 supercell observed during STEPS. Part I:Kinematics and microphysics[J]. Atmos. Sci., 62, 4127-4150. |
| Wang Fang, Xiao Wenan, Lei Hengchi, et al., 2009: Nu-merical simulation of electricity characteristic of a thunderstorm case in summer of Jilin. Plateau Me-teor., 28, 385-394. (in Chinese) |
| Wang Fei, Zhang Yijun, Zheng Dong, et al., 2015: Impact of the vertical velocity field on charging processes and charge separation in a simulated thunderstorm. J. Meteor. Res., 29, 328-343. |
| Weiss, S. A., D. R. MacGorman, and K. M. Calhoun, 2012: Lightning in the anvils of supercell thunder-storms. Mon. Wea. Rev., 140, 2064-2079. |
| Wiens, K. C., S. A. Rutledge, and S. A. Tessendorf, 2005: The 29 June 2000 supercell observed during STEPS. Part II:Lightning and charge structure[J]. Atmos. Sci., 62, 4151-4177. |
| Williams, E. R., and R. M. Lhermitte, 1983: Radar tests of the precipitation hypothesis for thunderstorm electrification. J. Geophys. Res., 88, 10984-10992. |
| Williams, E. R., 1985: Large-scale charge separation in thunderclouds. J. Geophys. Res., 90, 6013-6025. |
| Williams, E. R., and S. Stanfill, 2002: The physical ori-gin of the land-ocean contrast in lightning activity. Comp. Rend. Phys., 3, 1277-1292. |
| Williams, E. R., V. Mushtak, D. Rosenfeld, et al., 2005: Thermodynamic conditions favorable to superlative thunderstorm updrafts, mixed phase microphysics and lightning flash rate. Atmos. Res., 76, 288-306. |
| Workman, E. J., and S. E. Reynolds, 1949: Electrical ac-tivity as related to thunderstorm cell growth. Bull. Amer. Meteor. Soc., 30, 142-149. |
| Yao Wen, Zhang Yijun, Meng Qing, et al., 2013: A com-parison of the characteristics of total and cloud-to-ground lightning activities in hailstorms. J. Meteor. Res., 27, 282-293, doi:10.1007/s13351-013-0212-x. |
| Zhang Wenjuan, Zhang Yijun, and Zhou Xiuji, 2013: Lightning activity and precipitation characteristics of Typhoon Molave (2009) around its landfall. J. Meteor. Res., 27, 742-757, doi:10.1007/s13351-013-0510-3. |
| Zhang Yijun, Yan Muhong, and Liu Xinsheng, 1999: Simulation study of discharge processes in thun-derstorm. Chin. Sci. Bull., 44, 2098-2102. (in Chinese) |
| Zhang Yijun, P. R. Krehbiel, Liu Xinsheng, et al., 2003: Three dimensions structure of lightning discharge channel. Plateau Meteor., 22, 217-220. (in Chinese) |
| Zheng Dong, Zhang Yijun, Meng Qing, et al., 2010: Re-lationship between lightning activities and surface precipitation in thunderstorm weather in Beijing. J. Appl. Meteor. Sci., 21, 287-297. |
| Ziegler, C. L., D. R. MacGorman, J. E. Dye, et al., 1991: A model evaluation of noninductive graupel-ice charging in the early electrification of a mountain thunderstorm. J. Geophys. Res., 96, 12833-12855. |
| Ziegler, C. L., and D. R. MacGorman, 1994: Ob-served lightning morphology relative to modeled space charge and electric field distributions in a tor-nadic storm. J. Atmos. Sci., 51, 833-851. |