 2015, Vol. 29
The Chinese Meteorological Society
Article Information
- LIU Hongnian, MA Wanli, QIAN Junlong, CAI Juzhen, YE Xianman, LI Jiahui, WANG Xueyuan. 2015.
- Effect of Urbanization on the Urban Meteorology and Air Pollution in Hangzhou
- J. Meteor. Res., 29(6): 950-965
- http://dx.doi.org/10.1007/s13351-015-5013-y
Article History
- Received 2015-04-13;
- in final form 2015-09-17


2 Hangzhou Environmental Meteorological Center, Hangzhou 310008;
3 Zhejiang Climate Center, Hangzhou 310017;
4 Hangzhou Environmental Monitoring Central Station, Hangzhou 310007
In recent years,urbanization in China has con-tinuously accelerated. Although urbanization can ap-parently enhance mankind’s st and ard of living,it cre-ates numerous environmental problems that cannot be ignored. For example,the heat isl and effect becomes increasingly serious; urban visibility decreases dramat-ically; urban air quality continuously worsens; and the frequency of urban haze weather increases.
The main cause of the increasing problems with respect to air quality in China’s urban atmosphere is the growing energy consumption required to satisfy the country’s rapidly growing economy of the past few decades. Another undeniable fact is that urbaniza-tion itself contributes to increased urban haze weather,which can decrease urban wind speed,decrease pollu-tant di.usion capability, and therefore,result in pol-lutant accumulation. Thus,pollutant concentrations increase, and consequently,visibility decreases.
Xu(2002) and Xu et al.(2005)studied the spatial structure characteristics of urban atmospheric polluta-nts on multiple scales using samples from rapidly grow-ing urban communities in Beijing and its surrounding areas. They concluded that on a heat isl and ,mesoscale heat circulation characteristics and the interaction be-tween dynamics and heat on the urban and urban-local scales have substantial effects on the transport,trans-formation, and di.usion of urban atmospheric pollu-tants.
Miao et al.(2010)studied the effect of Beijing’s urbanization on urban meteorology and heavy rain and found that Beijing’s urbanization can cause a clear decay in wind speed. Peng and Hu(2006)performed a statistical analysis of the average .eld observational data collected at Beijing’s 325-m meteorological tower in the summers of 1994 and 1997–2003. They found that at the near l and surface level—most strongly af-fected by the underlying surface—the wind direction gradually became disordered and the wind speed de-creased from 1.23 m s-1 in 1994 to 0.71 m s-1 in 2003. Ma and Zhang(2015)studied the impacts of urban ex-pansion on Meiyu precipitation over eastern China and found that urban expansion in the Yangtze River Delta region has led to changes in the surface energy balance and a warming(cooling)of the tropospheric(strato-spheric)air temperature over eastern China. In their study of multi-year speed data in Shanghai,Zhou and Yu(1988)showed that rapid urbanization resulted in increased architectural complexity with increased den-sity and height,leading to increased roughness of the underlying surface, and consequently decreased urban surface wind speed.
Surface wind speed is the key factor in determin-ing urban pollutant concentrations because decayed wind speed can lead to decreased atmospheric di.usion capability,resulting in increased pollutant concentra-tions. Dacre et al.(2007)found that even with no syn-optic system in.uence,the removal rate of pollutants at the atmospheric boundary itself could reach 50%. The ventilation process of the atmospheric boundary can be affected by many factors(Agust′.-Panareda et al., 2005; Angevine et al., 2006; Verma et al., 2006; Esler et al., 2007; Zhang et al., 2015),of which the mean wind fiow and turbulence processes are especially im-portant(Nehrkorn et al., 2013; Skvortsov et al., 2013).
Civerolo et al.(2007)numerically simulated vari-ations in New York City’s surface meteorological .eld and ozone concentration caused by urbanization for the ne
xt 50 years and found that a change in sur-face type could increase both the average daily ozone concentration by 1–5 ppb in New York City’s urban area, and the average daily maximum 8-h ozone con-centration by 6 ppb. Wang et al.(2007,2009)studied the effects of climate-characteristic variations caused by urban expansion in the Pearl River Delta region on the formation of secondary organic aerosols and ozone. They concluded that the urban expansion in-creased the concentrations of urban ozone and sec-ondary organic aerosols by affecting urban temper-ature,wind speed, and mixing layer height. Wang et al.(2008)found that urban buildings can affect both the surrounding meteorological environment and the transport and di.usion capabilities of urban pol-lutants in the Beijing area. As the towns surrounding Beijing continued to exp and ,the particulate matter of 10 μm in diameter or less(PM10)changed from mov-ing mainly in the outgoing direction to the incoming direction in the primary urban area. The existence of small towns and cities contributed 0.192 t day-1 to the PM10 budget of the main urban area.Hangzhou is one of the most popular tourist des-tinations in China and a highly developed area. Over the past 20 years,its economy has developed rapidly and urbanization has accelerated. The quality of the urban-atmosphere environment,however,has been de-creasing, and the frequency of haze weather has been continuously increasing. Based on the compiled haze weather data in Hangzhou from 2003 to 2008,it ap-pears that every year had more than 150 haze weather days,with that number reaching 176 days in 2004(Jin et al., 2010).
Many studies have been carried out on the air quality of Hangzhou; however,investigations on the influence of urbanization on air quality have been relatively few in number, and focused mainly on the impact of urbanization on the meteorology field and the evolution of air quality with the urbanization process. Using a regional boundary layer model,Chen and Jiang(2006)studied the influence of urban build ings on the urban wind field and found that buildings tended to decrease the wind speed of the urban area(maximum reduction: 1.6 m s−1) and trigger the convergence of low-level air flow. Mao et al.(2013)analyzed the evolution of annual average haze days in Hangzhou City and Zhejiang Province during 1960–2009 using the nighttime light distribution from a satellite product. The increase in air pollution emissions during the urbanization process is plausibly the major reason for the air quality deterioration of Hangzhou. Urbanization has greatly altered the surface characteristics and building height and density of the city,but how the air quality is affected by these changes remains unclear and will be investigated in this paper.
The impacts of urbanization mainly fall into two aspects. Firstly,the city area,the characteristics of the buildings, and the variation of the surface can sig-ni.cantly affect the urban atmospheric environment. Secondly,human activities such as anthropogenic heat and pollutant emissions also have a direct in.uence. To study the effect of urbanization on Hangzhou’s ur-ban meteorological characteristics and pollutant dif-fusion over the past decade,numerical simulations were conducted by using the Nanjing University-City Air Quality Prediction System(NJU-CAQPS),high-resolution surface-type data, and urban construction data in 2000 and 2010. In addition,variations in the urban meteorological environment resulting from Hangzhou’s urbanization were analyzed,including not only the variations in urban heat isl and and city wind characteristics but also the concentration distribution di.erences caused by variations in urban meteorologi-cal conditions.
The simulations for 2000 and 2010 used di.er-ent surface types,building heights,building densi-ties, and anthropogenic heat caused by urbanization in Hangzhou. The same pollution emission inventory and NCEP-NCAR reanalysis data of 2010 were used in the simulations. Thus,by comparing the simula-tion results for these two periods,we were able to obtain the effect of Hangzhou’s urbanization on the urban meteorological environment and pollutant dif-fusion. In fact,the work presented in this paper com-prised a sensitivity study about the effect of surface type,building height and density, and anthropogenic heat on the atmospheric environment.
2. Model and design 2.1 ModelThe NJU-CAQPS model is composed of four modules: the WRF(Weather Research and Forecast-ing)model,UBLM(Urban Boundary Layer Model),ACTDM(Atmosphere Contaminant Transport and Di.usion Model), and CSTM(Contamination Source Treatment Model)(Liu et al., 2009).
The WRF model system is a new-generation,mesoscale prediction model and assimilation system established in 1997 by the meso- and small-scale me-teorological station at NCAR,the Environment Simu-lation Center at NCEP,the Forecast Study Station of the Forecast Systems Laboratory, and the Center for Analysis and Prediction of Storms at the University of Oklahoma. The system remains in wide use today.
UBLM is a 3D,.ne-scale,urban atmospheric boundary model and non-hydrostatic and high-resolution turbulence closure model(Fang et al., 2004). In this model,urban anthropogenic heat is added to the surface energy balance equation, and the urban building drag term is added to the momentum and turbulence energy equations,which can therefore accurately simulate urban meteorological characteris-tics and better reffect urban-local heat and dynamic forcing effects. ACTDM,which is online-coupled with UBLM,includes concentration prediction mod-els for transport,di.usion,chemical conversion, and dry and wet deposition of multiple substances(Liu et al., 2009),calculates 3D concentration variations of multiple pollutants [i.e.,sulfur dioxide(SO2),nitro-gen oxides(NOX),total suspended particles,PM10,PM2.5(particulate matter of 2.5 μm or less),ozone(O3),carbon monoxide(CO), and the main compo-nents of aerosols—including sulfates,nitrates,ammo-nium salts,black carbon, and organic carbon], and calculates the atmospheric light extinction coe.cient and visibility based on aerosol concentration to dis-criminate haze. The gaseous chemical reaction mech-anism is CBM4(Carbon Bond Mechanism IV), and secondary inorganic aerosols(e.g.,sulfates,nitrates, and ammonium salts)are computed with the aerosol thermodynamic balance model. Based on the mass concentrations of aerosol chemical components,the ex-tinction coe.cients and visibility were calculated.
UBLM employs the initial condition and bound-ary condition provided by WRF. ACTDM uses the inverse square interpolation method to compute the initial condition from observational data, and takes the real observational value of the reference observa-tion sites as the boundary value.
Describing the impact of urban buildings on the wind .eld is crucial in the simulation of urban mete-orology and air pollution di.usion. Due to the damp-ing and disturbance effects of buildings on the urban lower-layer wind .eld,when airfiow passes through ur-ban areas,wind speed is decreased and turbulence en-ergy is increased. UBLM introduces drag force into the momentum equation to represent the impact of urban buildings on the wind .eld,based on the stud-ies of Sorbjan and Uliasz(1982),Uno et al.(1989), and Urano et al.(1999). The surface area index of urban buildings A(z)is calculated as follows:
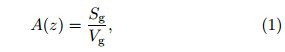
where Sg is the total surface perpendicular to wind speed in a grid, and Vg is the grid volume. In the con-trol function set,the urban building damping terms Fbu and Fbv are added to the u and v component equa-tions,respectively, and a building disturbance term of turbulence energy(PEb) and dissipation rate(Pεb)are added to the turbulence energy and dissipation rate functions in UBLM,respectively:
The parameter η is the building area ratio in each grid. According to the wind tunnel test results reported by Raupach(1992),the drag coe.cient Cd was set to 0.4.
The NJU-CAQPS model is in operational use at the meteorological bureaus of Suzhou,Hangzhou, and Ningbo,The model has also been used to study the formation mechanisms and factors in.uencing haze weather(Lu et al., 2011; Qian et al., 2013,2015).
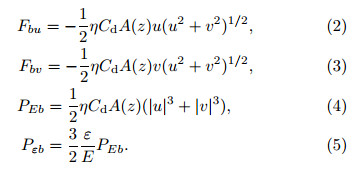
2.2 DesignConsistent with the analysis of the characteris-tics of Hangzhou’s weather between 1995 and 2000,its weather was divided into nine types by Hangzhou Meteorological Bureau,i.e.,high-pressure front,high-pressure bottom,high-pressure control,high-pressure rear,cyclone system,east wind belt system,inverted trough,cold-front rear, and cold-front front. The clas-si.cation of synoptic types took place as follows: On the surface weather map or 500-hPa weather map at 0600 UTC,the synoptic system that occurred in the predetermined region with Hangzhou at the center was de.ned as the synoptic type. If there were two syn-optic types occurring at the same time,the one that went on to affect Hangzhou was chosen. Categoriz-ing each day’s weather according to the above nine types is a st and ard task of Hangzhou Meteorological Bureau. The data of synoptic types were therefore ob-tained from Hangzhou Meteorological Bureau.
Ninety individual cases under the nine di.erent weather types were selected to simulate the effect of urbanization on the meteorological .eld from 2010 to 2012 and the effect of urbanization on pollutant di.u-sion for each typical case of each weather type. Each synoptic type had 10 cases and the selection process used a rule that there needed to be a case in each of the seasons. All case dates are listed in Table 1.
The design of the grid in the model was as follows: a quadruple nested grid was used in WRF,the center at 30.238°N,120.205°E. All four grids of the quadru-ple nested grid had 82 × 61 grid points, and the spatial resolutions were 27,9,3, and 1 km,respectively. The extended hydrostatic pressure-following vertical coor-dinate was used in the vertical direction,which had 78 vertical layers and a top level at 100 hPa. The bound-ary condition used 1° × 1° NCEP data,updated every 6 hours. The microphysics process used the WSM3 simple ice scheme; the longwave and shortwave radi-ation schemes were the RRTM and Dudhia schemes,respectively; the l and process used the Noah scheme; the boundary layer scheme was the Monin-Obukhov scheme; and the cumulus convection parameterization only took the Kain-Fritsch scheme at one and two ver-tical layers. The simulation of each case started at 120° UTC on the day before the simulation day. Thus,each case ran for 36 h, and the .rst 12 hours was the model spin-up period. The horizontal grid distance in the boundary layer model and chemical model was 500 m, and the horizontal grid points were 99 × 71. The vertical distance was divided into 13 layers; the top height in the model was 3 km; and the lowest layer height was 5 m.
The numerical simulation region in the NJU-CAQPS model covered a 49 × 35-km2 area centered on the junction of Fuchun Road and Shimin Street in Hangzhou(30.278590 N,12°.1842°E). According to Hangzhou’s underlying surface characteristics,the study region can be classi.ed as city,water area,grass-l and ,woodl and , and soil. Figure 1 shows the dis-tribution of l and -use types in 2000 and 2010 based on a 10-m resolution and surface-type data,in which the purple region represents “city”. Hangzhou Urban Planning Bureau provided the urban area gridded data of urban building height,water area,grassl and , and other surface types,with a spatial resolution of 10 m. The suburban area surface type data were provided by the MODIS surface type database in WRF. Following 10 yr of urbanization,the size of Hangzhou’s urban area has greatly increased from 133 km2 in 2000 to 378 km2 in 2010. In 2000,the area was limited to the north of Qiantang River,while Hangzhou City was de-veloped around the south of Qiantang River and the main urban area exp and ed to the north,northeast, and west.
 |
| Fig. 1.Hangzhou’s land-use types in (a) 2000 and (b) 2010. |
There are eight districts in Hangzhou City,i.e.,Yuhang(YH),Xihu(XH),Shangcheng(SC),Xiacheng(XC),Jianggan(JG),Gongshu(GS),Binjiang(BJ), and Xiaoshan(XS). According to traditional classi.ca-tions,SC,XC,XH,GS, and JG were considered as Hangzhou’s main urban areas. In the model domain,the terrain of Hangzhou’s urban area was .at, and the hills in the southwest were generally less than 30° m.
Each case(Table 1)was simulated twice. In the .rst run,the l and -use types and building data of 2010 were used, and the results compared with observa-tions. In the second run,the data were replaced by those of 2000. In the simulation of each case,the NCEP data and emissions data remained unchanged,so the di.erences between the results of 2010 and 2000 could be attributed to the development of urban-ization.
3. Urbanization of HangzhouFigure 2 shows the distribution of building height and density variation in 2000 and 2010 based on 10-m resolution urban-building height and distribution data for Hangzhou. After 10 yr of urbanization in Hangzhou,the building height and density variation in 2010 were clearly larger than in 2000. In the main urban area and parts of the new urban area,the num-ber of large and tall buildings increased rapidly,as did the building density. The average building height and density were 9.8 m and 0.15,respectively,in 2000, and the corresponding values in 2010 were 9.5 m and 0.16,respectively. The amount of buildings in 2010 was far greater than in 2000, and most of the buildings in the newly developed urban areas were lower than 10 m; this was why the average building height in 2010 was slightly less than that in 2000.
 |
| Fig. 2.Urban (a, c) building height (m) and (b, d) density in (a, b) 2000 and (c, d) 2010, and (e, f) their differences. |
With the increasing urban population and devel-opment of industry and transport,the effect of ur-ban anthropogenic heat on the urban environment and climate has become increasingly important,making anthropogenic heat a key factor in the simulation of ur-ban meteorology. In this study,urban anthropogenic heat was classi.ed as the sensible heat .ux from in-dustry,transport,living and human body heat.
Based on data for industrial energy consumption,vehicle possession,main road tra.c-fiow,domestic en-ergy consumption,human population, and st and ard coal calori.c values,recorded in the 2010 Hangzhou Statistical Annual Book,Hangzhou’s anthropogenic heat in 2010 was estimated. Industry,transport,do-mestic, and human body-heat radiation in Hangzhou were calculated to be 39.1,10.8,5.57, and 1.57 W m-2,respectively, and the total anthropogenic heat .2was 57.04 W m. Similarly,Hangzhou’s anthro-pogenic heat in 2000 was estimated to be 47.84 W m-2,based on statistical data from 2000 for its econ-omy. Thus,compared to 2000,anthropogenic heat .2in 2010 increased by 9.2 W m-2,which was a rel-atively small increase considering Hangzhou’s energy consumption of unit GDP(in ten thous and RMB)de-creased during the past 10 years. UBLM introduces anthropogenic heat into the sensible heat term in the surface energy balance, and the anthropogenic heat is homogeneously distributed over the urban area,tak-ing no account of the spatial distribution of anthro-pogenic heat. The estimation of anthropogenic heat and its daily variation is based on the work of Wang and Wang(2011).
Based on the 2010 emission data from Hangzhou Environmental Protection Agency,a 500-m resolu-tion emission inventory was produced. The emis-sion species included SO2,NOX,CO,HC(hydrocar-bon),PM10, and PM2.5. For brevity,only the emis-sions of four species from transport are shown(Fig. 3). The emission sources were industry(including power plants),domestic, and transport. In the sim-ulated area,total annual emissions of SO2 amounted to 55931.5 t,with 49154.8 t emanating from indus-try. The total annual emissions of NOX amounted to 73536.5 t,with 35242.0 and 37654.5 t emanatingfrom transport and industry,respectively. The total annual emissions of PM10 were 68158 t,with 41849.9 t emanating from transport and 21606.1 t emanating from industry. Finally,total annual CO emissions were 813831 t,with 657528 t emanating from industry and 154169 t from transport.
 |
| Fig. 3. Distribution of emissions from transport (t yr−1 km−2). |
The simulated daily average results were com-pared with observational results obtained from Hangzhou Meteorological Station(30° 13" 33"" N,120° 09" 53""). The simulated values of the observation sites were computed from values of the four nearby grid points using inverse square interpolation. Figure 4 shows scatter distributions comparing the 90 individual simulation case results with observational values. According to the statistical results,the aver-age temperature of the 90 simulated days was 17℃ and the corresponding observational value was 17.5℃,with a correlation coe.cient of 0.97; the average value of the simulated wind speed was 1.9 m s-1 and the corresponding observed value was 2.3 m s-1,with a correlation coe.cient of 0.703; and the average value of the simulated relative humidity was 68.7% and the corresponding observed value was 73%,with a correla-tion coefficient of 0.89. The RMSEs of wind,temper-ature, and relative humidity were 0.74 m s−1,2.22℃, and 7.86%,respectively.
 |
| Fig. 4.Comparison of simulated (a) wind speed (m s−1) at 10-m height, (b) daily average surface temperature (C), and (c) relative humidity (%) with observational values. |
Figure 5 compares some of the air quality simulations with their observed counterparts—the av-erage of values observed by Environment Monitor-ing Stations of Hangzhou Environmental Protec-tion Agency: Hemu(HM; 30°18"43""N,120°07"11"" E); Wolongqiao(WLQ; 30°14 " 44 "" N,120°07 " 37 "" E); Xi-asha(XS; 30°18"21"" N,120°20" 53""E); Chengxi-angzhen(CX; 30°10 " 55 "" N,120°16 " 11 "" E); Linping(LP; 30°25" 06""N,120°18" 02""E); and Xixi(XX; 30°16"29""N,120°03"48""E). In general,the simulated SO2 concentration was higher than the observed value because the averaged simulation to observation ratio was 1.21. Meanwhile,the averaged simulation to ob-servation ratio for nitrogen dioxide(NO2)was 1.03, and that for PM10 was 1.15. Thus,the simulation results agreed well with the observational data.
 |
| Fig. 5.Comparison of simulated (a) SO2, (b) NOx, and (c) PM10 concentrations (μgm−3) with their corresponding observed values. |
Figure 6 shows the distribution variations of the mean flow fleld and temperature .eld for 90 cases of 9 weather types. The average wind direction in the sim-ulated area was northeasterly, and when the dominant wind was northeasterly,the air corridor was primar-ily located in Shiqiaozhen(30°19"41"" N,120°11"41""),Pengfuzhen(30°17"19"" N,120°13"44""), and Jianggan districts. The coastal wind speed along the Qiantang River was relatively higher and the minimum-value re-gions were Shangcheng,Xiacheng, and northern Xihu districts,in which the fiow .eld showed apparent con-vergence. The low wind speed areas were exp and ed compared to 2000, and the wind speed in Xiaoshan district had clearly decreased. The only value that was preserved in 2010 was the 2000 high wind speed belt along the Qiantang River in the areas downstream from the estuary.
 |
| Fig. 6. Averaged distribution variation of the flow fields and temperature fields of 90 cases: (a) surface flow field (m s −1) in 2000, (b) surface flow field in (m s−1) 2010, (c) wind speed and flow field variation caused by urbanization (m s −1), and (d) surface temperature variation caused by urbanization (K). |
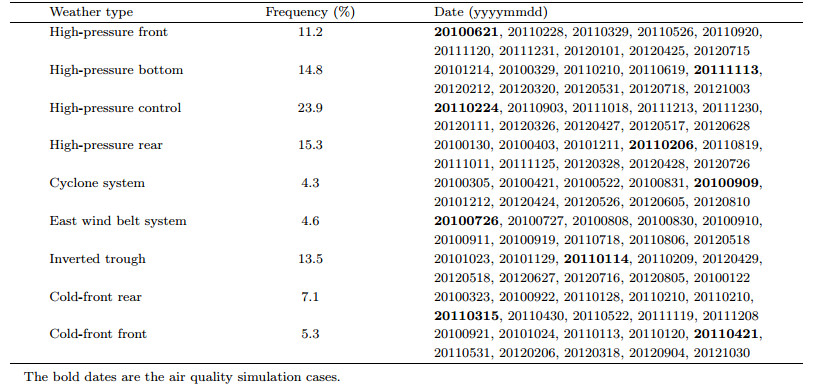
Table 2 shows the mean statistical results for the individual cases over 90 days. It indicates that the av-erage urban temperature was 16.2℃,which increased by 0.9℃; the maximum temperature was 24.6℃,which increased by 0.6℃; and the minimum temperature was 3.4℃,which increased by 1.1℃. Thus,urbanization greatly increased the nighttime temperature; the heat isl and intensity was 0.6℃,which increased by 0.5c; the average relative humidity was 69.0%,which de-creased by 9.3%; and the average urban wind speed was 1.9 m s-1,which decreased by 1.1 m s-1 . Table 2 shows that urbanization reduced the turbulence en-ergy over the urban area,which was the results of a combination of two opposite impacts of urbanization on turbulence. On the one h and ,urbanization in-on turbulence. On the one h and ,urbanization increased turbulence energy by increasing the surface roughness. On the other h and ,urbanization reduced the average wind speed and then lowered the turbulence energy. The model results illustrate that the reduction of turbulence energy due to average wind speed was more significant.
In addition to the “heat isl and effect”,urbanization can cause a “turbid isl and effect”. The heat isl and effect can decrease the frequency of inversion layer and increase air-convection transport in the vertical direction. In addition,the relatively low relative humidity and average wind speed of urban areas can inhibit thehorizontal transport of air. Under such conditions,itis very difficult for urban emitted particle pollutantsto diffuse.
The air quality for nine cases was simulated,eachrepresenting one of the nine weather types(bold datesin Table 1). The average results in the simulated ur-ban area are listed in Table 3(values in parenthesesare extreme values). The numbers of haze hours in thetable were estimated based on average hourly visibility,relative humidity, and particle concentration usingthe Observation and Forecast Grades of Haze providedby the Chinese Meteorological Administration(CMA,2010). Table 3 shows that for different weather types,urbanization increased the averaged daily urban NO2concentration by 1.0–3.3 µg m−3(increased by an average of 2.1 µg m−3) and the maximum local effectreached 12.44 µg m−3; the averaged daily urban PM2.5increased by an average of 2.3 µg m−3 and the maximum local effect reached 15.3 µg m−3; on average,visibility decreased by 0.2 km and the local effect reached1.3 km; the averaged daily number of haze hours increased by 0.1–1.2 h,increasing by an average of 0.46h, and the local effect reached 3.3 h.
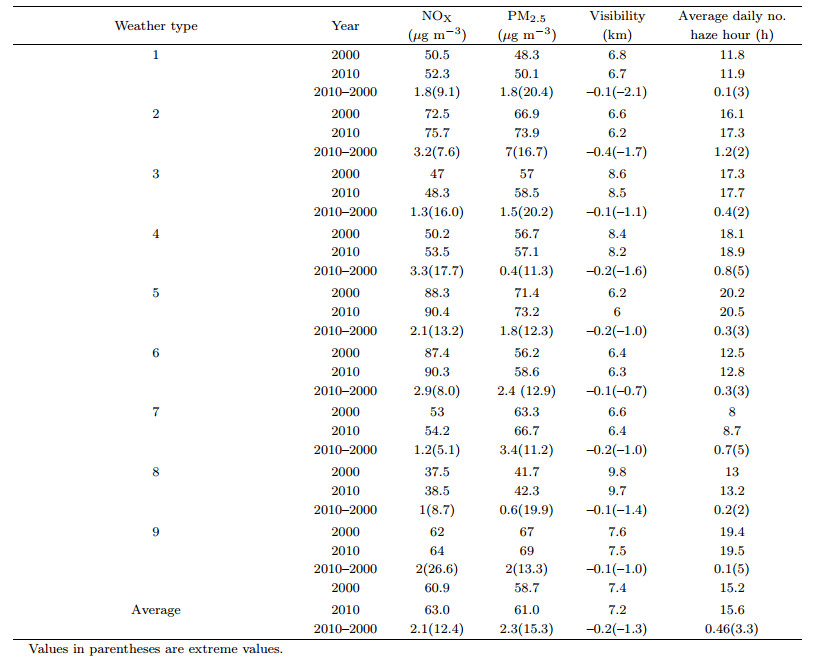
Figure 7 shows the distributions of averagedPM2.5 concentration and visibility for the nine individual cases. The results show that the maximumPM2.5 concentration was located at the boundary ofShangcheng,Xiacheng, and Jianggan districts,whichincreased by 40 µg m−3 due to urbanization. The corresponding visibility also decreased by approximately1 km. In addition,in another high PM2.5 concentration area within Xiaoshan district,the correspondingvisibility clearly decreased.
 |
| Fig. 7.Averaged (a, c) PM2.5 (µg m−3) and (b, d) visibility (km) in (a, b) 2000 and (c, d) 2010, and (e, f) their differences (µg m−3; km). |
Figure 8 shows the vertical section contour linesof PM2.5 concentration(75 and 100 µg m−3) and visibility(10 and 7 km)in the east-west direction acrossthe center of the simulated area(30◦1604300N)in different years. Note that 75 µg m−3 is the maximummean daily value for PM2.5,according to the ChineseAir Quality St and ard, and 10-km visibility is the maximum value to determine haze(called “haze height” inthis study),according to the Chinese MeteorologicalAdministration. The haze height was very low in thesuburbs,at approximately 300 m; whereas,its value inurban areas was much higher. This is because particlepollutants in urban areas are more severe than thosein suburban areas,thus decreasing both the surfacevisibility and the upper layer visibility of the boundary layer. In 2010,the haze height was approximately1300 m,which was about 200 m higher than that in2000. This indicates that urbanization decreased urban diffusion capability and resulted in pollutant accumulation,which led to a lifted haze height. In summary,over the city and in the downwind direction,thePM2.5 vertical diffusion range was higher and urbanization led to strengthened vertical diffusion of PM2.5,resulting in a higher “chaos isl and ”.
 |
| Fig. 8. Vertical cross-sections of averaged (a) PM2.5 (µg m−3) and (b) visibility (km). |
Tofurther investigate the effect of urban ventilation capability on pollutant diffusion,diffusion testswere performed without an emission source,i.e.,by removing the emission source. The same initial fieldwas established and the decreasing PM10 concentration rate over time was compared. The results forindividual cases on nine days were simulated. Figure 9 shows the PM10 concentration decay curves overtime for the underlying surface in both 2000 and 2010.The results show that the air pollution concentrationkept decreasing to almost zero due to the lack of emissions and air pollution transport, and urbanizationslowed down the decay process of air pollution concentration. Since the decay process can be represented byC = C0e−t/TSC,where C is the concentration,C0is the initial concentration,t is the time and TSC isthe characteristic time,we defined TSC as the “selfcleaning time”,i.e.,the time for the PM10 concentration to decay to 1/e of its initial concentration,where eis the Napierian base. As shown,urbanization resultedin decreased diffusion capability, and the average selfcleaning time increased by 1.5 h.
 |
| Fig. 9. PM10 concentration variations over nine days for different underlying surfaces. |
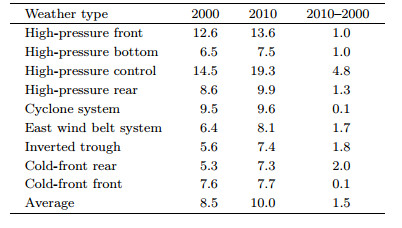
Table 4 shows the PM10 self-cleaning times forindividual cases over nine days. As shown,the decreasing rates of PM10 concentration were clearly different for different weather conditions. For the presentunderlying surface,the PM10 concentration decayedfaster during “inverted trough” weather and “coldfront rear” weather,with better diffusion capability, and its self-cleaning time was approximately 7 h. During “high-pressure front” and “high-pressure control”systems,the PM10 concentration decayed slower,withworse diffusion capability, and its self-cleaning timeswere 13.6 and 19.3 h,respectively. The self-cleaningtime varied greatly with the change of weather system.When a “high-pressure control” system dominated,Hangzhou lay under a high pressure center. Due tothe domination of downdraft flow and low wind speed,urbanization had a considerable influence and the selfcleaning time increased by 4.8 h. When weather systems with high wind speed dominated,such as a cyclone system,or cold-front front,urbanization had asmall influence and the self-cleaning time tended to be short. On average,the self-cleaning times for the9-day individual cases in 2000 and 2010 were 8.5 and 10 h,respectively.
 |
With the great increase in its urban population,China has witnessed rapid urbanization,characterizedby an exp and ing urban area,increased building height and density,rising anthropogenic heat, and worseningair pollution. The key impacts of urbanization on urban meteorology include the enhancement of the urban heat isl and effect,decreasing wind speed in theurban area, and change in the urban boundary layerheight and surface energy balance. We conclude thatthe increased emissions of air pollutants during theurbanization process is the major reason for the deterioration in Hangzhou’s air quality in the last decade.Urbanization also affects urban meteorology by changing the variation in air pollution concentrations,butthis indirect effect is a secondary reason.
The indirect effect of urbanization consists ofthermodynamic and dynamic effects. The thermodynamic effect refers to the enhancement of the urbanheat isl and . Chen et al.(2012)found that anthropogenic heat release in economically developed areas innorthern,eastern, and southern China is much largerthan that in other regions. The strengthened urbanheat isl and circulation tends to boost the vertical diffusion of air pollution, and then reduces the pollutionconcentration. The dynamic effect refers to the drageffect of urban buildings on air flow,which slows downthe urban wind speed,weakens the atmospheric diffusion capacity, and increases the air pollution concentration. The simulations considered both the thermodynamic and dynamic effects, and the results showedthat the combined effect is to increase the pollutionconcentration,which means that the dynamic effectdominates. Nonetheless,further underst and ing of thetwo effects is required,by separating them and studying each of them individually. Increases in air pollution concentration as a result of urbanization occur notonly in Hangzhou,but also in Nanjing and Suzhou—two regions that have also experienced rapid urbanization(Lu et al., 2011; Qian et al., 2015).
The impact of urbanization on urban air pollution concentrations is complex. The influence of urbanization on the temperature and humidity fields canchange the rate constant of chemical reactions and hygroscopic growth of aerosols,respectively. Further insight into these chemical and physical processes needto be further studied.
6. ConclusionsThe effect of urbanization on the urban meteorological environment is a complicated issue. Numerousfactors can affect the urban meteorological environment,such as increased emissions of anthropogenicpollutants and heat, and changes in building materials(effects on the surface energy balance). In thisstudy,we considered variations in two characteristicsto evaluate urbanization,including the underlying surface and building height(density), and simulated themeteorological field and pollutant diffusion process using different weather types for two different underlyingsurfaces and urban building distributions in Hangzhouin 2000 and 2010. Ninety cases belonging to nineweather types, and nine cases featuring air pollutiondiffusion,were simulated. The key conclusions can besummarized as follows:
Owing to urbanization,the area of urban lowwind speed clearly increased and the mean daily urbanwind speed decreased by 1.1(0.1–2.9)m s−1. Also,the heat isl and intensity increased by an average of 0.5(–0.1–1.3)℃ and the mean daily urban relative humidity decreased by an average of 9.7%(3.6%–17.9%).
For different weather types,urbanization increased the PM2.5 concentration in Hangzhou and themaximum local effect reached 12.4 µg m−3. The me and aily PM2.5 concentration increased on average by 2.3µg m−3 and the maximum local effect reached 15.3 µgm−3. Visibility decreased by an average of 0.2 km and the maximum local effect reached 1.3 km. And themean daily number of haze hours increased by 0.1–1.2h,with the haze height lifting by 100–300 m.
Urbanization decreased the urban self-cleaningcapability and the average PM10 self-cleaning time increased from 8.5 h in 2000 to 10 h in 2010. However,the reductions in self-cleaning time were far less than the differences among the weather types,indicatingurban pollution is strongly affected by the changes inweather and the effects of urbanization on pollutionare secondary.
Urbanization has a significant impact on urbanmeteorology and air quality,which has plausibly contributed to the air quality deterioration of the YangtzeRiver Delta region during recent decades. Urbanization development mainly manifests in the developmentof suburban areas,i.e.,farml and and other natural surfaces being transformed into urban surfaces. However,the effect on air pollution concentrations is not confined to suburban areas. The extreme values of temperature,wind speed, and air pollution concentrationrelated to urbanization mainly occur in the central urban area.
Weconclude that the increases in air pollutionemissions during urbanization were the major reasonfor the deterioration in Hangzhou’s air quality in thelast decade. Reductions in emissions are the main wayto control urban pollution,but the effects of urbanization on urban meteorology cannot be ignored.
The Chinese government has made plans to control the developing boundaries of 14 major citiesincluding Beijing,Shanghai,Nanjing,Hangzhou,Suzhou,ect., and thus the speed of urbanization insuch cities should slow down. In these cities,the building characteristics of the main urban area are unlikelyto change substantially, and an increase in the effect ofurbanization should be inhibited. While for the middleor small cities,with their high speeds of development,it is important that city development plans considerthe effect of urbanization on their urban meteorology and environments.
Acknowledgments. We thank the HighPerformance Computing Center at Nanjing Universityfor its technical support during our numerical calculations.
| Agustí-Panareda, A., S. L. Gray, and J. Methven, 2005: Numerical modeling study of boundary-layer ven-tilation by a cold front over Europe. J. Geophys. Res., 110, D18304. |
| Angevine, W. M., M. Tjernstrom, and M. Žagar, 2006: Modeling of the coastal boundary layer and pollu-tant transport in New England. J. Appl. Meteor. Climatol., 45, 137-154. |
| Chen Yan and Jiang Weimei, 2006: The numerical exper-iments of the effect of urban buildings on boundary layer structure. Plateau Meteor., 25, 824-833. (in Chinese) |
| Chen Bing, Shi Guangyu, Wang Biao, et al., 2012: Es-timation of the anthropogenic heat release distri-bution in China from 1992 to 2009. Acta Meteor. Sinica, 26, 507-515, doi:10.1007/s13351-012-0409-y. |
| China Meteorological Administration, 2010: Observation and Forecast Grade of Fog and Haze. Meteorolog-ical Industry Standard of the People's Republic of China. QX/T 113-2010, 3 pp. |
| Civerolo, K., C. Hogrefe, B. Lynn, et al., 2007: Estimat-ing the effects of increased urbanization on surface meteorology and ozone concentrations in the New York City metropolitan region. Atmos. Environ., 41, 1803-1818. |
| Dacre, H. F., S. L. Gray, and S. E. Belcher, 2007: A case study of boundary layer ventilation by convec-tion and coastal processes. J. Geophys. Res., 112, D17106. |
| Esler, J. G., P. H. Haynes, K. S. Law, et al., 2007: Trans-port and mixing between airmasses in cold frontal regions during dynamics and chemistry of frontal zones (DCFZ). J. Geophys. Res., 108, 4142. |
| Fang Xiaoyi, Jiang Weimei, Wu Jian, et al., 2004: Study on the development of numerical model system to predict urban air quality. Acta Scientiae Circum-stantiae, 24, 111-115. |
| Jin Jun, Wu Jian, Cai Juzhen, et al., 2010: Analyses of the characteristics and formation of haze pollution in Hangzhou. Environ. Pollut. Control, 32, 61-63, 67. (in Chinese) |
| Liu Hongnian, Hu Rongzhang, and Zhang Meigen, 2009: Development and application of urban haze numeri-cal forecast model. Res. Environ. Sci., 22, 631-636. (in Chinese) |
| Lu Mengyao, Liu Hongnian, Zhang Ning, et al., 2011: Numerical simulation of impact factors of urban haze in Nanjing area. Plateau Meteor., 30, 929-941. (in Chinese) |
| Ma Xinye and Zhang Yaocun, 2015: Numerical study of the impacts of urban expansion on Meiyu precip-itation over eastern China. J. Meteor. Res., 29, 237-256, doi:10.1007/s13351-015-4063-5. |
| Mao Minjuan, Liu Houtong, Xu Honghui, et al., 2013: The key factor research of haze with the combined application of the multi element data. Acta Scien-tiae Circumstantiae, 33, 806-813. |
| Miao Shiguang, Chen Fei, Li Qingchun, et al., 2010: Month-averaged impacts of urbanization on atmo-spheric boundary layer structure and precipitation in summer in Beijing area. Chinese J. Geophys., 53, 1580-1593. (in Chinese) |
| Nehrkorn, T., J. Henderson, M. Leidner, et al., 2013: WRF simulations of the urban circulation in the Salt Lake City area for CO2 modeling. J. Appl. Meteor. Climatol., 52, 323-340. |
| Peng Zhen and Hu Fei, 2006: A study of the influence of urbanization of Beijing on the boundary wind structure. Chinese J. Geophys., 49, 1608-1615. (in Chinese) |
| Qian Junlong, Liu Hongnian, Tang Lijuan, et al., 2013: Numerical simulation of the urban haze and the contribution of aerosol to ambient light extinction in the Suzhou area, Jiangsu, eastern China. J. Nan-jing Univ. (Nat. Sci.), 49, 311-319. (in Chinese) |
| Qian Junlong, Liu Hongnian, Lin Hunjuan, et al., 2015: Numerical simulation of the impact of urban growth on Suzhou's urban haze. J. Nanjing Univ. (Nat. Sci.), 51, 551-561. (in Chinese) |
| Raupach, M. R., 1992: Drag and drag partition on rough surfaces. Bound.-Layer Meteor., 60, 375-395. |
| Skvortsov, A., M. Jamriska, and T. C. DuBois, 2013: Tracer dispersion in the turbulent convective layer. J. Atmos. Sci., 70, 4112-4121. |
| Sorbjan, Z., and M. Uliasz, 1982: Some numerical urban boundary-layer studies. Bound.-Layer Meteor., 22, 481-502. |
| Uno, I., H. Ueda, and S. Wakamatsu, 1989: Numerical modeling of the nocturnal urban boundary layer. Bound.-Layer Meteor., 49, 77-98. |
| Urano, A., T. Ichinose, and K. Hanaki, 1999: Ther-mal environment simulation for three dimensional replacement of urban activity. J. Wind Engin. In-dustr. Aerodyn., 81, 197-210. |
| Verma, S., O. Boucher, C. Venkataraman, et al., 2006: Aerosol lofting from sea breeze during the Indian Ocean experiment. J. Geophys. Res., 111, D07208. Wang, X. M., W. S. Lin, L. M. Yang, et al., 2007:A nu-merical study of influences of urban land-use change on ozone distribution over the Pearl River Delta region, China. Tellus B, 59, 633-641. |
| Wang, X. M., Z. Y. Wu, and G. X. Liang, 2009: WRF/CHEM modeling of impacts of weather con-ditions modified by urban expansion on secondary organic aerosol formation over Pearl River Delta. Particuology, 7, 384-391. |
| Wang Yongwei, Jiang Weimei, Guo Wenli, et al., 2008: Numerical study of the urban scale and layout effect on atmospheric environment. Chinese J. Geophys., 51, 88-100. |
| Wang Zhiming and Wang Xuemei, 2011: Estimation and sensitivity test of anthropogenic heat flux in Guangzhou. Scientia Meteor. Sinica, 31, 422-430. (in Chinese) |
| Xu Xiangde, 2002: Dynamic issues of urban atmospheric pollution models. J. Appl. Meteor. Sci., 13, 1-12. |
| Xu Xiangde, Zhou Xiuji, and Shi Xiaohui, 2005: Spa-tial structure and scale of the atmospheric pollution source impact of city agglomeration. Sci. China (Ser. D), 48, 1-24. |
| Zhang Yunwei, Zhang Qun, Leng Chunpeng, et al., 2015: Evolution of aerosol vertical distribution during par-ticulate pollution events in Shanghai. J. Meteor. Res., 29, 385-399. |
| Zhou Shuzhen and Yu Bixia, 1988: Shanghai urban influ-ences on wind velocity. J. East China Norm. Univ. (Nat. Sci.), 3, 67-76. (in Chinese) |