 2015, Vol. 29
The Chinese Meteorological Society
Article Information
- SINGH B. P., TIWARI S., HOPKE Philip K., SINGH R. S., BISHT D. S., SRIVASTAVA A. K., SINGH R. K., DUMKA U. C., SINGH A. K., RAI B. N., SRIVASTAVA Manoj K. 2015.
- Seasonal Inhomogeneity of Soot Particles over the Central Indo-Gangetic Plains, India:Influence of Meteorology
- J. Meteor. Res., 29(6): 935-949
- http://dx.doi.org/10.1007/s13351-015-5041-7
Article History
- Received April 30, 2015;
- in final form September 22, 2015


2 Indian Institute of Tropical Meteorology (New Delhi Branch), Delhi 110060, India;
3 Clarkson University, Box 5708, Potsdam, NY 13699-5708, USA;
4 Department of Chemical Engineering, Banaras Hindu University, Varanasi 221005, India;
5 Aryabhatta Research Institute of Observational Sciences, Manora Peak, Nainital 263002, India;
6 Department of Physics, Banaras Hindu University, Varanasi 221005, India
Black carbon(BC)is produced by incompletecombustion of natural as well as anthropogenic substances,including the burning of biofuels and fossilfuels(Bond and Bergstrom, 2006; Hyvarinen et al., 2010; Praveen et al., 2012; Srivastava et al., 2012a;Safai et al., 2013; Tiwari et al., 2013). The presenceof BC in the atmosphere causes absorption of solar radiation in the visible and near infrared wavelengths. Itexerts positive radiative forcing(i.e.,heating)at thetop of the atmosphere,negative forcing(i.e.,cooling)at the surface, and heating in the lower troposphere.Because of these effects,it is an important constituentof the atmosphere that can cause global and regionalwarming(Satheesh and Ramanathan, 2000; Jacobson,2001; IPCC,2007; Ramanathan and Carmichael, 2008;Moosmüller et al., 2009; Srivastava et al., 2012b; Bond et al., 2013). According to the recent IPCCreport(Stocker et al., 2014),the contribution of BCto atmospheric radiative forcing(direct impact)is 0.4(0.05–0.8)W m−2. However,Bond et al.(2013)reported in an extensive review that the BC radiativeforcing is 1.1(0.17–2.1)W m−2. It is the secondstrongest contributor to current global warming,aftercarbon dioxide(Ramanathan and Carmichael, 2008;Bond et al., 2013).
Apart from its direct impact on the atmosphere,indirect impacts of BC are also apparent; for example,its influence on cloud droplet number concentrations and related alterations of cloud properties(Kaufman et al., 2002). The presence of higher concentrationsof BC in the atmosphere makes it an important ingredient in the analysis of regional climate(Wang,2004; Liao and Shang, 2015), and instrumental in thealteration of the heat regime of regional air as wellas regional atmospheric stability/vertical motion. Itcan also cause alterations in regional atmospheric hydrodynamics(Menon et al., 2002; Ramanathan and Carmichael, 2008; Bond et al., 2013; Wang et al., 2014).
It has been hypothesized that BC may also impact upon the precipitation patterns over the Indiansubcontinent. The precipitation over the past several decades,with increased rainfall in South Asia and increased drought in North Asia,is attributedto regional,post-industrial era emissions(Menon et al., 2002; Hyvarinen et al., 2010). Specifically for theIndian climate,increased particulate loadings,whichcan absorb radiation,are believed to have caused theadvancement of rainy periods as well as intensification of the Indian monsoon system(Lau and Kim, 2006). Existence of BC in the atmosphere is,however,a complicated issue,because it can be generated locally as well as transported regionally. Although BCexhibits a short atmospheric lifetime of around oneweek to 10 days,compared with hundreds of years forcarbon dioxide(Jacobson,2002),the continuous impingement of BC due to anthropogenic emissions isof concern for climate change estimations. Furthermore,the BC mass concentration has been increasingin the recent past because of the changing socioeconomic status and rapid industrialization in many partsof the globe,especially in developing countries. Hightemporal resolution and real-time BC data are useful to estimate the impact of BC on climate,environment, and human health. However,BC measurementsat most global locations,including the Indo-GangeticPlains(IGP),are limited. The sources and mechanisms that affect their concentrations in the air arealso mostly unknown. The scarcity of real-time BCdata over the IGP is especially important since it isone of the most populated and polluted regions of theworld. The common finding of studies carried out inthe IGP region is one of high variability in BC concentrations(Tripathi et al., 2005; Safai et al., 2008;Beegum et al., 2009; Tiwari et al., 2009; Hyvarinen et al., 2010; Ramachandran and Kedia, 2010; Bano et al., 2011; Moorthy and Satheesh, 2011; Raju et al., 2011;Praveen et al., 2012). These findings suggest the needfor continuous long-term monitoring of BC at multiple locations around the IGP,so as to estimate theimpacts of BC effectively and assist with mitigationplans. To the best of our knowledge,this paper is thefirst report of long-term,in-situ measurements of BCover Varanasi(25.3°N,83.0°E; 76 m above mean sealevel),which is located in the central part of the IGPregion. The major objectives of the present study wereto:(1)assess the variability of BC concentrations ondifferent timescales;(2)underst and the impact of BCconcentrations on columnar aerosol optical properties; and (3)examine the effect of surface meteorology onthe distribution of BC over this study region.
2. Site description and experimental setup2.1 Sampling location and meteorological conditionsIn-situ measurements of BC mass concentrationswere made on the campus of Banaras Hindu University,Varanasi,during the period 1 January to 31 December 2009. The data were gathered as part of anational program called the “Aerosol Radiative Forcing Initiative Network” funded by the Indian SpaceResearch Organization,over the IGP region. Varanasi(25.28°N,82.95°E)is located in the central Ganges Valley of North India,in the eastern part of the stateof Uttar Pradesh,along the left crescent-shaped bankof the Ganges River. The population of Varanasi Citywas approximately 1.2 million in 2011. The l and surrounding the city is very fertile and supports substantial agricultural activity. The city also possesses manysmall-scale industries. Air quality in Varanasi is verypoor due to emissions from badly maintained automobiles and heavily loaded transport vehicles,as wellas from small-scale industries,domestic heating, and large-scale construction activities(Kumar et al., 2015;Tiwari et al., 2015a,b).
There are four major seasons: winter(Decemberto next February),the pre-monsoon season(Marchto June),the monsoon season(July to September), and the post-monsoon season(October and November)(Sharma et al., 2010; Mishra and Shibata, 2012).During winter,the wind generally moves eastwardwith the passage of extratropical low pressure systems(called westerly disturbance),bringing occasional rainor fog over the IGP and snow over the Himalayan region. During the pre-monsoon season,the temperature rises rapidly(up to 49℃)from March to June,when the winds blow from the west. The region receives heavy rainfall during the monsoon season,whendepressions and moderate low pressure systems formover the northern Bay of Bengal and move northwestward.
Meteorological variables,such as temperature(TEM),relative humidity(RH),wind direction,windspeed(WS), and rainfall were obtained from an automatic weather station installed in an open field ata distance of about 250 m from the measurementsite. Mixing height(MH) and visibility(VIS)datawere obtained from the National Oceanic and Atmospheric Administration(NOAA)Air Resources Laboratory Hybrid Single-Particle Lagrangian IntegratedTrajectory(HYSPLIT)model using NCEP FNL(final)analysis data. The daily variations of the abovementioned meteorological variables are shown in Fig. 1. During the study period,the mean temperaturewas approximately 27 ± 2.1℃,varying from 17.6℃(January)to 35.8℃(June). WS varied from 1.72(December)to 3.61 m s−1(May),with a mean of about 2.5 ± 0.8 m s−1. In addition,the means(± st and arddeviation)of the MH,RH,rainfall, and VIS were 750(± 172.5)m,60(± 10)%,864.3(± 198.7)mm, and 4.1(± 0.6)km,respectively.
 |
| Fig. 1 Daily variations of meteorological parameters over Varanasi. (a) Temperature (TEM), (b) relative humidity (RH), (c) visibility (VIS), and (d) wind speed (WS). |
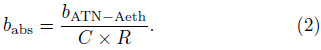
BC mass concentrations were measured with anAethalometer(Model: AE-31; Magee Scientific Co.,USA,http://www.mageesci.com)at a flow rate of 4.0L min−1. This instrument measures the optical absorption at seven wavelengths(370,470,520,590,660,880, and 950 nm)during a discrete time interval(2min). The BC mass concentration is calculated assuming that the attenuation is linearly proportionalto the amount of BC on the filter, and calculated inaccordance with earlier studies(Ramach and ranand Rajesh, 2007; Tiwari et al., 2009,2013; Srivastava et al., 2012b,2014; Safai et al., 2013)to convert the filter transmittance in inverse mega meters(Mm−1; 1Mm−1 = 10−6 m−1)to BC concentrations. The minimum detection limit of the Aethalometer,defined astwice the st and ard deviation of the noise,is 5 ng m−3(Virkkula et al., 2007). The attenuation coefficient(bATN−Aeth; Mm−1)is calculated by multiplying themeasured BC mass concentration(µg m−3)at 880 nm and constant cross-sectional value of attenuation(i.e.,σATN−BC = 16.6 m2 g−1):
The attenuation coefficient obtained from Eq.(1)iscorrected for the particle loading effect,also known asthe shadowing effect(R), and the multiple scatteringeffect(C),in order to obtain the aerosol absorptioncoefficient(babs; Mm−1): As a filter-based measurement,the BC measured by the Aethalometer may possess some artifacts due to the loading/shadowing effect,matrix effect and scattering effect(Weingartner et al., 2003;Arnott et al., 2005; Virkkula et al., 2007; Collaud et al., 2010). Weingartner et al.(2003)found thatthe loading/shadowing effect is more prominent forfreshly emitted BC,while it is almost negligible foraged particles. The uncertainties in the estimates ofBC mass concentration were around 7%. In anotherstudy,Dumka et al.(2010b)reported uncertaintiesof approximately 5% over the high altitude station atManora Peak in the central Himalaya. In addition,literature also exists on the uncertainties of BC measurements by the Aethalometer(Weingartner et al., 2003; Sheridan et al., 2005; Corrigan et al., 2006).Toobtain information on the sources of the BC particles,the wavelength exponent called the absorptionÅngström exponent(AAE,α)was estimated from theabsorption at the seven wavelengths using the powerlaw relationship(Kirchstetter et al., 2004)as previously used by Dumka et al.(2010b,2013):
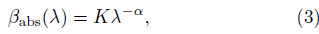
where K is a constant and λ is the wavelength(in µm).The wavelength exponent(α)is estimated by the linear regression of lnβabs and lnλ,which is a measureof the spectral dependence of aerosol absorption. Anα value of approximately 1 denotes that the majorBC source is from fossil fuel combustion. For biomassburning,it is between 1.5 and 3, and for dust it maybe 2 to 3(Bergstrom et al., 2004; Kirchstetter et al., 2004; Sandradewi et al., 2008a,b; Russell et al., 2010).
3. Results and discussion3.1 BC aerosol characteristics over VaranasiDay-to-day and monthly variability in BC massconcentrations over Varanasi during the entire studyperiod are shown in Fig. 2. The daily mean hourlyaverage BC concentration is 8.9 ± 7.0 µg m−3,varying from 34.6(7 January 2009)to 2.1(2 July 2009)µg m−3 during January–December 2009. BC was relatively higher during the winter months and lower values were found in monsoonal months. The BC concentrations exceeded the average value on approximately34% of the days. Monthly averages were highest inJanuary(24.7 µg m−3),followed by: November(24.6µg m−3),December(20.4 µg m−3),October(11.6 µgm−3),February(10.0 µg m−3),September(9.2 µgm−3),March(8.6 µg m−3),June(6.5 µg m−3),July(4.8 µg m−3),April(4.6 µg m−3),August(4.5 µgm−3), and May(4.2 µg m−3).
 |
| Fig. 2 Daily, monthly, running mean, and annual mean BC mass concentrations over Varanasi during January–December 2009. |
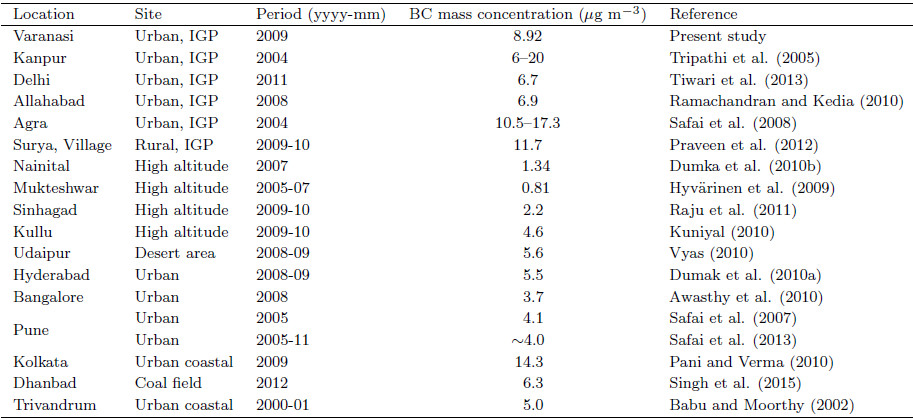
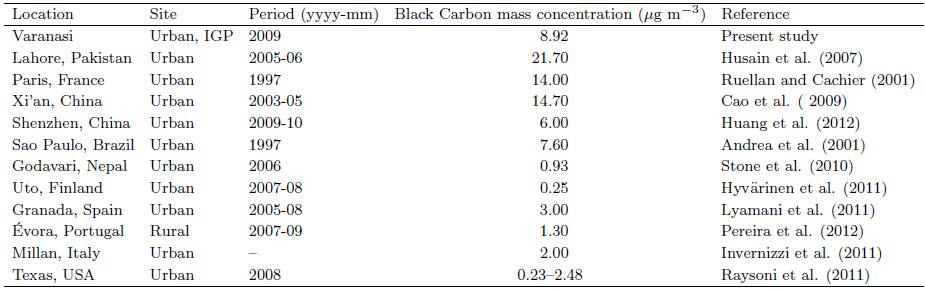
Over the past decade,BC monitoring studies havebeen conducted in urban,rural,coastal,marine, and high altitude environments over the Indian subcontinent(Table 1)(Babu and Moorthy, 2002; Tripathi et al., 2005; Pant et al., 2006; Safai et al., 2007,2008,2013; Awasthy et al., 2010; Dumka et al., 2010a; Pani and Verma, 2010; Ramachandran and Kedia, 2010;Tiwari et al., 2013; Bisht et al., 2015; Singh et al., 2015) and other global locations(Table 2),representing different environments and reflecting the variation in magnitude of BC concentrations from different regions. In India,significant spatial variability inBC was reported for higher concentrations(> 10 µgm−3)over 33 locations in the IGP region(Moorthy and Satheesh, 2011). Lower BC concentrations(approximately 5 µg m−3)were found in southern India(Hyderabad,Bangalore,Pune,Triv and rum,etc.). Inmountainous regions(Nainital,Mukteshwar, and Sinhagad),concentrations have been found to be around2 µg m−3(Pant et al., 2006; Hyvarinen et al., 2009;Dumka et al., 2010b; Raju et al., 2011),except Kullu,where the BC mass concentration was approximately4.6 µg m−3(Kuniyal,2010). The much higher BCmass concentration at Kullu is likely due to vehicular emissions because of the area’s popular touristspots. Meanwhile,BC mass concentrations have beenobserved to be less than 2 µg m−3 at several locations,such as Godavari(Nepal),Uto(Finl and ),Granada(Spain),Ev ´ ora(Portugal), and Millan(Italy)—levelsthat are around six times lower than in Varanasi. However,in Lahore(Pakistan),BC has been measured tobe approximately 2.5 times higher than the values reported in the present study(Husain et al., 2007).
 |
 |
Seasonally,BC was higher during the postmonsoon and winter seasons(approximately 18 µgm−3) and lower in the pre-monsoon/monsoon seasons(approximately 6 µg m−3). Srivastava et al.(2012a)reported that open burning of crop residues is commonpractice in northern India during the pre-monsoon season,resulting in the transport of BC across the region.During most of the winter,the wind is calm,with lowertemperatures,thick fog, and a low MH(Tiwari et al., 2013). Under such conditions,pollutants are not welldispersed,resulting in poor VIS and high local pollutant concentrations(Mohan and Bhati, 2009). Thefrequency distribution of BC was classified into eightdifferent concentration bins(in intervals of 5 µg m−3from < 5 µg m−3 to > 40 µg m−3)during the different seasons(Fig. 3). The distribution was positivelyskewed,except for the bin ranging from 5 to 10 µgm−3,which contributed approximately 46% of the observed concentrations. During the pre-monsoon and monsoon seasons,about 94% and 90% of the levelsof BC mass were < 10 µg m−3,whereas only 30% and 15% were < 10 µg m−3 in the post-monsoon and winter seasons,respectively. During the winter period,which often features deep smog/foggy conditions overthe IGP,BC concentrations were found to be largely(26%)within 15–20 µg m−3,while only 6% of the con centrations was within 30–35 µg m−3. A very highcontribution of BC mass(39%)in the winter was observed within 20–30 µg m−3. Similar characteristicswere apparent during the post-monsoon season,withthe highest frequency(23%)within 20–25 µg m−3.Fewer BC values(1%)were within 35–40 µg m−3.
 |
| Fig. 3 Seasonal and annual frequency distribution of BC mass concentrations over Varanasi. |
The BC concentrations in Varanasi were sortedinto four different seasons above mentioned. Theirseasonal mean diurnal variations are shown in Fig. 4,along with their st and ard deviations. Different diurnal patterns were apparent during the different seasons. The variations were more pronounced duringthe winter and post-monsoon seasons compared withthe pre-monsoon and monsoon seasons. BC showed agradual rise at around 0700 LT(local time),peakingat around 0800–0900 LT. Low values were observed inthe afternoon(1200–1900 LT), and there was a secondary maximum between 2100 and midnight(0100LT). This large diurnal variability in BC mass waslikely due to the combined effect of the diurnal variation in emissions and surface meteorology,including associated boundary layer dynamics. BC concentrations(maximum)during the pre-monsoon,monsoon,post-monsoon, and winter seasons in the morning hours(0800–0900 LT)were approximately 9,8,25, and 21 µg m−3,respectively,more than two tothree times higher than the afternoon hours(1500–1700 LT). For the post-monsoon season,the rise inBC started at 0500 LT and continued until 0800 LT(24.1 µg m−3),followed by a sudden drop in concentration until there incremental rises in values from 2000LTuntil the next morning. In the morning,the surface inversion coupled to layers above a few hours aftersunrise,resulting in the vertical mixing of ground-levelpollutants with the free troposphere and causing thesurface BC concentrations to suddenly decrease. Increased wind speeds after sunrise also increased mixing,thereby facilitating dispersion and dilution. After 0800 LT,BC emissions-primarily from vehiculartraffic-caused increasing BC concentrations. Duringwinter mornings,BC concentrations rose after 0800LT(21.4 µg m−3) and continued until 1000 LT. Afterthat time,they dropped until 1700 LT. The mean BCmass concentrations at night(1800–0600 LT)were approximately twice the daytime values(0700–1700 LT). At night,the highest mean BC concentration was during the post-monsoon season(26.4 µg m−3),followedby the winter(24.3 µg m−3),monsoon(8.6 µg m−3) and pre-monsoon(8.5 µg m−3)seasons. The corresponding night/day ratios were 2.4,1.8,2.4, and 1.3,respectively. The BC concentration reached its minimum between 1400 and 1600 LT in every season dueto the increased MH. After 1800 LT,the evening rushhour commences,as well as an increase in cookingactivity and domestic heating use. Also,the surfaceinversion begins to form trapping pollutants. Subsequently,the BC mass concentration starts increasingfrom the evening onwards. The earlier onset of themorning rise and the later onset of the evening accumulation during the pre-monsoon season,comparedwith winter,correspond to the earlier sunrises and later sunsets in the pre-monsoon season.
 |
| Fig. 4 Seasonal diurnal variability of BC mass concentrations over Varanasi. |
Simpson and McGee(1996)described the markedeffect of the local climate on the diurnal variation ofpollutants due to fumigation effects,which greatly increase daily averages,particularly during winter. Thediurnal BC variations in Varanasi have been observedat a variety of other locations,including a suburbansite in Maryl and ,USA(Chen et al., 2001),the tropical coastal station of Triv and rum(Babu and Moorthy, 2002), and other inl and sites in India(Sreekanth et al., 2007; Tiwari et al., 2013; Bisht et al., 2015).
3.3 BC mass concentration in relation to aerosol optical propertiesBeing highly light absorbent,BC particles affect various optical properties,such as aerosol opticaldepth(AOD),the Ångström exponent(AE), and single scattering albedo,which are responsible for aerosolradiative forcing(Pandithurai et al., 2008). AE is agood indicator of aerosol particle size and largely depends on the aerosol size distribution. It measuresthe comparative contributions of coarse- and finemode particles,where higher values of AE representa higher contribution of fine-mode particles and lowervalues represent a higher contribution of coarse-modeparticles(Pandithurai et al., 2008; Srivastava et al., 2011a; Singh et al., 2014).
During the study period,AOD and AE were retrieved from MODIS(http://gdata1.sci.gsfc.nasa.gov/daac-bin/G3/gui.cgi?instance−id=MODIS−DAILY−L3). The mean AOD(550 nm)was 0.65 ± 0.3,varying from 0.39 ± 0.2(February)to 1.01 ± 0.4(August).The mean AE was 0.83 ± 0.3,varying from 1.19 ± 0.4(January)to 0.56 ± 0.1(July). Its seasonal variability is depicted in Fig. 5. Prasad et al.(2005)reported anAOD over Varanasi during the monsoon period thatwas similar(> 0.6)to the present study. The monthlyAOD increased from April(0.43 ± 0.2)to June(1.01± 0.4), and decreased in July(0.74 ± 0.3),followed bya sudden increase in August(0.98 ± 0.2). The increasemay be due to a long dry period/break phase of themonsoon during this month. AOD increased furtherin October(0.44 ± 0.2) and continued increasing untilDecember(0.77 ± 0.3).
 |
| Fig. 5 Seasonal values of (a) BC and (b) aerosol optical depth (AOD 550 nm) and Ångström exponent (AE) during January–December 2009. |
AOD represents the attenuation of direct solar irradiance. It may be higher in situations where eithercoarse- or fine-mode particles,or both,increase. Alongwith AE,delineation of a higher contribution of fine- orcoarse-mode particles may be deduced. The AOD values were negatively correlated(–0.27)with AE and ,ingeneral,the higher AOD values were associated withlower AE during the pre-monsoon season. This situation suggests that the dominance of coarse-modeparticles was likely due to transported dust(Singh et al., 2005; Srivastava et al., 2011a). Conversely,highAODs were associated with high AE values during thewinter and post-monsoon periods,indicating the dominance of fine-mode particles. Fine particles are mostlyproduced by enhanced anthropogenic activities(Srivastava et al., 2011b). Regression analysis betweenthe AE and BC daily data revealed a significant positive correlation(0.55),indicating that fine particles,including BC,dominated during the study period.Reddy and Venkataraman(2002)reported thatfuel wood and crop wastes were the primary contributors to biomass-based BC emissions in northern India. These estimates were,however,based on annualaverage emissions. It has been shown that,duringNovember and next March,anthropogenic source contributions exceed 70% of the measured AODs in and around India(Ramach and ran, 2004). This high anthropogenic influence on AOD is due to the man-madesubmicron aerosols from local and regional sources.Regional transport is greater during the winter season. AE showed a decreasing trend from January(1.24± 0.30)to May(0.55 ± 0.10), and then increased fromJune onwards,up to a value of 1.20 ± 0.40 in December.
Seasonally averaged AE(Fig. 5)was observed tobe higher during winter(1.16 ± 0.20),followed by thepost-monsoon(0.97 ± 0.20),monsoon(0.76 ± 0.10), and pre-monsoon(0.58 ± 0.10)seasons. Higher BC and AE during the post-monsoon and winter seasonsindicate the dominance of fine particles in this location. A long-term analyses in Delhi by Lodhi et al.(2013), and episodic observations by Pandithurai et al.(2008),showed the lowest AE values in June(approximately 0.4) and highest values(approximately 1.0)in winter,gradually decreasing from winter monthsto a peak during the pre-monsoon months because ofthe increasing importance of soil-derived coarse-modeparticles(dust transport from the nearby Thar desert)(Singh et al., 2005)along with the possible mixing ofboundary layer particles with free tropospheric material caused by surface heating during the pre-monsoonperiod. The observation in Varanasi confirms the dominance of fine-mode particles,largely BC,during thewinter and post-monsoon seasons.
3.4 Spectral aerosol absorption characteristicsBC particles are largely produced by the burningof fossil fuels from transport,industrial activity,thepower sector,etc., and the burning of biomass/biofuels(home heating/cooking,agricultural burning, and wildfires). As noted above,the AAE can help to identifythe possible sources of BC. The AAE values were estimated from BC measurements at seven discrete wavelengths, and its variability is depicted in Fig. 6. Themean value of AAE in Varanasi was 1.02 ± 0.08,varying from 0.73 to 1.32 over the observation period,indicating a strong influence of fossil fuel combustion.Seasonal AAE was generally higher during the postmonsoon and winter seasons, and lower in the premonsoon/monsoon season,following the order: postmonsoon season(1.11 ± 0.10),winter(1.02 ± 0.10),monsoon season(1.01 ± 0.10), and pre-monsoon season(0.98 ± 0.10). These results suggest fossil fuelcombustion as the major source of BC(Soni et al., 2010)during the pre-monsoon and winter periods inVaranasi. In Delhi,a similar AAE value(1.03 ±0.09)was observed with relatively similar seasonal values(Ganguly et al., 2005). However,in central India,Ganguly et al.(2005)reported the AAE value as 1.52,suggesting biofuel/fossil fuel emissions. Bond(2001)reported values of AAE between 1 and 2.9 and suggested that the BC source is residential biofuel burning. Aruna et al.(2013)reported a value of AAEaround 1.1(varying from 0.9 to 1.1)for a tropical location near Chennai. The diurnal variability of AAE fordifferent seasons was examined to separate the possible BC sources in Varanasi(Fig. 7). Two major peakswere observed: morning(0800–1100 LT) and evening(2000–2300 LT),confirming the combined effect as theburning of fossil fuels and biomass during the morning and evening period. In addition,as a rural environment is very close to the city,the people burn anything(e.g.,wood,cow dung,leaves,crop residue,etc.)forheating purposes and for cooking food(during morning and evening),which produces large amounts ofBC.
 |
| Fig. 6 Daily variation of absorption Ångström exponent, along with the running and annual mean, over Varanasi. |
 |
| Fig. 7 Diurnal variations of absorption Ångström exponent over Varanai during January–December 2009. |
The impact of changes in surface meteorological conditions on the BC concentrations was investigated. Regression analysis between daily BC concentrations and surface meteorological parameters inVaranasi during the study period is presented inFig. 8. WS yielded a negative correlation coefficient(–0.50),indicating that increasing WS increased thedilution of local emissions. WS was found to be highest during the pre-monsoon season(11.1 km h−1) and lowest during winter(7.0 km h−1), and the corresponding mean BC values were 6.64 and 18.61 µg m−3,respectively. A similar relationship was observed inAhmadabad(Ramach and ran and Rajesh, 2007) and Delhi(Srivastava et al., 2012a). Cao et al.(2009)observed a strong inverse relationship(–0.66)betweenBC and WS at Xi’an,China,from September 2003to August 2005,implying a local origin for BC. Thesestudies suggested important contributions from locallygenerated BC that accumulate at low WS. Sharma etal.(2002)reported that low WS led to poorer dispersion such that BC remained concentrated aroundthe emissions source. They also found that higher WSwas the driving force for dilution of the BC concentration near the surface due to constant traffic density. These dilution conditions are a general featureover urban and suburban sites, and largely show negative correlation between BC and WS. The strength ofthe correlation between WS and BC is an indicator ofthe proximity of BC sources to the measurement site.Low correlation coefficients suggest that BC originatesfrom distant sources. The mean monthly temperaturein Varanasi was approximately 27℃. It was lower(approximately 19℃)during winter and higher(approximately 32℃)during the pre-monsoon period.
 |
| Fig. 8 Correlation coefficients between BC and the meterological parameters of MH, TEM, RH, VIS, and WS during the study period over Varanasi. |
Low correlation coefficients suggest that BC originates from distant sources. The mean monthly temperature in Varanasi was approximately 27℃. It waslower(approximately 19℃)during winter and higher(approximately 32℃)during the pre-monsoon season.An inverse relationship(–0.32)was observed betweentemperature and BC(Fig. 8),similar to central and southern parts of India at Ahmedabad(Ramach and ran and Rajesh, 2007) and Trivendrum(Babu and Moorthy, 2002). The high BC emissions during thelate post-monsoon and winter seasons,from agricultural burning and biomass burning for heating and cooking,along with the lower MH at that time,led tothe negative correlation between temperature and BC.During the study period,the seasonal MHs were 1277,628,556, and 370 m during the pre-monsoon,monsoon,winter, and post-monsoon seasons,respectively.The MH was shallower during the post-monsoon and winter seasons over Varanasi,resulting in the trappingof locally emitted pollutants and higher BC concentrations. The increase in surface temperature with associated convective activity during the pre-monsoon season improved the dispersion,causing lower surface BCconcentrations. Given the volume into which groundlevel emissions are dispersed,a negative relationshipbetween BC and MH was observed(–0.66). Sloane and White(1986)suggested that the loss of VIS is aneasily measured manifestation of air pollution,arisingfrom the loss of contrast between the object and thebackground and attenuation of the light signal fromthe object due to scattering and absorption of light byfine particles and other atmospheric pollutants. Regression analysis between VIS and BC yielded a largenegative correlation(–0.84). Horvath(1995)suggestedthe absorption of sunlight by BC contributes to reduceVIS in polluted regions. Xu et al.(2012)reported anegative effect of BC on VIS,with a significant correlation of –0.79 between atmospheric VIS and opticalproperties(σscat and σabs),at an urban site in Shang hai,China.
A positive correlation between BC and RH was0.41. RH is high during the monsoon season, and low during the post-monsoon and winter seasons whenthere are higher emissions; thus,this correlation likelyreflects the seasonal variation as discussed previously.
Regression analysis between BC and annual precipitation was studied and a significant negative correlation(–0.35)was found between them(annual rainfallof 876 mm in 2009). Rainfall is high during the monsoon season,so part of this negative correlation mayagain reflect the winter/monsoon seasonal differencesalready presented. In addition,the precipitation willremove some particles from the air through washout.A similar correlation(–0.35)between BC and rainfall was also reported in Ahmadabad(western India)(Ramach and Ramachandran and Rajesh, 2007). A strong correlation(–0.74)between these variables at the Triv and rum coastal station(southern India)was reported because of the heavy rainfall(Babu and Moorthy, 2002).Toanalyze the transport of BC,the surface wind direction data along with the BC mass concentrationover Varanasi was separated and five major wind categories were identified: east(comprising northeasterly,east-northeasterly,easterly, and north-northeasterlywind); west(comprising westerly,west-southwesterly,south-southwesterly, and southwesterly wind); north(comprising northerly,north-northwesterly,northwesterly, and west-northwesterly wind); south(comprising southerly,southeasterly,east-southeasterly, and south-southeasterly wind); and calm(meaning nowind). The observed percentage frequencies of windduring the study period resulted in the order: calm(38%),west(31%),east(18%),south(10%), and north(3%); however,the BC mass concentrations werehighest(38%; 18.1 ± 6.9 µg m−3)during calm conditions,confirming that the major source of BC waslocalized.
4. SummaryIn-situ measurements of BC mass concentrationswere made in Varanasi(an urban environment)in thecentral IGP region of India. For the year 2009,theresults suggest the importance of BC at this location and the need for extensive mitigation activities to reduce the concentrations. The annual mean mass concentration of BC was 8.92 ± 6.98 g m−3,with 34%of the days exceeding this average value. The highest(approximately 46%)mass BC frequency was in therange 5–10 µg m−3; however,during the post-monsoonseason,the higher contribution(23%)was between 20 and 25 g m−3. The BC mass showed gradual buildup at around 0700 LT,peaking at around 0800–0900LT,with low values in the afternoon(1200–1900 LT) and secondary maxima between 2100 LT and midnight(0100 LT). Overall,the nighttime concentrations ofBC were approximately two times higher than thatduring the day,due to the impact of boundary layerconditions. AE was significantly positively correlated(0.55)with surface BC,indicating the impact of BCon columnar aerosols. The estimated mean AAE was1.02 ± 0.08,indicating the combustion of fossil fuelsources. The significant negative correlation(> 0.4)between BC mass and meteorological parameters indicated a pronounced effect on atmospheric dynamicsof the enhancement of BC mass over this region. Thehighest concentration(38%; 18.1 ± 6.9 µg m−3)of BCmass was found under calm wind conditions.
In view of the above,urgent action is needed inreducing the current level of BC in Varanasi. Concentrations of BC in the atmosphere over Varanasi aremuch higher than that in other parts of India and elsewhere around the globe.
Acknowledgments. The authors are gratefulfor the financial support of the ISRO-ARFI program.They also gratefully acknowledge the NOAA Air Resources Laboratory for the provision of the HYSPLIT transport and dispersion model and ready website(http://www.arl.noaa.gov/ready.html)used in thecurrent study. Also acknowledged are the data fromthe Giovanni online data system, and the commentsfrom the anonymous reviewers.
| Andrea, D. A. C., and P. Artaxo, 2001: Wintertime and summertime Sao Paulo aerosol source apportion-ment study. Atmos. Environ., 35, 4889-4902. |
| Aruna, K., T. V. L. Kumar, D. N. Rao, et al., 2013: Black carbon aerosols in a tropical semi-urban coastal en-vironment:Effects of boundary layer dynamics and long range transport. J. Atmos. Solar-Terrest. Phys., 104, 116-125. |
| Arnott, W. P., K. Hamasha, H. Moosmüller, et al., 2005: Towards aerosol light absorption measurements with a 7-wavelength aethalometer: Evaluation with a photoacoustic instrument and 3-wavelength neph-elometer. Aerosol Sci. Technol., 39, 17-29. |
| Awasthy, V., M. K. Kumar, and S. K. Satheesh, 2010: Measurements of aerosol black carbon at an urban site in southern India. Aerosol and Clouds: Climate Change Perspectives, IASTA conference, 19, 463-466. |
| Babu, S. S., and K. K. Moorthy, 2002: Aerosol black car-bon over a tropical coastal station in India. Geophys. Res. Lett., 29, 2098, doi: 10.1029/2002GL015662. |
| Bano, T., S. Singh, N. C. Gupta, et al., 2011: Variation in aerosol black carbon concentration and its emission estimates at the mega-city Delhi. Int. J. Remote Sens., 32, 6749-6764. |
| Beegum, S. N., K. K. Moorthy, S. S. Babu, et al., 2009: Spatial distribution of aerosol black carbon over In-dia during pre-monsoon season. Atmos. Environ., 43, 1071-1078. |
| Bergstrom, R. W., P. Pilewskie, J. Pommier, et al., 2004: Spectral absorption of solar radiation by aerosols during ACE-Asia. J. Geophys. Res., 109, D19S15, doi: 10.1029/2003JD004467. |
| Bisht, D. S., U. C. Dumka, D. G. Kaskaoutis, et al., 2015: Carbonaceous aerosols and pollutants over Delhi urban environment: Temporal evolution, source apportionment, and radiative forcing. Sci. Total Environ., 521-522, 431-445. |
| Bond, T. C., 2001: Spectral dependence of visible light absorption by carbonaceous particles emitted from coal combustion. Geophys. Res. Lett., 28, 4075-4078. |
| Bond, T. C., and R. W. Bergstrom, 2006: Light absorp-tion by carbonaceous particles: An investigative review. Aerosol Sci. Tech., 40, 27-67. |
| Bond, T. C., S. J. Doherty, D. W. Fahey, et al., 2013: Bounding the role of black carbon in the climate system: A scientific assessment. J. Geophys. Res., 118, 5380-5552. |
| Cao, J. J., C. S. Zhu, J. C. Chow, et al., 2009: Black car-bon relationships with emissions and meteorology in Xi'an, China. Atmos. Res., 94, 194-202. |
| Chen, L. W. A., B. G. Doddridge, R. R. Dickerson, et al., 2001: Seasonal variations in elemental carbon aerosol, carbon monoxide and sulfur dioxide: Im-plications for sources. Geophys. Res. Lett., 28, 1711-1714. |
| Collaud, C. M., E. Weingartner, A. Apituley, et al., 2010: Minimizing light absorption measurement artifacts of the Aethalometer: Evaluation of five correction algorithms. Atmos. Meas. Tech. 3, 457-474. |
| Corrigan, C. E., V. Ramanathan, and J. J. Schauer, 2006: Impact of monsoon transitions on the physical and optical properties of aerosols. J. Geophys. Res., 111, D18208, doi: 10.1029/2005JD006370. |
| Dumka, U. C., P. R. Sinha, R. K. Manchanda, et al., 2010a: Seasonal and diurnal variation of black car-bon aerosols over tropical urban site Hyderabad India. Aerosol and Clouds: Climate Change Per-spectives, IASTA Conference, 19(1&2), 440-441. |
| Dumka, U. C., K. K. Moorthy, R. Kumar, et al., 2010b: Characteristics of aerosol black carbon mass concen-tration over a high altitude location in the Central Himalayas from multi-year measurements. Atmos. Res., 96, 510-521. |
| Dumka, U. C., R. K. Manchanda, P. R. Sinha, et al., 2013: Temporal variability and radiative impact of black carbon aerosol over tropical urban station Hyderabad. J. Atmos. Solar-Terrestr. Phys., 105-106, 81-90. |
| Ganguly, D., A. Jayaraman, H. Gadhavi, et al., 2005: Features in wavelength dependence of aerosol ab-sorption observed over central India. Geophys. Res. Lett., 32, L13821, doi: 10.1029/2005GL023023. |
| Horvath, H., 1995: Estimation of the average visibility in central Europe. Atmos. Environ., 29, 241-246. Huang, X. F., T. L. Sun, L. W. Zeng, et al., 2012:Black carbon aerosol characterization in a coastal city in South China using a single particle soot photometer. Atmos. Environ., 51, 21-28, doi:10.1016/j.atmosenv.2012.01.056. |
| Husain, L., V. A. Dutkiewics, A. J. Khan, et al., 2007: Characterization of carbonaceous aerosols in urban air. Atmos. Environ., 41, 6872-6883. |
| Hyvarinen, A. P., H. Lihavainen, M. Komppula, et al., 2009: Continuous measurements of optical proper-ties of atmospheric aerosols in Mukteshwar, north-ern India. J. Geophys. Res., 114, D08207, doi:10.1029/2008JD011489. |
| Hyvarinen, A. P., H. Lihavainen, M. Komppula, et al., 2010: Aerosol measurements at the Gual Pahari EUCAARI station:Preliminary results from in-situ measurements. Atmos. Chem. Phys., 10, 7241-7252. |
| Hyvarinen, A. P., P. Kolmonen, V.-M. Kerminen, et al., 2011: Aerosol black carbon at five background mea-surement sites over Finland, a gateway to the Arctic. Atmos. Environ., 45, 4042-4050. |
| Invernizzi, G., A. Ruprecht, R. Mazza, et al., 2011: Mea-surement of black carbon concentration as an in-dicator of air quality benefits of traffic restriction policies within the ecopass zone in Milan, Italy. At-mos. Environ., 45, 3522-3527. |
| IPCC, 2007: Changes in atmospheric constituents and in radiative forcing. Climate Change 2007: The Phys-ical Science Basis. Contribution of Working Group to the Fourth Assessment Report of the Intergovern-mental Panel on Climate Change. S. Solomon, et al., Eds., Cambridge University Press, Cambridge, UK and New York, NY, USA, 996 pp. |
| Jacobson, M. Z., 2001: Strong radiative heating due to the mixing state of black carbon in atmospheric aerosols. Nature, 409, 695-697. |
| Jacobson, M. Z., 2002: Control of fossil-fuel particulate black carbon and organic matter, possibly the most effective method of slowing global warming. J. Geo-phys. Res., 107, 4410. doi: 10.1029/2001JD001376. |
| Kaufman, Y. J., D. Tanré, and O. Boucher, 2002: A satellite view of aerosols in the climate system. Na-ture, 419, 215-223. |
| Kirchstetter, T. W., T. Novakov, and P. V. Hobbs, 2004: Evidence that the spectral dependence of light absorption by aerosols is affected by organic carbon. J. Geophys. Res., 109, D21208, doi:10.1029/2004JD004999. |
| Kumar, M., S. Tiwari, V. Murari, et al., 2015: Win-tertime characteristics of aerosols at middle Indo-Gangetic Plain: Impacts of regional meteorology and long range transport. Atmos. Environ., 104, 162-175. |
| Kuniyal, J. C., 2010: Aerosols climatology over the north-western Indian Himalayan region. ARFI & ICARB Scientific Progress Report ISRO-GBP, India, 93-99. |
| Lau, K. M., and K. M. Kim, 2006: Observational relation-ship between aerosol and Asian monsoon rainfall, and circulation. Geophys. Res. Lett., 33, L21810, doi: 10.1029/2006GL027546. |
| Liao Hong and Shang Jingjing, 2015: Regional warming by black carbon and tropospheric ozone: A review of progress and research challenges in China. J. Meteor. Res., 29, 525-545. |
| Lodhi, N. K., S. N. Beegum, S. Singh, et al., 2013: Aerosol climatology at Delhi in the western Indo-Gangetic Plain: Microphysics, long-term trends and source strengths. J. Geophys. Res., 118, doi:10.1002/jgrd.50165. |
| Lyamani, H., F. J. Olmo, I. Foyo, et al., 2011: Black carbon aerosols over an urban area in southeastern Spain: Changes detected after the 2008 economic crisis. Atmos. Environ., 45, 6423-6432. |
| Menon, S., J. Hansen, L. Nazarenko, et al., 2002: Climate effects of black carbon aerosols in China and India. Science, 297, 2250-2253. |
| Mishra, A. K., T. Shibata, 2012: Synergistic analyses of optical and microphysical properties of agricultural crop residue burning aerosols over the Indo-Gangetic Basin (IGB). Atoms. Environ., 57, 205-218. |
| Mohan, M., and S. Bhati, 2009: Why is megacity Delhi prone to high atmospheric pollution poten-tial? TFMM-TF HTAP Joint Workshop, Paris, June 2009. |
| Moorthy, K. K., and S. K. Satheesh, 2011: Black carbon aerosols over India. Black Carbon e-Bulletin, ENEP, 3. |
| Moosmüller, H., R. K. Chakrabarty, and W. P. Arnott, 2009: Aerosol light absorption and its measurement:A review. J. Quant. Spectrosc. Rad. Trans., 110, 844-878. |
| Pandithurai, G., S. Dipu, K. K. Dani, et al., 2008: Aerosol radiative forcing during dust events over New Delhi, India. J. Geophys. Res., 113, D13209, doi: 10.1029/2008JD009804. |
| Pant, P., P. Hegde, U. C. Dumka, et al., 2006: Aerosol characteristics at a high-altitude location during ISRO-GBP land campaign-II. Curr. Sci., 91, 1053-1061. |
| Pani, S. K., and S. Verma, 2010: Black carbon and its contribution to aerosol optical depth over Kolkata on the eastern IGP. IASTA Conference Bulletin, 19, 458-460. |
| Pereira, S. N., F. Wagner, and A. M. Silva, 2012: Long term black carbon measurements in the southwest-ern Iberia Peninsula. Atmos. Environ., 57, 63-71. |
| Prasad, A. K., R. P. Singh, M. Kafatos, et al., 2005: Pro-ceedings of symposium S6 held during the Seventh IAHS Scientific Assembly at Foz do Iguacu, Brazil, April 2005. IAHS Publ., 296. |
| Praveen, P. S., T. Ahmed, A. Kar, et al., 2012: Link be-tween local scale BC emissions in the indo-gangetic plains and large scale atmospheric solar absorp-tion. Atmos. Chem. Phys., 12, 1173-1187, doi:10.5194/acp-12-1173-2012. |
| Raju, M. P., P. D. Safai, P. S. P. Rao, et al., 2011: Sea-sonal characteristics of black carbon aerosols over a high altitude station in Southwest India. Atmos. Res., 100, 103-110. |
| Ramachandran, S., 2004: Spectral aerosol optical char-acteristics during the northeast monsoon over the Arabian Sea and the tropical Indian Ocean. 2: Angstrom parameters and anthropogenic in-fluence. J. Geophys. Res., 109, D19208, doi:10.1029/2003JD004483. |
| Ramachandran, S., and T. A. Rajesh, 2007: Black car-bon aerosol mass concentrations over Ahmedabad, an urban location in western India: Comparison with urban sites in Asia, Europe, Canada, and the United States. J. Geophys. Res., 112, D06211. |
| Ramanathan, V., and G. Carmichael, 2008: Global and regional climate changes due to black carbon. Na-ture Geosci., 1, 221-227. |
| Ramachandran, S., and S. Kedia, 2010: Black carbon aerosols over an urban region: Radiative forcing and climate impact. J. Geophys. Res., 115, D10202, doi: 10.1029/2009JD013560. |
| Raysoni, A. U., J. A. Sarnat, S. E. Sarnat, et al., 2011: Binational school-based monitoring of traffic-related air pollutants in El Paso, Texas (USA) and Ciudad Juarez, Chihuahua (México). Environ. Pollut., 159, 2476-2486. |
| Reddy, M. S., and C. Venkataraman, 2002: Inventory of aerosol and sulphur dioxide emissions from India. Part II:Biomass combustion. Atmos. Environ., 36, 699-712. |
| Ruellan, S., and H. Cachier, 2001: Characterisation of fresh particulate vehicular exhausts near a paris high flow road. Atmos. Environ., 35, 453-468. |
| Russell, P. B., R. W. Bergstrom, Y. Shinozuka, et al., 2010: Absorption Angstrom exponent in AERONET and related data as an indicator of aerosol composi-tion. Atmos. Chem. Phys., 10, 1155-1169. |
| Safai, P. D., S. Kewat, G. Pandithurai, et al., 2008: Aerosol characteristics during winter fog at Agra, North India. J. Atmos. Chem., 61, 101-118. |
| Safai, P. D., S. Kewat, P. S. Praveen, et al., 2007: Sea-sonal variation of black carbon aerosols over tropical urban city of Pune, India. Atmos. Environ., 41, 2699-2709. |
| Safai, P. D., M. P. Raju, K. B. Budhavant, et al., 2013: Long term studies on characteristics of black carbon aerosols over a tropical urban station Pune, India. Atmos. Res., 132-133, 173-184. |
| Sandradewi, J., A. S. Prévot, S. Szidat, et al., 2008a: Using aerosol light absorption measurements for the quantitative determination of wood burning and traffic emission contributions to particulate matter. Environ. Sci. Technol., 42, 3316-3323. |
| Sandradewi, J., A. S. Prévot, E. Weingartner, et al., 2008b: A study of wood burning and traffic aerosols in an Alpine valley using a multi-wavelength Aethalometer. Atmos. Environ., 42, 101-112. |
| Satheesh, S. K., and V. Ramanathan, 2000: Large dif-ferences in tropical aerosol forcing at the top of the atmosphere and earth's surface. Nature, 405, 60-63, doi: 10.1038/35011039. |
| Sharma, S., J. R. Brook, H. Cachier, et al., 2002: Light absorption and thermal measurements of black car-bon in different regions of Canada. J. Geophys. Res., 107, 4771, doi: 10.1029/2002JD002496. |
| Sharma, A. R., S. K. Kharol, K. V. S. Badarinath, et al., 2010: Impact of agriculture crop residue burning on atmospheric aerosol loading-a study over Punjab State, India. Ann. Geophys., 28, 367-379. |
| Sheridan, P. J., W. P. Arnott, J. Ogren, et al., 2005: The Reno aerosol optics study: An evaluation of aerosol absorption measurement methods. Aerosol Sci. Technol., 39, 1-16. |
| Simpson, A. J., and O. S. McGee, 1996: Analysis of the fumigation effect on pollutants over Pietermar-itzburg. South African Geograph. J., 78, 41-46. |
| Singh, S., S. Nath, R. Kohli, et al., 2005: Aerosols over Delhi during pre-monsoon months: Characteristics and effects on surface radiation forcing. Geophys. Res. Lett., 32, L13808, doi:10.1029/2005GL023062. |
| Singh, B. P., A. K. Srivastava, S. Tiwari, et al., 2014: Radiative impact of fireworks at a tropical Indian location: A case study. Adv. Meteor., 2014, Article ID 197072, 8. |
| Singh, S., S. Tiwari, D. P. Gond, et al., 2015: Intra-seasonal variability of black carbon aerosols over a coal field area at Dhanbad, India. Atmos. Res., 161-162, 25-35. |
| Sloane, C. S., and W. H. White, 1986: Visibility: An evolving issue. Environ. Sci. Technol., 20, 760-766. |
| Soni, K., S. Singh, T. Bano, et al., 2010: Variations in single scattering albedo and Angstrom absorption exponent during different seasons at Delhi, India. Atmos. Environ., 44, 4355-4363. |
| Sreekanth, V., K. Niranjan, and B. L. Madhavan, 2007: Radiative forcing of black carbon over eastern India. Geophys. Res. Lett., 34, L17818, doi:10.1029/2007GL030377. |
| Srivastava, A. K., K. Ram, P. Pant, et al., 2012a: Black carbon aerosols over Manora Peak in the Indian Hi-malayan foothills: Implications for climate forcing. Environ. Res. Lett., 7, 014002, doi: 10.1088/1748-9326/7/1/014002. |
| Srivastava, A. K., S. Tiwari, P. C. S. Devara, et al., 2011b: Pre-monsoon aerosol characteristics over the Indo-Gangetic Basin: Implications to climatic impact. Annal. Geophys., 29, 789-804, doi: 10.5194/angeo-29-789-2011. |
| Srivastava, A. K., S. Sachchidanand, P. Pant, et al., 2012b: Characteristics of black carbon over Delhi and Manora Peak-a comparative study. Atmos. Sci. Lett., 13, 223-230. |
| Srivastava, A. K., D. S. Bisht, K. Ram, et al., 2014: Characterization of carbonaceous aerosols over Delhi in Ganga basin: Seasonal variability and possible sources. Environ. Sci. Pollut. Res., 21, 8610-8619. |
| Stocker, T. F., D. Qin, G. -K. Plattner, et al., 2014: Climate Change 2013:The Physical Science Basis. Working Group I Contribution to the Fifth Assess-ment Report of the Intergovernmental Panel On Climate Change. Cambridge University Press, New York, N.Y. 115 pp. |
| Stone, E. A., J. J. Schauer, B. B. Pradhan, et al., 2010: Characterization of emissions from South Asian bio-fuels and application to source apportionment of carbonaceous aerosol in the Himalayas. J. Geophys. Res., 115, D06301, doi: 10.1029/2009JD011881. |
| Tripathi, S. N., S. Dey, V. Tare, et al., 2005: Aerosol black carbon radiative forcing at an industrial city in northern India. Geophys. Res. Lett., 32, L08802. |
| Tiwari, S., A. K. Srivastava, D. S. Bisht, et al., 2013: Diurnal and seasonal variations of black carbon and PM2. 5 over New Delhi, India: Influence of meteorol-ogy. Atmos. Res., 125-126, 50-62, doi: 10.1016/j.atmosres.2013.01.011. |
| Tiwari, S., U. C. Dumka, D. G. Kaskaoutis, et al., 2015a: Aerosol chemical characterization and role of carbonaceous aerosol on radiative effect over Varanasi in central Indo-Gangetic Plain. Atmos. Environ., (in press), http://dx.doi.org/10.1016/j.at-mosenv.2015.07.031. |
| Tiwari, S., A. K. Srivastava, A. K. Singh, et al., 2015b: Identification of aerosol types over Indo-Gangetic Basin: Implications to optical properties and asso-ciated radiative forcing. Environ. Sci. Pollut. Res., 22, 12246-12260, doi: 10.1007/s11356-015-4495-6. |
| Vyas, B. M., 2010: Studies of regional features of at-mospheric aerosol, total carbonaceous aerosols and their role in the atmospheric radiative forcing effect over the tropical semi-arid location, i. e., Udaipur, western region part of India. ARFI & ICARB Sci-entific Progress Report ISRO-GBP, India, 67-70. |
| Wang, C., 2004: A modeling study on the climate im-pacts of black carbon aerosols. J. Geophys. Res., 109, D03106, doi: 10.1029/2003JD004084. |
| Wang Xin, Xu Baiqing, and Ming Jing, 2014: An overview of the studies on black carbon and mineral dust deposition in snow and ice cores in East Asia. J. Meteor. Res., 28, 354-370. |
| Weingartner, E., H. Saathoff, M. Schnaiter, et al., 2003: Absorption of light by soot particles: Determi-nation of the absorption coefficient by means of AETHALOMETERS. J. Aero. Sci., 34, 1445-1463. |
| Xu, J. W., J. Tao, R. J. Zhang, et al., 2012: Measure-ments of surface aerosol optical properties in winter of Shanghai. Atmos. Res., 109-110, 25-35. |
| Srivastava, M. K., S. K. Srivastava, A. Saha, et al., 2011a: Aerosol optical properties over Delhi and Manora Peak during a rare dust event in early April 2005. Internat. J. Remote Sens., 32, 7939-7954, doi: 10.1080/01431161.2010.523732. |
| Virkkula, A., T. Makela, R. Hillamo, et al., 2007: A simple procedure for correcting loading effects of aethalometer data. J. Air Waste Manage. Assoc., 57, 1214-1222. |
| Tiwari, S., A. K. Srivastava, D. S. Bisht, et al., 2009:Black carbon and chemical characteristics of PM10 and PM2.5 at an urban site of North India. J. At-mos. Chem., 62, 193-209. |