 2015, Vol. 28
The Chinese Meteorological Society
Article Information
- ZHI Rong, WANG Qiguang, FENG Guolin, FENG Aixia. 2015.
- Using Moving North Pacific Index to Improve Rainy Season Rainfall Forecast over the Yangtze River Basin by Analog Error Correction
- J. Meteor. Res., 28(4): 627-638
- http://dx.doi.org/10.1007/s13351-015-4019-9
Article History
- Received 2014-9-30;
- in final form 2015-6-17


2 China Meteorological Administration Training Center, China Meteorological Administration, Beijing 100081;
3 National Meteorological Information Center, China Meteorological Administration, Beijing 100081
The seasonal forecast over China, particularly over the mid-to-lower reaches of the Yangtze River(MLRYR)region, is recognized as a scientific challenge; thus, the seasonal forecast skill of rainy season rainfall(RSR)in this region is low(Zhao,2001; Zhao and Liu, 2003). To improve the seasonal forecast skill, a series of methods has been proposed, including ensemble forecast, physical model forecast, and model post-processing techniques(Barnett and Preisendorfer, 1978; Tao et al., 2003; Wei et al., 2005; Wang and Fan, 2009; Guo et al., 2012; Yu et al., 2014). Among them, the forecast of the model’s prediction error by using historical data is a compelling research direction(Chou,1974; Cao,1993; Ren and Chou, 2005). On the basis of Cao(1993),Feng et al.(2001,2004) and Feng and Dong(2003)developed a regional climate self-memory model for RSR forecast over the Yangtze River basin. This model uses a new retrospective time integration scheme that can dynamically calculate the self-memory function of the system from past timelevel data. This scheme is able to better capture the trend of summer precipitation patterns in the Yangtze River basin and improve the prediction skill to some degree. With the data accumulation and model improvement, dynamic seasonal prediction methods and associated prediction skills were both correspondingly improved(Chou,1986; Ren et al., 2006; Ren and Chou, 2007a; Zheng et al., 2009). However, the current operational prediction skill for RSR remains far from the level dem and ed; thus, further improvements are urgently required.
Complex factors influence the RSR over the MLRYR, including joint effects of multiple factors in addition to the effect of single or some combination of several factors(Chen,1984; Wu and Liu, 1995; Tao and Wei, 2006; Zhao and Zhou, 2006; Wang and Ding, 2008; Jia et al., 2010). Previous studies have suggested that the Pacific sea surface temperature has an important impact on the RSR over the MLRYR(Huang and Sun, 1994; Wu and Liu, 1995; Liu and Ding, 2009). However, these studies focused mainly on the tropical Pacific and Northwest Pacific regions; research on the relationships between North Pacific and RSR over the MLRYR is rare.
Trenberth and Hurrell(1994), and Trenberth and Hoar(1996)defined an average sea level pressure(SLP)anomaly series over North Pacific(30°–65°N,160°E–140°W)as the North Pacific index(NPI). They discovered that the source of the decadal variation of the NPI came from the tropical Pacific, and that the atmospheric response to the tropical forcing plays an important role in North Pacific SLP decadal changes. In their study, the NPI was derived from the NOAA data. Recently,Zhi et al.(2009)calculated the spatial correlation matrices of global temperature based on the NCEP/NCAR reanalysis data and defined a moving NPI(MNPI)as the most significant gridpoint value of the strongest negative correlation center within North Pacific(27.5°–47.5°N,157.5°E– 147.5°W). They found an obvious decadal variation signature in the temporal evolution of the MNPI location. Compared with the traditional NPI, MNPI is able to trace the dynamic variation of the position of the strongest negative correlation center and its intensity changes, and it is also able to reflect the impact of global gridpoints on the North Pacific region. Therefore, we use NPI and MNPI in RSR prediction over the MLRYR to examine the possible effects of North Pacific SLP on remote precipitation.
This study first analyzes the MNPI and NPI temporal evolution characteristics, and investigates their relationships with the RSR over the MLRYR. Because the prediction error of a CGCM can be forecast with analog information of historical data(Ren and Chou, 2005,2007a), analog error fields for seasonal precipitation prediction are selected by using MNPI and NPI. The selected fields are integrated by using the Euclidean distance-weighted method with simultaneous introduction of the empirical orthogonal function(EOF)degree compression into the CGCM prediction error correction. Then, a new prediction error correction scheme, the MNPI scheme, is developed. Moreover, independent sample hindcasts for 2003–2009 are performed, with a focus on the RSR over the MLRYR(27.5°–32.5°N,110°–122.5°E; 18 total gridpoints)to verify the effectiveness of the MNPI scheme.
2. Data and methods 2.1 Data and prediction evaluationThe RSR forecast dataset during 1983–2009 examined in this study was generated by the atmosphereocean coupled CGCM of the National Climate Center(NCC)of China without prediction error correction. The yearly prediction error fields of the RSR were calculated on the basis of the hindcast precipitation fields from the NCC CGCM and the RSR data from the Climate Prediction Center(CPC)Merged Analysis of Precipitation(CMAP)from 1983 to 2009(as the observation), and the climate mean state of the RSR was calculated from the CMAP data from 1983 to 2002. The hindcast results were evaluated by using the three indicators recommended by the World Meteorological Organization(WMO): the temporal correlation coefficient(TCC), the anomaly pattern correlation coefficient(ACC), and the root-mean-square error(RMSE). TCC is used for measuring the correlation of two time series, with values between +1 and –1. ACC measures the phase difference between a predicted climate anomaly and its observed counterpart.When the two anomalies have an identical or opposite phase, the ACC score is 1 or –1, respectively. The RMSE measures the effectiveness of a prediction, with a smaller value indicating higher prediction accuracy.
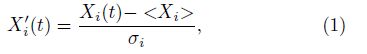
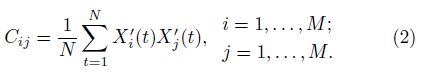
The MNPI is defined as the most significant gridpoint value of the strongest negative correlation center within North Pacific(27.5°–47.5°N,157.5°E– 147.5°W). The spatial correlation matrices of global temperature based on the NCEP/NCAR reanalysis data were first calculated. The time series of global temperature are Xi(t),i = 1,. . .,M; t = 1,. . .,N. We then have
 . The correlation coefficient Cij is calculated as
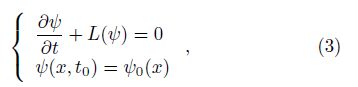
Because the atmosphere is an open dissipative nonlinear system, various atmospheric states are exhibited in the adaptation to external forcing. Longrange forecast data suggest that the evolution of atmosphere within a certain time range from the initial time is similar when the initial and boundary conditions of the atmospheric system are similar(Ren and Chou, 2007b). Gu(1958)proposed that the initial value problem of numerical weather prediction(NWP)can be converted by using historical meteorological data. Chou(1986)theoretically discussed the principles and methods of combining dynamics and statistics of long-range NWP. These works provided theoretical bases for using available historical information in the prediction error correction of NWP models. In general, the numerical prediction model can be regarded as the initial value problem of certain partial differential equations, which is expressed as
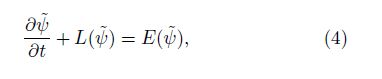
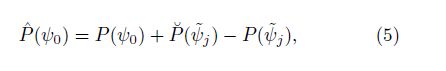
 is forecast through the error analog estimate,P(ψ0)is the model state variable of ψ0,
 is the historical analog of the future observations, and
  is the forecast of the historical analog initial values. In the above equation, the current forecast errors are estimated through historical analog error data. Then, the model error is reduced, and dynamical forecast becomes an estimation of forecast errors.
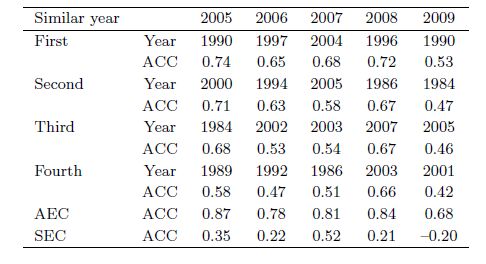
Table 1 lists the ACCs between the prediction error fields from 2005 to 2009, and their respective first four similar years in the 27-yr period of 1985– 2009. The four analog years for each of these five years were easily identified by the year of higher ACC in the early stages. The annual arithmetic mean of the prediction error fields of the first four analog years was used to correct the model prediction of that year. The ACCs between the corrected prediction field and the observed field from 2005 to 2009 were 0.87,0.78,0.81,0.84, and 0.68, respectively, with an average of 0.80 over the five years. Obviously, this is an ideal case. However, when the system error correction(SEC)was used rather than AEC, the corresponding ACCs were 0.35,0.22,0.52,0.21, and –0.20, with an average of 0.22 over the same five years.
 |
It is then inferred that if particular techniques are used to determine the analog year of the prediction error field of the prediction year from historical datasets, the prediction effectiveness of the CGCM might be significantly improved. Therefore, an essential technique is in the combination of dynamic and statistical prediction. Then, the prediction error of the CGCM can be forecast by using the analog information of historical data.
In this study, the MNPI and NPI were taken as early-stage(1982–2008)factors. The Euclidean distance of the values between prediction year and earlystage years was used to determine the analog year of the prediction error for the prediction year. The precipitation prediction error of the prediction year was estimated by using the smallest Euclidean distance of the first four analog years within the early stage(Huang et al., 1993; Ren and Chou, 2007a; Zheng et al., 2010).
3. Relationships between MNPI/NPI and regional RSRFigure 1 shows the temporal evolution of MNPI and NPI in the early stage, which both display an overall upward trend during 1983–2009. Figure 1a shows that the MNPI first rapidly increased from 1982 to 1986 to reach the peak value. It then declined slowly before entering a period of increase again to reach its maximum value in 1997. It fell into a rapid decline, followed by a relatively stable period, which weakly fluctuated around its mean value in the 21st century. These changes show obvious decadal features in the MNPI. In contrast,Fig. 1b shows that the NPI exhibited distinctive interannual variability during most of the early stage. It oscillated around its mean value with large amplitudes during 1982–1991 and then entered a period of quasi-biennial oscillations from 1993 to 2000. After a short period of adjustment, the NPI re-entered a period of quasi-biennial oscillations after 2005.

|
| Fig. 1 Temporal evolution of(a)moving North Pacific index(MNPI) and (b)North Pacific index(NPI)from 1982 to 2009. Trends are represented by the thick solid line. |
The TCC between the MNPI and NPI series in the 27-yr period was –0.15, implying complicated airsea interaction in North Pacific with no obvious correlation. The MNPI captured the essential temporal evolution feature of the interaction, particularly the decadal variation. Figure 2 shows the temporal evolution of the 10-yr moving correlation coefficients of the MNPI and NPI with the regional mean RSR over the MLRYR and its prediction error produced by the CGCM. As shown in Figure 2a and Figure 2b, the correlation coefficient of the MNPI changed from positive to negative value in 1998, which closely corresponded to a change in the trend of regional rainfall from an increase to a decline in the same year. Thus, the MNPI was able to better describe the decadal variation and objectively reflected the decadal variation feature of North Pacific climate background fields. However,Figure 2c and Figure 2d show that quasi-7-yr oscillations existed in the temporal evolution of the two TCCs of NPI, weakly reflecting the decadal variation to some degree. The correlation coefficients of the two indices between the precipitation observation and the forecasting error of the model are consistent, as shown in Fig. 2, indicating similar variations in the precipitation observation and its forecasting error. Therefore, the physical factors affecting regional precipitation, such as SST, were selected as precursory signals for abstracting the analog years. The factors should not only be statistical significant but also maintain stability, in order to have a sound result in the prediction process.

|
| Fig. 2 The 10-yr moving correlation coefficient of the MNPI and NPI with(a, c)regional mean precipitation and (b, d)model prediction error over the MLRYR. |
MNPI and NPI schemes were employed separately in the AEC experiments of RSR over the MLRYR to investigate their possible impacts on precipitation prediction. The commonly used SEC scheme was also performed for comparison.
The average ACC over the 27-yr cross-validation with the prediction error correction increased from –0.01 in the SEC scheme to 0.14 in the MNPI AEC scheme(abbreviated as MNPI scheme, same for NPI scheme). The ACC of the SEC scheme was greater than that of the MNPI scheme in only 7 yr, mainly before 2000, including 1986,1987,1989,1990,1992,1993, and 2007. That is, the precipitation prediction was improved during 20 yr of the 27-yr period by using the MNPI scheme based on extraction of the useful analog information from the historical weather data(Fig. 3a). Correspondingly, the average TCC over the 27-yr period also increased from –0.34 to –0.06, with a most obvious increase of 0.28 in northern and southern parts of the MLRYR. Furthermore, because the effectiveness of the MNPI scheme has been stable and maintained at a higher skill level in the 21st century with an ACC greater than 0.1, the influence of the MNPI on the RSR over the MLRYR has a decadal variation and has become relatively distinctive in the 21st century.

|
| Fig. 3 Comparison of the MNPI analog error correction(AEC)scheme and system error correction(SEC)scheme in the 27-yr prediction error correction experiment, showing(a)yearly anomaly pattern correlation coefficient(ACC) and spatial patterns of the temporal correlation coefficient(TCC)for(b)SEC scheme and (c)MNPI AEC scheme. |
The average ACC of the NPI scheme over the 27- yr period was 0.05(Fig. 4a), slightly higher than that of SEC scheme. However, the ACC of the former was higher than that of the latter for 13 yr but lower for the remaining 14 years. The average TCC of the NPI scheme was –0.22(Fig. 4b), an increase over –0.34 of the SEC scheme. Therefore, the above comparisons also indicate that the MNPI and original NPI schemes differ such that the former might be more effective than the latter in RSR prediction over the MLRYR, as measured in terms of ACC and TCC.

|
| Fig. 4 Comparison of the MNPI AEC with NPI AEC scheme and SEC scheme in the 27-yr prediction error correction experiments, showing(a)yearly ACC and (b)spatial pattern of the TCC for the NPI AEC scheme. |
To investigate the impacts of the MNPI and NPI on the RSR over the MLRYR, independent sample hindcasts were performed for the SEC, NPI, and MNPI schemes during 2003–2009. Table 2 lists the analog years used in AEC for each of the seven years. The analog years selected by the NPI and MNPI schemes were seldom identical for a same hindcast year, which indicates that the evolution laws of the two early stage factors, MNPI and NPI, were different, thereby confirming that they are not closely related.
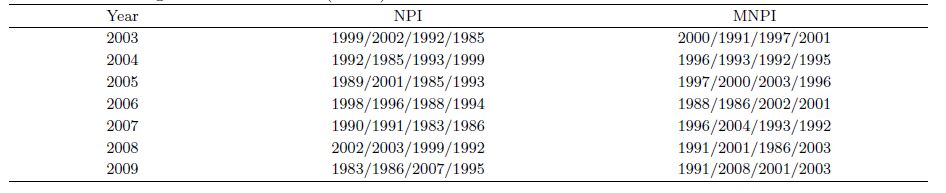 |
Table 3 gives the ACCs of prediction error fields of a hindcast year and its four analog years from 2003 to 2009, where 1,2,3, and 4, respectively denote the first with the least Euclidean distance, second, third, and fourth analog years for the hindcast year; AM(WM)denotes the ACC between the actual prediction error field of a hindcast year and the arithmetic(weighted)mean field of the prediction error fields of its four analog years; the SEC denotes the ACC between the actual prediction error field of a hindcast year and its SEC field. When the NPI was used(NPI scheme), the average ACCs of the first, second, third, and fourth analog years from 2003 to 2009 were –0.05,–0.06,–0.14, and –0.25, respectively, and the average ACC for the AM field was –0.22. When the MNPI was used(MNPI scheme), the corresponding average ACCs were 0.24,0.13,0.07, and 0.09, respectively, and the average ACC for the AM field was 0.37. Therefore, in terms of averaged ACC, the effect of the MNPI scheme is better than that of the NPI AEC and SEC schemes.
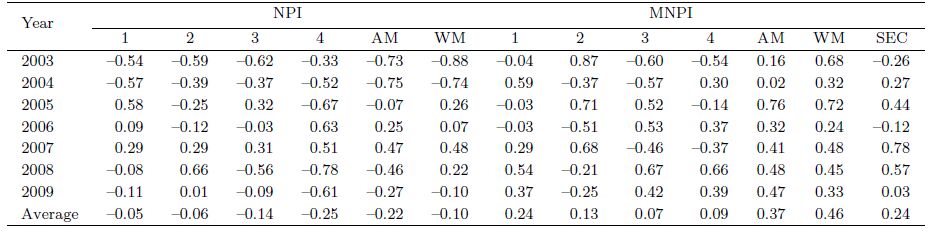 |
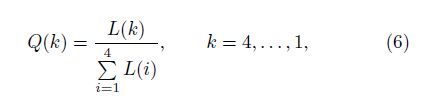
Regardless of whether the NPI or MNPI was used in the selection of the four analog years of error field prediction, and the average ACC for the first analog year was greater than that for the second analog year. Afterward, the ACC successively decreased, which indicates that the correction effect of the first analog year was better than that of the remaining three years on the whole(Table 3). The comparison revealed that for a hindcast year, the ACC of its four analog years may be positive or negative, and their differences are distinctive. To achieve a better effect, a weighted mean based on Euclidean distance rather than a simple arithmetic mean was used to calculate the AEC of hindcast years. The weights(Q(k))of the prediction error fields of the first four analog years were calculated according to Eq.(6):
Three error correction schemes of SEC and NPI/MNPI weighted AEC were employed in the 2003– 2009 independent sample hindcasts, and the predicted yearly RSR percentage anomalies were compared with the actual values. Figure 5 plots the ACC and RMSE of the three correction schemes in the 7-yr hindcasts.

|
| Fig. 5 (a)ACC and (b)root-mean-square error(RMSE; mm)for SEC, the NPI weighted AEC scheme, and the MNPI weighted AEC schemes in the independent sample hindcasts from 2003 to 2009. |
The average ACC of the SEC scheme from 2003 to 2009 was 0.28, and the average RMSE of precipitation was 99.48 mm. In contrast, the average ACC of the NPI weighted AEC scheme was –0.13, lower than that of the SEC scheme, and the average RMSE was 117.72 mm,22.92 mm larger than that of SEC scheme. The average ACC for the MNPI weighted AEC scheme over 7 yr was 0.47,0.19 higher than that for the SEC scheme, except for 2009. The ACC of the remaining six years reached 0.3, and the average RMSE was 98.04 mm, lower than that of the SEC scheme. The above comparison suggests that in terms of ACC and RMSE, improvement of the MNPI AEC scheme in the recent 7-yr independent sample hindcast is more obvious than the SEC and NPI AEC schemes. Moreover, the early-stage factor of the MNPI plays an important role in improving the AEC scheme and the RSR regional prediction of the CGCM.
6. Hindcasts based on the degree compression of prediction error fieldsIn general, model prediction error includes initial value error, errors from model inaccuracy, and computational error. Moreover, it can be theoretically proved that the atmosphere is able to nonlinearly adapt to external forcing. That is, many small-scale components of information dissipation are omitted with an increase in time, and only a few dimensions remain to support the atmospheric attractor(Chou,1974). Therefore, the prediction error of a model can be decomposed into its EOF components, and the first several principle components, which can accumulatively explain most of the total variance, can be regarded as major information of the prediction error field. They can then be forecast with the analog information in historical data. The remaining EOF components can be regarded as stochastic errors, which are unpredictable, and can be replaced with the historical mean state. Figure 6a plots the average ACC over the 27-yr period in the cross-validation of the weighted MNPI AEC scheme, in which various numbers of EOF components were used. Only the first three EOF components, which accumulatively explained 80% of the total variance, were used in the AEC, and the average ACC between the predicted and observed precipitation fields reached 0.13. With the increase in the number of components, the average ACC was basically in a stable state and showed a slightly declining trend. Figure 6b shows that when a single EOF component was used in the AEC, although the average ACC for the first component was smaller, those for the second and the third components were both greater than 0.10. Moreover, the fourth component, the corresponding ACC, tended to be in a stable state, generally less than zero. Therefore, in the AEC process, if only first several principle components are used, effectiveness of the AEC can be achieved, and the influence of stochastic errors can be filtered out.

|
| Fig. 6 ACCs of AEC in cross-validation in which various numbers of principle components were used:(a)accumulative principle component and (b)single principle component. |
To verify the effectiveness of the degree compression of prediction error fields in the AEC,2003– 2009 independent sample hindcasts were performed. Only the principle components that accumulatively explained 80% of the total variance were used in AEC. The results are plotted in Fig. 7a.

|
| Fig. 7 ACC of 2003–2009 independent sample hindcasts using the weighted AEC scheme based on the degree compression of the prediction errors of the coupled general circulation model(CGCM):(a)accumulative principle component explaining 80% of the total variance and (b)single principle component. |
Figure 7a shows that the ACCs of the RSR hindcasts during 2003–2009 with the weighted AEC scheme were 0.76,0.81,0.28,0.67,0.63,0.50, and 0.2, respectively. The average ACC value was 0.55,0.27 higher than that with the SEC scheme. This suggests that the weighted AEC with the degree compression of prediction error fields is improved in comparison with the weighted AEC without degree compression. Figure 7b gives the 7-yr average ACC of the independent sample RSR hindcasts using the weighted AEC in which only a single EOF component was used; the remaining EOF components were replaced with their historical means. When the first three EOF components were used in the AEC, the average ACCs over the 7-yr period were all larger than 0.32. The fourth component, the average ACC for the AEC scheme, was approximately 0.25, lower than 0.28 for the SEC scheme. This result confirms that the AEC based on the degree compression of the CGCM prediction error fields can capture the major regional characters of the prediction error fields. Moreover, it can filter out the influence of noise and improve the prediction skill. The weighted AEC scheme is summarized in the flowchart shown in Fig. 8.

|
| Fig. 8 Flowchart for the MNPI weighted AEC scheme. |
AEC experiments with MNPI and NPI of 27- yr regional precipitation data were performed in this study. The results are summarized in the following:
1)The MNPI is related to the annual mean rainfall and CGCM RSR prediction error over the MLRYR in the rainy season. This relationship is reflected in a decadal variation feature of the 10-yr moving correlation coefficients of the MNPI. The correlation coefficients were positive before 1998 but negative afterward. In addition, a periodical variation of quasi-7 yr was detected in the correlations among the NPI, the annual mean rainfall, and the CGCM RSR prediction error over the MLRYR in the rainy season. The amplitudes of the decadal and quasi-7-yr variations showed a reducing trend.
2)The 27-yr cross validation of the MNPI and NPI AEC schemes indicated that the performance of the former was better than that of the latter and the traditional SEC scheme, as measured in terms of ACC and RMSE. The CGCM error can be partly forecast by using the analog information extracted from historical data.
3)The 7-yr(2003–2009)independent sample hindcasts of the RSR using the MNPI AEC scheme suggests that this scheme can effectively improve the prediction skill of regional rainfall over the MLRYR. The ACC score of this scheme was 0.47, reflecting the distinctive impact of the MNPI on the RSR over the MLRYR.
4)On the basis of weighted AEC, the degree compression of prediction error fields using EOF decomposition was introduced into the AEC scheme. The AEC was applied only to the principal components that accumulatively explained 80% of the total variance, which further improved the forecast skill of the RSR over the MLRYR; the average ACC score over the 7-yr independent sample hindcasts was 0.55. This result demonstrates the potential advantage of degree compression on the prediction of regional precipitation.
The forecast of the RSR prediction error using the MNPI and further development of the CGCM AEC scheme over the MLRYR were also investigated in this study. The results show that the new scheme can significantly improve the RSR prediction skill. However, only a single early-stage factor was used in the AEC scheme. The special cases dominated by abnormal factors in the early stage were not tested, which might have a distinct effect on regional precipitation. These problems need to be further investigated in future research. In addition, the Euclidean distance-weighted mean and the degree compression used in this study might have potential application values and need to be further verified in future studies.
| Barnett, T. P., and R. W. Preisendorfer, 1978: Multifield analog prediction of short-term climate fluctuations using a climate state vector. J. Atmos. Sci., 35, 1771-1787. |
| Cao Hongxing, 1993: Self-memory equation for atmospheric motion. Sci. China (Ser. B), 23, 104-112. |
| Chen Longxun, 1984: East Asian monsoon circulation system structure and its medium range changes. Acta Oceanol. Sinica, 6, 744-758. |
| Chou Jifan, 1974: A problem of using past data in nu-merical weather porecasting. Scientia Sinica, 17, 814-825. |
| Chou Jifan, 1986: Why and how to combine dynamics and statistics. Plateau Meteor., 5, 367-372. (in Chinese) |
| Feng Guolin, Cao Hongxing, Wei Fengying, et al., 2001: On area rainfall ensemble prediction and its ap-plication. Acta Meteor. Sinica, 59, 206-212. (in Chinese) |
| Feng Guolin and Dong Wenjie, 2003: Evaluation of the applicability of a retrospective scheme based on comparison with several difference schemes. Chi-nese Physics, 12, 1076-1086. |
| Feng Guolin, Dong Wenjie, and Jia Xiaojing, 2004: Application of a retrospective time integration scheme to the prediction of torrential rain. Chinese Physics, 13, 413-422. |
| Gu Zhenchao, 1958: On use of historical data in numerical weather prediction. Acta Meteor. Sinica, 29, 176-184. (in Chinese) |
| Guo Ling, He Jinhai, and Zhu Congwen, 2012: Evaluations of prior potential predictors for the summer rainfall in the middle and lower reaches of the Yangtze River. Chinese J. Atmos. Sci., 36, 337-349. (in Chinese) |
| Huang Jianping, Yi Yuhong, Wang Shaowu, et al., 1993: An analogue-dynamical long-range numerical weather prediction system incorporating historical evolution. Quart. J. Roy. Meteor. Soc., 119, 547-565. |
| Huang Ronghui and Sun Fengying, 1994: Impacts of the thermal state and the convective activities in the tropical western warm pool on the summer climate anomalies in East Asia. Scientia Atmos. Sinica, 18, 141-151. (in Chinese) |
| Jia Xiaolong, Chen Lijuan, Li Weijing, et al., 2010: Statistical downscaling based on BP-CCA: Predictabil-ity and application to the winter temperature and precipitation in China. Acta Meteor. Sinica, 68, 398-410. (in Chinese) |
| Liu Yunyun and Ding Yihui, 2009: Influence of the western North Pacific summer monsoon on summer rainfall over the Yangtze River basin. Chinese J. Atmos. Sci., 33, 1225-1237. (in Chinese) |
| Ren Hongli and Chou Jifan, 2005: An analogue error cor-rection scheme combining statistics and dynamics. Acta Meteor. Sinica, 63, 988-993. (in Chinese) |
| Ren Hongli, Zhang Peiqun, Li Weijin, et al., 2006: A new method of dynamical analogue prediction based on multi-reference-state updating and its application. Acta Physica Sinica, 55, 4388-4396. (in Chinese) |
| Ren Hongli and Chou Jifan, 2007a: Study on the strategy and methodology for dynamic-analogue prediction. Sci. China (Ser. D), 37, 1101-1109. |
| Ren Hongli and Chou Jifan, 2007b: Study progress in prediction strategy and methology numerical model. Progress in Earth Science, 22, 376-385. (in Chinese) |
| Tao Shiyan, Zhao Sixiong, Zhou Xiaoping, et al., 2003: The research progress of the synoptic meteorology and synoptic forecast. Chinese J. Atmos. Sci., 27, 451-467. (in Chinese) |
| Tao Shiyan and Wei Jie, 2006: The westward, northward advance of the subtropical high over West Pacific in summer. J. Appl. Meteor. Sci., 17, 513-525. (in Chinese) |
| Trenberth, K. E., and J. W. Hurrell, 1994: Decadal atmosphere-ocean variations in the Pacific. Climate Dyn., 9, 303-319. |
| Trenberth, K. T., and T. J. Hoar, 1996: The 1990-1995 El Niño-Southern Oscillation event: Longest on record. Geophys. Res. Lett., 23, 57-60. |
| Wang Huijun and Fan Ke, 2009: A new scheme for improving the seasonal prediction of summer precipitation anomalies. Wea. Forecasting, 24, 548-554. |
| Wang Zunya and Ding Yihui, 2008: Climatic characteristics of summer intraseasonal oscillations in wet/dry years over the mid-lower reaches of Yangtze River. J. Appl. Meteor. Sci., 19, 710-715. (in Chinese) |
| Wei Jie, Zhang Qingyun, and Tao Shiyan, 2005: The ensemble seasonal climate prediction for 2004 summer and its verification. Climatic Environ. Res., 10, 19-31. (in Chinese) |
| Wu Guoxiong and Liu Huanzhu, 1995: Neighbourhood response of rainfall to tropical sea surface temperature anomalies. Part I: Numerical experiment. Scientia Atmos. Sinica, 19, 422-434. |
| (in Chinese) Yu Haipeng, Huang Jianping, Li Weijing, et al., 2014: Development of the analogue-dynamical method for error correction of numerical forecasts. J. Meteor. Res., 28, 934-947, doi: 10.1007/s13351-014-4077-4. |
| Zhao Ping and Zhou Xiuji, 2006: Decadal variability of rainfall persistence time and rainbelt shift over east-ern China in recent 40 years. J. Appl. Meteor. Sci., 17, 548-556. (in Chinese) |
| Zhao Zhenguo, 2001: The development of short-pange climate prediction technique in China. Shandong J. Meteor., 21, 4-7. (in Chinese) |
| Zhao Zhenguo and Liu Haibo, 2003: Progress in the oper-ational technology of short-term climate prediction in China. Zhejiang J. Meteor., 24, 1-6, 46. (in Chinese) |
| Zheng Zhihai, Huang Jianping, and Ren Hongli, 2009: Analogue correction of errors based on seasonal climatic predictable components and numerical ex-periments. Acta Physica Sinica, 58, 7359-7367. |
| Zheng Zhihai, Feng Gulin, Chou Jifan, et al., 2010: Com-pression for freedom degree in numerical weather prediction and the error analogy. Chinese J. Appl. Meteor., 21, 139-148. (in Chinese) |
| Zhi Rong, Gong Zhiqiang, Zheng Zhihai, et al., 2009: Scale analysis of global temperature based on corre-lation matrix theory. Acta Physica Sinica, 58, 2113-2120. (in Chinese) |