 2015, Vol. 28
The Chinese Meteorological Society
Article Information
- LIAO Hong, SHANG Jingjing. 2015.
- Regional Warming by Black Carbon and Tropospheric Ozone: A Review of Progresses and Research Challenges in China
- J. Meteor. Res., 28(4): 525-545
- http://dx.doi.org/10.1007/s13351-015-4120-0
Article History
- Received 2014-11-24;
- in final form 2015-4-10


2 Climate Change Research Center, Chinese Academy of Sciences, Beijing 100029; 3 Graduate University of Chinese Academy of Sciences, Beijing 100049;
The globally averaged combined l and and oceansurface temperature exhibited a warming of 0.85 [0.65–1.06]℃ over 1880–2012, as reported by the IntergovernmentalPanel on Climate Change(IPCC)WorkingGroup I Fifth Assessment Report(AR5)(IPCC,2013). Human activities contributed to changes intemperature through changing concentrations of bothwell-mixed greenhouse gases(WMGHGs, includingcarbon dioxide(CO2), methane(CH4), nitrous oxide(N2O), and halocarbons) and short-lived species(nitrogen oxides(NOx), carbon moNOxide(CO), nonmethanevolatile organic compounds(NMVOCs), troposphericO3, aerosols, and aerosol precursors). Theradiative forcing(RF)values over 1750–2011 estimatedby the IPCC AR5 are 3.00 W m−2 by emissionsof WMGHGs and –0.64 W m−2 by emissions ofshort-lived species(Fig. 1), indicating that short-livedspecies also play important roles in climate change.Among the short-lived species, tropospheric O3 isestimated to have a global mean RF of 0.40 W m−2(Table 8.6 in IPCC(2013)).

|
| Fig. 1 Radiative forcing estimates in 2011 relative to 1750 and aggregated uncertainties for the main drivers of climatechange. Positive(negative)radiative forcing indicates a warming(cooling)effect on climate.(Source: Figure SPM.5 ofIPCC WGI AR5 Summary for Policymakers(IPCC,2013)) |
Short-lived species influence climate change inseveral ways depending on their chemical and physicalproperties. Firstly, the short-lived gases can influenceconcentrations of WMGHGs and aerosols bychemical reactions. For example, CO, NMVOCs, and NOx are precursors of tropospheric O3. Emissions ofCO and NMVOCs lead to CO2 formation in the atmosphere.Emissions of NOx in the atmosphere influenceconcentrations of CH4 by altering OH concentrations, and also contribute to nitrate aerosol formation.Secondly, some of the short-lived species, such astropospheric O3 and aerosols, exert radiative forcingto the energy balance of the earth’s climate system.Tropopspheric O3 is a greenhouse gas that leads toglobal warming(Fig. 1). Aerosols influence climateby interactions with radiation through scattering orabsorbing of solar or longwave radiation, and by interactionswith clouds through altering cloud properties.Major anthropogenic aerosol species in the atmosphereinclude sulfate, nitrate, ammonium, organiccarbon(OC), and black carbon(BC), all of which havea cooling effect on climate except that BC has a warmingeffect. Thirdly, short-lived species participate incomplex biogeochemical processes that can influenceconcentrations of WMGHGs. For example, the depositionof nitrogen and O3 can influence carbon cycle bychanging l and cover(Lamarque et al., 2005; Janssens et al., 2010).
Due to the unidentified sinks for atmosphericCO2,Jacobson(2005)assumed that CO2 has a lifetimeof 30–95 yr. Prather et al.(2012)derived that thepresent-day atmospheric lifetime is 9.1±0.9 yr for CH4 and 131±10 yr for N2O. Tropospheric O3 was reportedto have a lifetime of about 3 weeks based on modelingstudies(Liao and Seinfeld, 2005; Stevenson et al., 2006). Aerosols have even shorter lifetimes of severaldays(Kaufman et al., 2000). Jacobson(2004)comparedthe time-dependent changes in globally averagednear-surface temperature due to eliminating anthro-pogenic emissions of each of CO2, CH4, as well as BC and OC from fossil fuel and biofuel sources. Consideringthat BC and OC were co-emitted species fromanthropogenic and biomass burning sources, Jacobson(2004)suggested that the control of BC+OC may bethe most effective method of slowing global warmingfor a specific period(about 10 yr), although OC itselfhas a cooling effect. The assessment report of UnitedNations Environment Programme(UNEP,2011)proposedtwo approaches to mitigate global warming:one is to control the peak temperature by reducingthe concentrations of short-lived species, such as BC, CH4, and tropospheric O3; the other is to control thelong-term climate warming by reducing CO2 concentrations.UNEP(2011)demonstrated by simulationsof climate models that reductions in BC and troposphericO3 can be an effective method to slow the rateof climate change within the first half of this century.Climate benefits from reduced O3 are achieved by reducingemissions of some of its precursors, especiallymethane that is also a powerful greenhouse gas.
With the rapid economic development, concentrationsof short-lived species are relatively high inChina; hence quantifying the role of short-lived speciesin regional and global climate change is especiallyimportant. Despite the complex interactions amongWMGHGs and short-lived gases, this review is focusedon BC and tropospheric O3 due to their warming effects(Fig. 1). Ground and satellite measurements ofconcentrations or optical properties of BC and troposphericO3 over China, as well as the model estimatesof radiative forcing by these two species are summarized.We also review regional and global modelingstudies which have investigated climate change drivenby BC and tropospheric O3 in China. Based on thereview of previous studies, the key priorities for futureresearch on climatic effects of BC and troposphericO3 are highlighted. This review is mainly focused onthe studies of BC and tropospheric O3 by Chinese scientistsover the past several years, and the climaticimpacts are confined to the impacts of BC and O3in the atmosphere within the Chinese territory. Notethat China’s climate may be affected by BC and O3outside China due to complex feedbacks in the climatesystem.
2. Black carbon and its climatic effects 2.1 EmissionsBC(alternatively referred to as elementary carbon and soot)is released into the atmosphere duringthe incomplete combustion of fossil fuel, biofuel, and biomass. Emissions of BC in China are large due toits large population, substantial fuel consumption, and often-inefficient combustion conditions, which were reportedto be responsible for about 19% of the globalBC emission(Qin and Xie, 2012).
Figure 2 shows the spatial distributions of BCemissions. BC emissions were much higher in easternChina than in western China. Western China istypically low in emissions, due to the relatively underdevelopedeconomy and the small consumption of fossilfuels. Western regions, including Tibet, Xinjiang, Qinghai, Gansu, and Ningxia, cover 42.4% of territory, made up only 3.8%,4.0%,4.7% and 5.7% of nationalBC emissions in 1985,1995,2005, and 2009(Qin and Xie, 2012), respectively. Table 1 summarizes BCemissions in China from different studies. The annualtotal emission of BC in China after 2006 exceeded 1.79Tg yr−1(Zhang Q. et al., 2009; Qin and Xie, 2012;Wang et al., 2012). According to Lu et al.(2011), the percentage contributions from sectors of power, industry, residential, transport, and biomass burning to thetotal BC emission in China were 1.1%,27.1%,50.6%,15.3%, and 5.9%, respectively, in 2010(Table 1).

|
| Fig. 2 Spatial distributions of BC emissions(GgC grid−1)at a resolution of 0.1°× 0.1°in 2010. Theemissions were compiled by the Emissions Databasefor Global Atmospheric Research(EDGAR)team and are downloaded from http://edgar.jrc.ec.europa.eu/htap−v2/index.php?SECURE=123. |
 |
Due to the different instruments used to measureconcentrations, BC was also reported as elementarycarbon or soot in previous studies. From a measurementst and point, BC mostly refers to aerosol measuredwith photo-absorption techniques, whereas elementarycarbon mostly refers to aerosol measured withthermal/optical techniques. The mass concentrationsdetermined with these two techniques can sometimesbe significantly different. For the purpose of this review, we consider BC and elementary carbon to beequivalent in our review and refer the readers to Table 2 for the BC measurement methods used in the studiesreviewed below.

Since 1999, carbonaceous aerosols have been measuredat numerous locations in China at remote sites(Qu et al., 2006), regionally representative rural sites(Zhang et al., 2005; Gao et al., 2008), and urban sites in large and mega cities(Xu et al., 2002; Cao et al., 2007; Zhang X. et al., 2008; Cao et al., 2009). Figure 3 presents the measured BC concentrations in 2006 at18 stations in China(Zhang X. et al., 2008). The averageannual mean concentration of BC was 0.35±0.01μg m−3 at the remote background sites of Shangri-la, Zhuzhang, and Akdala,3.6±0.93 μg m−3 at the regionalsites of Taiyangshan, Longfengshan, Dunhuang, Lin’an, Jinsha, Lhasa, Nanning, Dalian, Gaolanshan, Shangdianzi, and Zhenbeitai, and 11.2±2.0 μg m−3at the urban sites of Panyu, Zhengzhou, Chengdu, Gucheng, and Xi’an. The highest annual mean BCconcentration of 14.2 μg m−3 was found at Xi’an in2006(Zhang X. et al., 2008). Similar magnitudes ofmeasured BC concentrations were also reported in thestudy of Cao et al.(2007).

|
| Fig. 3 Locations and annual averaged concentrations ofobserved BC in 2006. The concentrations at Shangdianzi, Zhenbeitai, Akdala, Shangri-la, and Zhuzhang were from2004 to 2005.(Source: Fig. 1 of Zhang X. et al.(2008)) |
Measured concentrations of BC in China showedstrong seasonal variations, with maximum concentrationsin winter and minimum values in summer(Cao et al., 2007,Cao 2009; Zhang X. et al., 2008). Cao et al.(2007)showed that the observed BC concentrationsaveraged over the 14 cities in China were 9.9 μg m−3in winter(6–20 January) and 3.6 μg m−3 in summer(3 June–30 July)of 2003. Such seasonal variationscan be explained by the largest coal combustion inwinter and the largest precipitation associated withthe East Asian summer monsoon that washes out BCin summer.
Historical changes in BC are important for under-standing the historical changes in climate. Changesin deposition of BC in China were reconstructed byusing ice core records(Xu et al., 2009; Cong et al., 2013)or lake sediments(Han et al., 2011). extracted ice cores from five sites in theTibetan Plateau and found that the average BC concentrationsin ice cores increased from 4.57 ng g−1 in1956 to 12.5 ng g−1 in 2006. Han et al.(2011)used a150-yr(1850–2000)sediment record of Lake Chaohu inAnhui Province and showed that BC concentrations inthe sediment exhibited stable low values(below 150000ng g−1)prior to the late 1970s, and a sharp increase to450000 ng g−1 in the last three decades, correspondingwell with the rapid industrialization of China. Conget al.(2013)reported the variation of BC in sedimentof Nam Co Lake in the Tibetan Plateau. From the1850s to the early 1900s, deposition fluxes of BC toNam Co Lake were generally constant, which can beconsidered as background level without significant disturbancefrom human activities. After the 1900s, BCfluxes showed a gradual and continuous increase, indicatingthat the influence from anthropogenic sourcesbegan in the interior of the Tibetan Plateau. Fromthe 1960s to the early 2000s, the increasing trend ofBC deposition flux accelerated significantly. Note thatBC in ice core or lake sediment is dependent on BCconcentrations in the atmosphere as well as wet and dry deposition of atmospheric BC.
As reviewed above, previous measurements of BCwere quite limited to BC at the surface. The observationsof vertical distribution of BC are needed forthe studies of climatic effect of BC, considering thata large fraction of BC particles from biomass burningin South Asia can be transported to the middle troposphereover China in spring of every year(Zhang et al., 2010b). The measurements of size distribution arealso essential, because recent observational study indicatedthat quite a large fraction of BC in China canstay in coarse mode(Wang et al., 2014). Note that thestudies of climatic effect of aerosols require long-termmeasurements, since climate represents multi-year averagesof meteorological parameters.
2.3 Optical properties of BCAerosol optical depth(AOD)represents light at tenuation by aerosols, which is an important parameterthat determines the climatic effect of aerosols. Figure 4 shows the annual mean AOD retrieved by ModerateResolution Imaging Spectrometer(MODIS)thatis averaged over 2001–2010. The high AOD values of0.5–0.9 occurred over a large fraction of eastern China.The AOD values exceeded 0.5 over the heavily pollutednorthern China, the Sichuan basin, the Yangtze RiverDelta, and the Pearl River Delta. Such features ofAOD were captured by many modeling studies(e.g.,Ma et al., 2007; Cui et al., 2009; Zhang et al., 2010a;Lou et al., 2014).
For BC, its unique strong absorption of solarradiation is represented by aerosol absorption opticaldepth(AAOD), or the non-scattering fraction ofAOD. Figure 5 shows the AErosol RObotic NETwork(AERONET)sunphotometer and Ozone MonitoringInstrument(OMI)satellite retrievals of clearskyAAOD. Measurements from AERONET showedthat the AAOD values were in the range of 0.015–0.07, with high values over northern China where concentrationsof both BC and mineral dust aerosols werehigh. On an annual mean basis, AERONET AAODover Asia(30°–70°N,100°–160°E)was 0.036, whichwas much higher than the AAOD of 0.007 over NorthAmerica(20°–55°N,130°–70°W) and of 0.015 overEurope(30°–70°N,15°W–45°E)(Koch et al., 2009).The AAOD values from OMI exhibited high values ofexceeding 0.05 over northern China, the Sichuan basin, and the south border of China. Note that both BC and mineral dust aerosols absorb radiation, so AAOD is a useful measure of BC in regions where mineral dust isnot a dominant species.

|
| Fig. 4 Annual mean AOD retrieved by Moderate ResolutionImaging Spectrometer(MODIS)that is averaged over2001–2010. MODIS datasets are level 3 products downloadedfrom http://ladsweb.nascom.nasa.gov. |

|
| Fig. 5 Aerosol absorption optical depth(AAOD,×100)from AERONET(at 676 nm, color circles) and OMI(at 500 nm, color shades). AERONET measurementswere carried out in different years; the AAODfor a specific site is the average over years with measurementsavailable. The OMI datasets downloadedfrom http://disc.sci.gsfc.nasa.gov/giovanni are averagedover 2005–2007. The AERONET datasets are downloadedfrom http://aeronet.gsfc.nasa.gov/cgi-bin/climo−menu−v2−new. |
The single scattering albedo(SSA)represents theratio of aerosol scattering coefficient to extinction coefficient.It is an important optical parameter that determineswhether aerosols have a cooling or a warmingeffect. Over a specific location, SSA is dependent onthe mixing of scattering and absorbing aerosol species.Ramanathan et al.(2001)showed that SSA exceeding0.95 led to a negative aerosol forcing at the topof atmosphere(TOA) and SSA less than 0.85 led toa positive forcing. Bergin et al.(2001)reported thatthe values of SSA were about 0.81 in polluted northernChina. Lee et al.(2007)found that the averageof SSA values over China was 0.89±0.04 at 500 nmfor 2005. Table 3 summarizes ground-based measurementsof SSA in China from the literature. The largedifferences in SSA can be explained by the differencesin shape, size, chemical composition, and hydroscopicgrowth of aerosol particles.
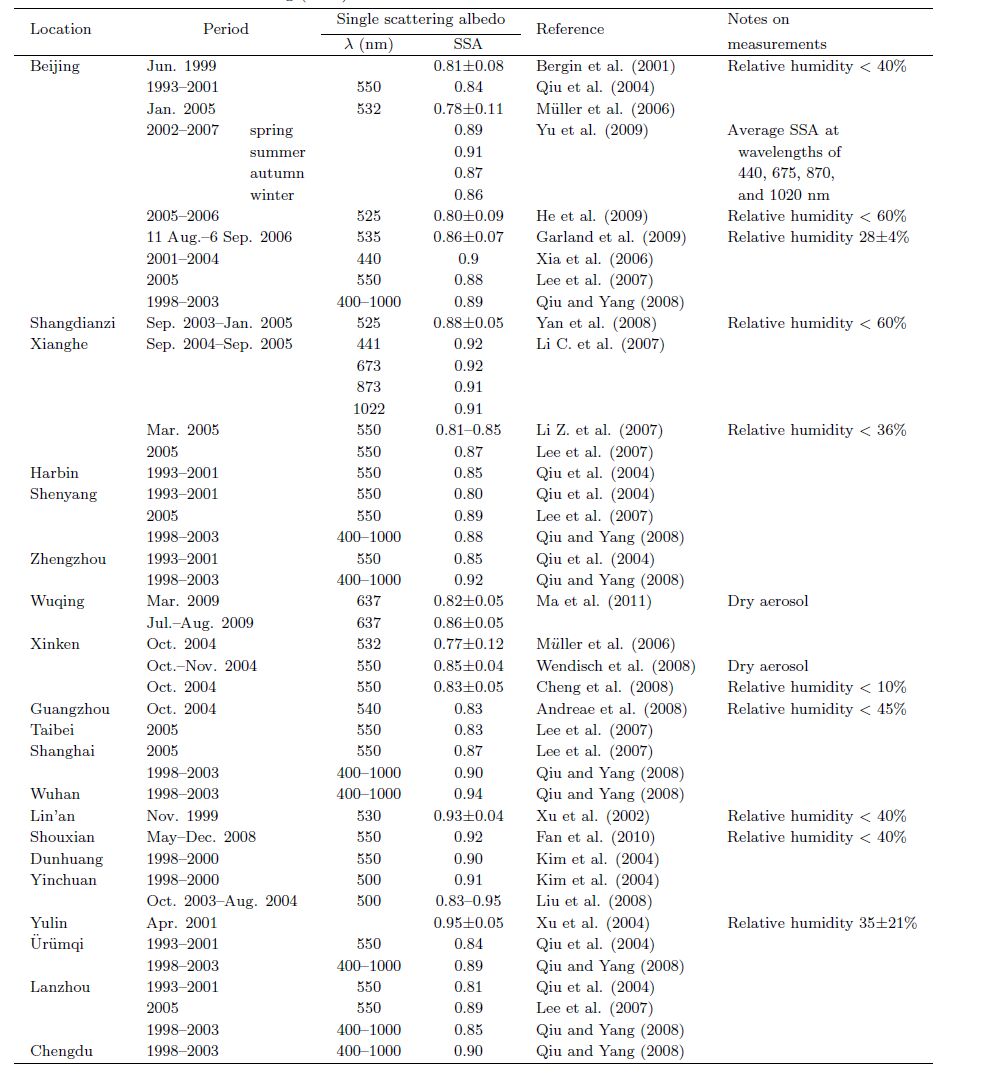 |
Qiu and Yang(2008)showed that measured SSAvalues were the smallest in winter among all seasons.The increase in BC emission might have led to the decreasein SSA in Beijing during 1993–2001(Qiu et al., 2004). Lyapustin et al.(2011)examined AOD valuesin Beijing from both the AERONET measurements and the MODIS retrievals, and reported an increasingtrend in SSA in Beijing during 2007–2010 relativeto the previous 5 years. Particularly, as dust particleswere mixed with anthropogenic aerosols duringthe transport, SSA values generally showed increases, because the retrieved SSA of dust ranged from 0.92(at 0.44 μm)to 0.97(at 1.02 μm) and the SSA of anthropogenicaerosols ranged from 0.89±0.04(at 0.44μm)to 0.83±0.05(at 1.02 μm)(Xia et al., 2005). Caoet al.(2014)also reported that SSA increased duringdust events in Beijing in 2005.
2.4 Radiative forcing of BC in ChinaTable 4 summarizes the estimated radiative forcing(RF)of BC over China, including direct radiativeforcing(DRF), first indirect radiative forcing(FIRF), and semi-direct radiative forcing. The DRF reviewedin this work refers to an instantaneous change in net(downward minus upward)radiative flux(shortwaveplus longwave, in W m−2)due to an imposed changein concentration of a chemical species(i.e., BC in thissection and O3 in Section 3.3). The semi-direct effectof BC is the difference in cloud forcing with and withoutthe impact of BC on SSA of cloud droplet(Zhuang et al., 2010a), and the FIRF of BC is the change incloud forcing with and without the impacts of BC oneffective radius of cloud droplets(Zhuang et al., 2013).The RF of BC is usually defined in terms of change innet radiative flux at the TOA or at the surface.
The DRF of BC is always positive at the TOA and negative at the surface, with the spatial distributionof DRF at the TOA similar to that of DRF at thesurface. Chung and Seinfeld(2005), by using a globalclimate model with online simulation of BC, reportedthat the present-day maximum TOA all-sky BC DRFover eastern China was about 5–6 W m−2 on an annualmean basis. Zhang H. et al.(2008), by using theglobal aerosol dataset in a radiative transfer model, showed that the TOA clear-sky BC DRF over easternChina reached 3.2 and 4.0 W m−2 in winter and summer, respectively. Wu et al.(2008)simulated by usingthe Regional Climate Chemistry Modeling System(RegCCMs)found that BC DRF values were strongerin southern China than in northern China during thisperiod; the all-sky BC DRF was 0.64 W m−2 at theTOA and –1.69 W m−2 at the surface over northernChina(32°–50°N,105°–120°E), while it was 1.55 Wm−2 at the TOA and –3.10 Wm−2 at the surface oversouthern China(22°–30°N,100°–120°E). Zhang H. etal.(2009) and Wang et al.(2009)estimated the DRFof BC by using the global Community AtmosphereModel Version 3(CAM3). Under all-sky conditions, the present-day annual mean BC DRF over easternChina was simulated to be 2.5Wm−2 at the TOA and –3.2W m−2 at the surface. Zhuang et al.(2010b)estimatedthat the annual mean BC DRF values at TOAwere 1.02 W m−2 for clear skies and 0.75 W m−2 forall skies over China(25°–45°N,100°–130°E)in 2006.Zhuang et al.(2013)showed that the annual mean BCDRF over China(20°–50°N,100°–130°E)was 0.81 Wm−2 at the TOA in 2006, and the strongest TOA BCDRF was 6.0 W m−2 over the Sichuan basin. Amongthe BC DRF estimates for China, the values obtainedby Zhang et al.(2012)were relatively small; the simulatedannual mean TOA BC DRF exhibited maximumvalue of 1.0 W m−2 under all-sky and of 0.8 W m−2under clear-sky conditions. The low bias in simulatedBC column burden might have led to the small BCforcing in Zhang et al.(2012).
BC can act as cloud condensation nuclei(CCN) and influence cloud albedo, exerting a negative FIRFat the TOA. Zhuang et al.(2009)reported that theregional average(20°–50°N,90°–120°E)of TOA BCFIRF was –0.39 W m−2 in January and –1.18 W m−2 in July 2003. Zhuang et al.(2013)estimated that theTOA FIRF of BC was –0.95 W m−2 over China(20°–50°N,100°–130°E), which was larger than its DRF, leading to a net RF of BC of –0.15 W m−2 at theTOA for 2006.
BC can burn clouds through heating the ambientair around and clouds(semi-direct effect of BC), which reduces cloud cover and allows more shortwaveradiative fluxes to reach the surface. Zhuang et al.(2010a)showed that the average semi-direct RF valuesover eastern China(20°–50°N,100°–130°E)were0.04,0.10,0.09, and 0.06 W m−2 at the TOA in January, April, July, and October 2003, respectively.
As shown in Table 4, the simulated regional meanDRF values are in the range of 0.75–2.5 Wm−2, whichare significant as compared to the global mean radia tive forcing values of BC, tropospheric O3, and CO2.IPCC(2013)reported that between 1750 and 2011, the global and annual mean RF values of BC, troposphericO3, and CO2 were 0.40(0.05–0.80)W m−2,0.40(0.20–0.60)W m−2, and 1.82(1.63–2.01)W m−2, respectively. Recently,Bond et al.(2013)reported theannual mean BC DRF exceeded 5 W m−2 over a largefraction of eastern China, which further underscoresthe importance of BC in regional warming of climate.However, few studies have examined semi-direct and indirect effect RF of BC; the RF values of semi-direct and indirect effect of BC have large uncertainties and are subject to further studies.

Increases in BC concentrations in the atmospherewere simulated to lead to a warming over China.Chang et al.(2009)found by using a coupled globalaerosol-climate model that the direct effect of BCincreased the surface air temperature averaged overeastern China(20°–50°N,100°–130°E)by 0.62℃ over1950–2000. Jiang Y. et al.(2013)used the NCARCommunity Atmospheric Model version5(CAM5) and found that during 1850–2000, the direct and indirecteffects of BC led to changes in surface air temperatureby –0.6 to 0.3 K over East China(20°–45°N,105°–122.5°E). Guo et al.(2013)reported by usingthe United Kingdom High-Resolution Global EnvironmentModel(HiGAm)that BC direct effect changedthe monthly and regional mean surface air temperatureover East Asia(20°–45°N,100°–122°E)by–0.4 to 0.1 K during April–September. The simulatednegative changes in temperature by BC indicated thecomplex BC-cloud feedbacks.
BC affects the large-scale circulation and hydrologicalcycle by heating the air and hence altering theregional atmospheric stability. Menon et al.(2002)considered the direct effect of BC in the Goddard Institutefor Space Studies(GISS)global climate model and reported that the radiative effect of BC in China and India led to the observed “northern droughts and southern floods” in China over the past severaldecades. Chang et al.(2009)used a coupled globalaerosol-climate model and found that the direct effectof BC increased precipitation over 1950–2000 by0.07 mm day−1 as precipitation was averaged overeastern China(20°–50°N,100°–130°E). Zhuang et al.(2013)showed by using the RegCCMs that the combinedeffect of BC(semi-direct plus indirect effect)led to regional mean change in precipitation by –0.09mm day−1(or –7.4%)over eastern China(20°–50°N,100°–130°E)for 2006. Jiang Y. et al.(2013)consideredboth direct and indirect effects of BC in theNCAR CAM 5 and reported that BC led to summertimechange in precipitation by –0.08 mm day−1 from1850 to 2000 as precipitation was averaged over EastChina(20°–45°N,105°–122.5°E).
BC also contributes to the retreat of the glaciersover the Himalayas(Ming et al., 2008; Xu et al., 2009;Menon et al., 2010; Kopacz et al., 2011; Wang Z. et al., 2011; Wang X. et al., 2014). As BC is depositedover snow and sea ice, it significantly enhances solarabsorption by snow and ice. Ming et al.(2008)estimatedradiative forcing by using BC retrieved from a40-m shallow ice core from the East Rongbuk Glacierin the high Himalayas. They reported a local radiativeforcing of as large as 5.0 W m−2 by BC deposited inthe glacier, suggesting that BC in the atmosphere overthe Himalayas and consequently in the glaciers cannotbe neglected when assessing the dual warming effectson glacier melting. Menon et al.(2010)simulated byusing the NASA GISS climate model(ModelE)withon-line aerosol chemistry that about 0.9% of snow/icecover decreases over the Himalayas during 1990–2000was caused by direct effect, indirect effect, and depositionof BC aerosol. Wang Y. et al.(2011)simulated byusing the BCC−AGCM that the regional mean radiativeforcing due to BC deposited on snow/ice reached2.8 W m−2 over the Tibetan Plateau and led to increasesin annual mean temperature by 1.6 K in thatregion.
Modeling studies reviewed above show large uncertainties, either in simulated radiative forcing or insimulated climate responses, although the regional and global climate models start to have the capabilitiesto simulate BC-radiation and BC-cloud interactions.The uncertainties arise in part from emissions inventories, representation of concentrations, vertical profiles, mixing states, and optical properties of BC. The representationof the aging of BC and the role of BC ascloud condensation nuclei remains to be the most difficultchallenges in simulation of climatic effect of BC(IPCC,2013). Nationwide long-term measurements ofaerosol concentrations, aerosol optical properties, and cloud properties in China are called for to constrainmodel simulations.
3. Ozone and its climatic effects 3.1 Emission of O3 precursorsThe most important O3 precursors in the atmosphereinclude NOx, CO, and volatile organic compounds(VOCs). Motor vehicle exhaust, industrialemissions, and chemical solvents are the major anthropogenicsources of these chemicals. As an example,Table 5 summarizes the annual emissions of NOx, CO, and NMVOCs in eastern China(20°–50°N,110°–126°E), which are based on David Streets’ 2006 emissioninventory(http://mic.greenresource.cn/intex-b2006)(Zhang Q. et al., 2009). Note that troposphericO3 has a lifetime of about 3 weeks(Liao and Seinfeld, 2005; Stevenson et al., 2006) and therefore a large fractionof O3 in China can be attributed to backgroundO3 and anthropogenic emissions from foreign countries(Wang Y. et al.(2011)).
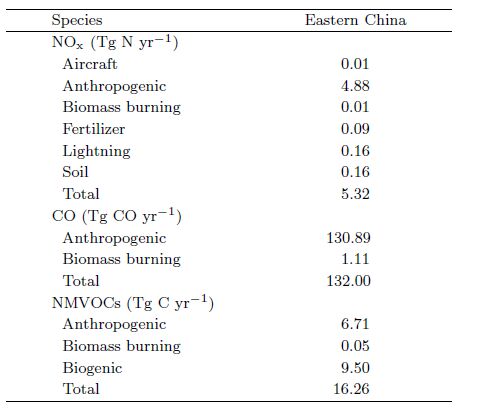
Figure 6 shows the distributions of seasonal meansurface-layer concentrations of O3 simulated for 2006in the study of Lou et al.(2014)by using a globalchemical transport model. Simulated concentrationsof O3 in eastern China are the lowest in DJF because of the weak photochemistry as a result of weak solarradiation in this season. Concentrations of O3 in easternChina in MAM and SON are in the ranges of 40–55 and 35–50 ppbv, respectively. The maximum O3concentrations over eastern China are simulated to be60–75 ppbv in JJA. Note that the high O3 concentrationsof exceeding 70 ppbv over the Tibetan Plateau inMAM result from the transport of O3 from the stratosphereto troposphere(Wild and Akimoto, 2001).

|
| Fig. 6 Simulated seasonal mean surface-layer concentrations(ppbv)of O3 for 2006.(a)DJF(December–January–February),(b)MAM(March–April–May),(c)JJA(June–July–August), and (d)SON(September–October–November), respectively.(Remade from Fig. 2 of Lou et al.(2014)) |
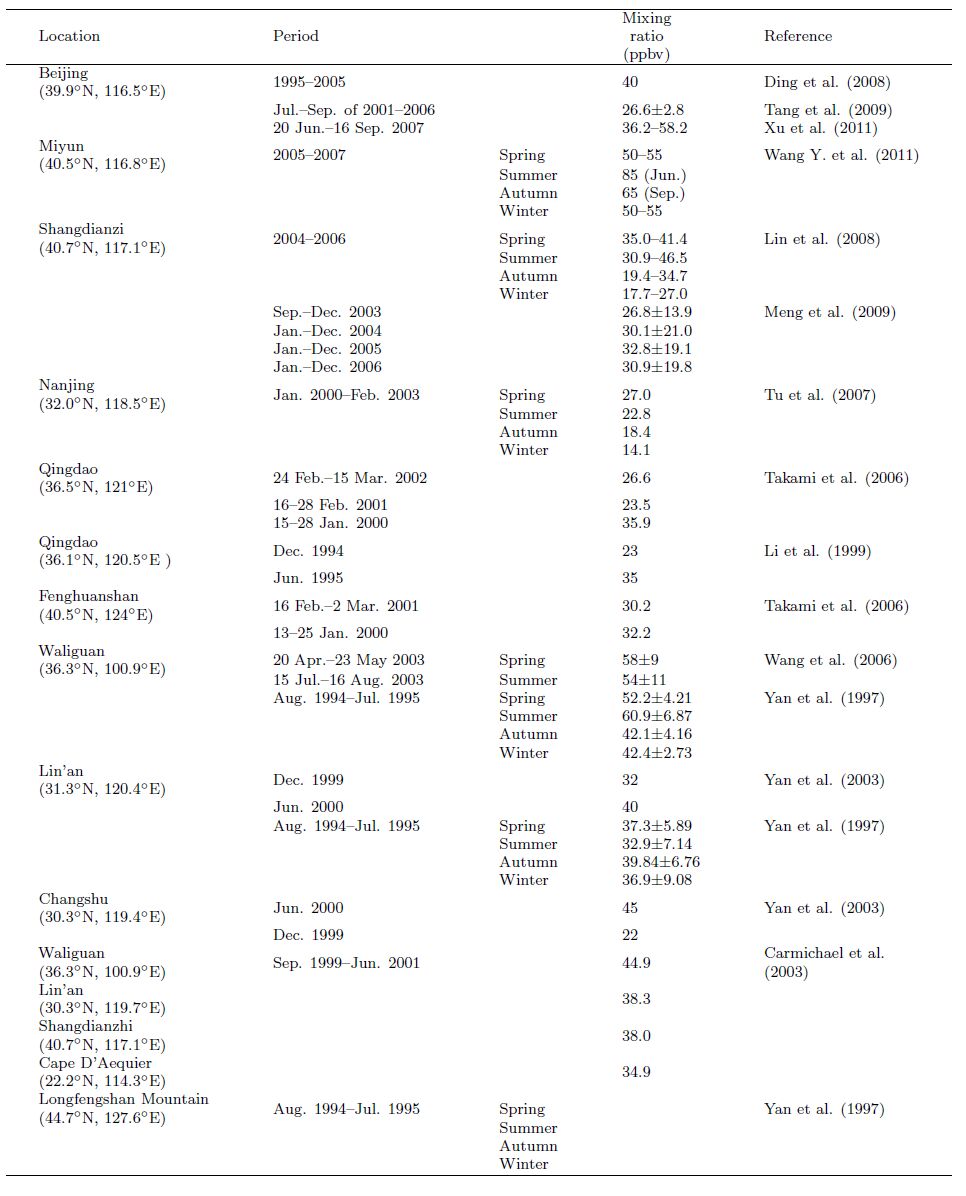
Table 6 compiles the ground-based measurementsof O3 in China from the literature. DuringJuly–September of 2001–2006, the average measuredO3 concentrations at 6 urban sites in Beijingwas 26.6±2.8 ppbv(Tang et al., 2009). At remotesites(Fenghuanshan(40.5◦N,124◦E), Waliguanin the Qinghai-Tibetan Plateau(36.3◦N,100.9◦E), Lin’an(31.3◦N,120.4◦E), and Longfengshan Mountain(44.7◦N,127.6◦E)), O3 concentrations were generallyin the range of 20–60 ppbv(Yan et al., 1997,2003; Wang et al., 2004; Takami et al., 2006; Wang et al., 2006). The background O3 concentrations arerelatively higher in western China as a result of thetransport of O3 from the stratosphere. For example, concentrations at Waliguan(36.3◦N,100.9◦E)were inthe range of 40–60 ppbv, which were higher than themeasured values at other background stations. Withrespect to the long-term trend of O3, surface concentrationsmeasured in Lin’an, a background station ineastern China, showed that the monthly highest 5%O3 concentrations increased over 1991–2006(Xu et al., 2008).
Estimating of the climatic effect of troposphericO3 requires knowledge of not only surface concentrationsbut also vertical distributions and column burdens.Ozonesonde datasets were available at only anumber of sites in China. Based on 810 vertical profilesof O3 measured by aircraft in different seasons of1995–2005,Ding et al.(2008)showed that the averagemixing ratio of O3 in Beijing increased from about40 ppbv at the ground to about 50 ppbv at 2-km altitude.Satellite measurements are useful for analysesof the distributions and seasonal variations of troposphericcolumn O3 concentration over China becauseof the excellent spatial and temporal coverage. Liu etal.(2006)presented the first directly retrieved globaldistribution of tropospheric column O3 from GlobalOzone Monitoring Experiment(GOME)ultravioletmeasurements from December 1996 to November 1997.The retrieved columns clearly showed changes owingto convection, biomass burning, stratospheric influence, pollution, and transport. By using measurementsfrom the Infrared Atmospheric Sounding Interferometer(IASI)instrument aboard the EuropeanMetop-A satellite(launched in October 2006), Dufouret al.(2010)showed that the maximum O3 occursin late spring and early summer(May–June)in Beijing.Wang Y. et al.(2011)examined the month tomonth variation of mean tropospheric O3 column fromTropospheric Emission Spectrometer(TES)for eastern(east of 110◦E) and western(west of 110◦E)China.TES retrievals suggest that column burden of troposphericozone over both eastern and western Chinahas a maximum in late spring/early summer and minimumin winter. Although biogenic emissions, temperature, and radiation are the highest in southeastern and southwestern China in July, O3 concentrations inthose regions are generally low in summer because ofthe summer monsoon circulation that brings clean airfrom the oceans. Zhang et al.(2014)reported thatthe retrieved tropospheric O3 column concentrationfrom OMI averaged over China and from 2010–2013was 34.0 DU.
3.3 Radiative forcing of tropospheric O3Tropospheric O3 exerts radiative forcing at bothlongwave and shortwave spectral b and s. Few studieshave examined the RF by tropospheric O3 over China.By using a coupled regional chemistry-climate model(RegCM2),Wang et al.(2005)showed that troposphericO3 had a shortwave forcing of 0.19 W m−2 and a longwave forcing of 0.46 W m−2 at the tropopause.They reported that the normalized net radiative forcingover China was 0.02 W m−2 DU−1, lower thanthe global mean values of 0.03–0.05 W m−2 DU−1reported in the literature. By using the IPCC AR5emissions inventories,Chang et al.(2009)reportedthat the anthropogenic radiative forcing by troposphericO3 averaged over eastern China(18◦–45◦N,95◦–125◦E)was 0.53 W m−2 at the tropopause.
3.4 Simulated climatic effect of troposphericO3Several studies examined climate responses to RFof tropospheric O3 in China. Wang et al.(2004)useda coupled regional chemistry-climate model based onRegCM2 to simulate the concentrations and climaticeffect of tropospheric O3 in China. They reported thatthe monthly mean column burden of O3 was about30 DU and led to changes in surface air temperatureby –0.8 to 0.8 K over eastern China. The negativechanges in temperature were mainly associated withthe feedback of clouds. Based on the transient climatesimulations of the GISS ModelE,Hansen et al.(2007)predicted that the increases in surface air temperatureby tropospheric O3 were up to 0.5 K overeastern China from 1900 to 2003. On the basis of aglobal coupled chemistry-climate simulation, Chang etal.(2009)reported that the warming by troposphericO3 was 0.43 K in eastern China over 1950–2000.
The large changes in simulated surface air temperaturereviewed above underscore the importance ofconsidering O3 in policies for mitigating global warming.It should be noted that many previous studies onregional climate changes in China did not account forthe role of tropospheric O3, which would lead to lowbiases in simulated warming in China.
4. Mitigation of climate warming by reductionsin black carbon and O3 in ChinaDue to the warming effect of BC and troposphericO3 as reviewed above, reductions in short-lived BC and tropospheric O3 have been proposed as a complementarystrategy to reductions in greenhouse gases.Recent studies started to identify approaches to mitigateboth air pollution and global warming by reducingconcentrations of short-lived species such as troposphericO3 and BC(UNEP,2011; Shindell et al., 2012;Bond et al., 2013; Liao and Chang, 2014; Zhang et al., 2014). BC and OC are always co-emitted, but in differentproportions from different emission sources. BCis also co-emitted with other scattering aerosols suchas sulfate from fossil fuel burning. As a result, theeffect of BC mitigation depends on how BC and coemittedaerosol species affect cloud properties(cloudalbedo, cloud amount, and cloud lifetime) and hencecloud radiative forcing. If such a perturbation wereto result in a reduction in TOA cloud cooling, theamount of BC reduction would oppose the amount bywhich the TOA direct BC heating is also reduced. Forexample,Chen et al.(2010)considered two presentdaymitigation scenarios: 50% reduction of primaryBC/OC mass and number emissions from fossil fuelcombustion(referred to as HF), and 50% reductionof primary BC/OC mass and number emissions fromall primary carbonaceous sources(fossil fuel, domesticbiofuel, and biomass burning)(referred to as HC). Theglobal mean TOA changes in radiative forcing for thetwo scenarios, relative to present day, were calculatedto be 0.13±0.33 W m−2(HF) and 0.31±0.33 W m−2(HC), indicating the large uncertainty in the net effectof some BC control measures on global warming.
Few studies have examined the effect of reductionsin O3 on global warming. As a short-lived specieswith lifetime of about 3 weeks(Liao and Seinfeld, 2005; Stevenson et al., 2006), a large fraction of O3in China can be attributed to background O3 and anthropogenicemissions from foreign countries. Wang Y. et al.(2011)used the global chemical transportmodel GEOS-Chem to identify contributions of emissionsfrom various source types(natural and anthropogenic) and regions(domestic and foreign)to the spatialdistribution and seasonality of tropospheric O3 inChina. Assuming that total O3 is the sum of totalbackground O3(TBO; simulated with global naturalemissions as well as anthropogenic emissions outsideChina) and China pollution O3(CPO; O3 formationfrom anthropogenic emissions in China), the annualmean TBO over China was calculated to be 44.1 ppbv, with maximum value of 50.7 ppbv in MAM and minimumvalue of 40.9 ppbv in JJA, accounting for 93% and 81% of total surface O3 in these seasons, respectively.Annual mean CPO was calculated to be 5.4ppbv, ranging from 1.4 ppbv in DJF to 9.9 ppbv inJJA. Average over China, CPO contributed about 20%of total O3 in JJA. These model results indicate thatdomestic reductions in O3 through controlling O3 preNO.4 LIAO Hong and SHANG Jingjing 539cursors(such as NOx, CO, and NMVOCs)may not behelpful for regional climate; it is important to establishemission control collaboration to achieve mutualbenefits among different countries/regions.
Noted that while BC and O3 affect the regionalclimate, climate change can affect their distributions and concentrations by altering natural emissions, chemical reactions, transport, and deposition(Liao et al., 2006; Jiang H. et al., 2013; Qu et al., 2013; Wang et al., 2013). Such chemistry-aerosol-climate feedbacksneed to be accounted for in policies for future emissionreductions.
5. Science needs for reductions of short-livedgreenhouse speciesAs presented in sections above, important advanceshave been made during the past decade inunderst and ing concentrations and distributions of BC and tropospheric O3 and their roles in climate changein China. Emissions inventories of tropospheric O3 and aerosol precursors as well as aerosols have becomeavailable for China domain, which allow one tosimulate concentrations of BC and tropospheric O3 and estimate their climatic effects by using numericalmodels. Increasing availability of ground-based measurements and satellite measurements of short-livedspecies and their optical properties as well as cloudproperties has provided datasets to constrain the simulatedclimatic effects of aerosols and tropospheric O3.However, estimates of the net effect of BC and O3control measures on global warming are still subjectto large uncertainties. The fundamental science needspertaining to reductions in short-lived species to mitigateglobal warming are summarized in Fig. 7 and described below.

|
| Fig. 7 Fundamental science needs pertaining to reductions in short-lived species to mitigate global warming. |
(1)Quantification of emissions of BC and O3precursors from different sectors in China, which arerequired for making plans of control measures. It isalso important to quantify all the chemical species thatare co-emitted with BC or O3 precursors can influenceconcentrations of both long-lived greenhouse gases and short-lived species. Such information will be helpfulfor estimating the net radiative forcing of a specificBC or O3 control measure.
(2)Nationwide long-term measurements of size-resolved mass concentrations of BC and other aerosolspecies as well as number concentrations of aerosols.Since previous measurements(measurements at urbansites for short time periods)were mostly designedfor air quality studies, nationwide long-term measurementsare especially important for climate studies and need coordinated funding support. With fairly goodfunding support, satellite measurements have excellentspatial and temporal coverage, which are also usefulfor analyses of the physical/chemical/optical characteristicsof O3 and aerosols. These measurements arenecessary for evaluation of emission inventories, developmentof chemistry-aerosol-climate models, and theassessment of the effect of emission reduction measures(Wang et al., 2012; Xu et al., 2013). Better underst and ingof BC and tropospheric O3 also requiressatellite measurements of fires. One of the largest uncertaintieswith the fire observations is in estimatingthe actual amount of BC and O3 precursors such asNOx that are emitted.
(3)Improving the underst and ing of aerosol-cloudinteractions. How chemical species co-emitted withBC influence clouds is one of the most difficult challenges, because the microphysical processes involvedare very complex. Although the direct radiative effectof BC has been shown to be a strong warming, thesemi-direct and indirect effects of BC have large uncertaintieseither with sign and magnitude. Consideringthat aerosol-cloud interactions have the largest uncertaintiesamong the drivers of climate change(IPCC,2013), quantification of aerosol-cloud interactions iscritical for assessing the benefits of emission controlmeasures.
(4)Continuous development of fully coupledchemistry-aerosol-climate models. As reported byIPCC(2013), a large fraction of climate models cansimulate chemistry and transport of tropospheric O3 and aerosols, but few of them have fully coupledmeteorology-aerosol-cloud-radiative forcing feedbacks, especially with the consideration of all major anthropogenic and natural aerosol species and the radiativeeffects of aerosols on distributions and concentrationsof chemical species.
(5)Through atmospheric transport, pollutantscan be carried from one location to another. Therefore, how different countries/regions are accountablefor the emissions and how they can establish emissioncontrol collaboration to achieve mutual benefits arevery important questions. These issues are relativelyless studied in current literature and remain an importantbottleneck affecting the effectiveness of emissioncontrol.
| Andreae, M. O., O. Schmid, H. Yang, et al., 2008: Optical properties and chemical composition of the atmo-spheric aerosol in urban Guangzhou, China. Atmos. Environ., 42, 6335-6350. |
| Bergin, M. H., G. R. Cass, J. Xu, et al., 2001: Aerosol ra-diative, physical, and chemical properties in Beijing during June 1999. J. Geophys. Res., 106, 17969-17980. |
| Bond, T. C., S. J. Doherty, D. W. Fahey, et al., 2013: Bounding the role of black carbon in the climate system: A scientific assessment. J. Geophys. Res., 118, 5380-5552. |
| Cao, G. L., X. Y. Zhang, and F. C. Zheng, 2006: Inven-tory of black carbon and organic carbon emissions from China. Atmos. Environ., 40, 6516-6527. |
| Cao, J. J., S. C. Lee, J. C. Chow, et al., 2007: Spatial and seasonal distributions of carbonaceous aerosols over China. J. Geophys. Res., 112, D22s11, doi: 10.1029/2006JD008205. |
| Cao, J. J., Z. X. Shen, J. C. Chow, et al., 2009: Sea-sonal variations and sources of mass and chemical composition for PM10 aerosol in Hangzhou, China. Particuology, 7, 161-168. |
| Cao, C. X., S. Zheng, and R. P. Singh, 2014: Charac-teristics of aerosol optical properties and meteoro-logical parameters during three major dust events (2005-2010) over Beijing, China. Atmos. Res., 150, 129-142. |
| Carmichael, G. R., M. Ferm, N. Thongboonchoo, et al., 2003: Measurements of sulfur dioxide, ozone and ammonia concentrations in Asia, Africa, and South America using passive samplers. Atmos. Environ., 37, 1293-1308. |
| Chang Wenyuan, Liao Hong, and Wang Huijun, 2009: Climate responses to direct radiative forcing of an-thropogenic aerosols, tropospheric ozone, and long-lived greenhouse gases in eastern China over 1951-2000. Adv. Atmos. Sci., 26, 748-762. |
| Chen, W.-T., Y. H. Lee, P. J. Adams, et al., 2010: Will black carbon mitigation dampen aerosol indirect forcing? Geophys. Res. Lett., 37, L09801, doi: 10.1029/2010GL042886. |
| Cheng, Y. F., A. Wiedensohler, H. Eichler, et al., 2008: Aerosol optical properties and related chemical apportionment at Xinken in Pearl River Delta of China. Atmos. Environ., 42, 6351-6372. |
| Chung, S. H., and J. H. Seinfeld, 2005: Climate re-sponse of direct radiative forcing of anthropogenic black carbon. J. Geophys. Res., 110, doi: 10.1029/2004JD005441. |
| Cong, Z. Y., S. C. Kang, S. P. Gao, et al., 2013: Histor-ical trends of atmospheric black carbon on Tibetan Plateau as reconstructed from a 150-yr lake sediment record. Environ. Sci. Technol., 47, 2579-2586. |
| Cui Zhenlei, Zhang Hua, and Yin Yan, 2009: A modeling study with MATCH on the aerosol optical depth distribution over China in 2006. Remote Sensing Technology and Application, 24, 197-203. (in Chi-nese) |
| Ding, A. J., T. Wang, V. Thouret, et al., 2008: Tropo-spheric ozone climatology over Beijing: Analysis of aircraft data from the MOZAIC program. Atmos. Chem. Phy., 8, 1-13. |
| Dufour, G., M. Eremenko, J. Orphal, et al., 2010: IASI observations of seasonal and day-to-day variations of tropospheric ozone over three highly populated areas of China: Beijing, Shanghai, and Hong Kong. Atmos. Chem. Phy., 10, 3787-3801. |
| Fan Xuehua, Cheng Hongbin, Xia Xiangao, et al., 2010: Aerosol optical properties from the atmospheric radiation measurement mobile facility at Shoux-ian, China. J. Geophys. Res., 115, D00K33, doi: 10.1029/2010JD014650. |
| Gao Runxiang, Niu Shengjie, Zhang Hua, et al., 2008: An observational study of black carbon aerosol in Northwest China in the spring of 2006. J. Nanjing Inst. Meteor., 31, 655-661. (in Chinese) |
| Garland, R. M., O. Schmid, A. Nowak, et al., 2009: Aerosol optical properties observed during Cam-paign of Air Quality Research in Beijing 2006 (CAREBeijing-2006): Characteristic differences be-tween the inflow and outflow of Beijing city air. J. Geophys. Res., 114, D00G04, doi: 10.1029/ 2008JD010780. |
| Guo, L., E. J. Highwood, L. C. Shaffrey, et al., 2013: The effect of regional changes in anthropogenic aerosols on rainfall of the East Asian summer monsoon. At-mos. Chem. Phy., 13, 1521-1534. |
| Han, Y. M., J. J. Cao, B. Z. Yan, et al., 2011: Compari-son of elemental carbon in lake sediments measured by three different methods and 150-yr pollution his-tory in eastern China. Environ. Sci. Technol., 45, 5287-5293. |
| Hansen, J., M. Sato, R. Ruedy, et al., 2007: Climate sim-ulations for 1880-2003 with GISS modelE. Climate Dyn., 29, 661-696. |
| He, X., C. C. Li, A. K. H. Lau, et al., 2009: An intensive study of aerosol optical properties in Beijing urban area. Atmos. Chem. Phy., 9, 8903-8915. |
| IPCC, 2013: Summary for Policymakers. Climate change 2013: The Physical Science Basis. Contribution of Working Group I to the Fifth Assessment Report of the Intergovernmental Panel on Climate Change, Stocker, T. F., D. Qin, G.-K. Plattner, et al., Eds., Cambridge University Press, Cambridge, United Kingdom and New York, NY, USA, 2216 pp. |
| Jacobson, M. Z., 2004: Climate response of fossil fuel and biofuel soot, accounting for soot's feedback to snow and sea ice albedo and emissivity. J. Geophys. Res., 109, D21201, doi: 10.1029/2004JD004945. |
| Jacobson, M. Z., 2005: Correction to control of fossil-fuel particulate black carbon and organic matter, possibly the most effective method of slowing global warming. J. Geophys. Res., 110, D14105, doi: 10.1029/2005JD005888. |
| Jiang, H., H. Liao, H. O. T. Pye, et al., 2013: Pro-jected effect of 2000-2050 changes in climate and emissions on aerosol levels in China and associated transboundary transport. Atmos. Chem. Phy., 13, 7937-7960. |
| Janssens, I. A., W. Dieleman, S. Luyssaert, et al., 2010: Reduction of forest soil respiration in response to nitrogen deposition. Nature Geoscience, 3, 315-322. |
| Jiang Yiquan, Liu Xiaohong, Yang Xiuqun, et al., 2013: A numerical study of the effect of different aerosol types on East Asian summer clouds and precipita-tion. Atmos. Environ., 70, 51-63. |
| Kaufman, Y. J., B. N. Holben, D. Tanré, et al., 2000: Will aerosol measurements from Terra and Aqua polar orbiting satellites represent the daily aerosol abundance and properties? Geophys. Res. Lett., 27, 3861-3864. |
| Kim, D.-H., B.-J. Sohn, T. Nakajima, et al., 2004: Aerosol optical properties over East Asia deter-mined from ground-based sky radiation measure-ments. J. Geophys. Res., 109, D02209, doi: 10.1029/2003JD003387. |
| Koch, D., M. Schulz, S. Kinne, et al., 2009: Evaluation of black carbon estimations in global aerosol models. Atmos. Chem. Phy., 9, 9001-9026. |
| Kopacz, M., D. L. Mauzerall, J. Wang, et al., 2011: Ori-gin and radiative forcing of black carbon transported to the Himalayas and Tibetan Plateau. Atmos. Chem. Phy., 11, 2837-2852, doi: 10.5194/acp-11-2837-2011. |
| Lamarque, J.-F., J. T. Kiehl, G. P. Brasseur, et al., 2005: Assessing future nitrogen deposition and carbon cycle feedback using a multimodel approach: Anal-ysis of nitrogen deposition. J. Geophys. Res., 110, D19303, doi: 10.1029/2005JD005825. |
| Lee, K. H., Z. Q. Li, M. S. Wong, et al., 2007: Aerosol single scattering albedo estimated across China from a combination of ground and satellite mea-surements. J. Geophys. Res., 112, D22S15, doi: 10.1029/2007JD009077. |
| Li, C., L. T. Marufu, R. R. Dickerson, et al., 2007: In situ measurements of trace gases and aerosol optical properties at a rural site in northern China during East Asian study of tropospheric aerosols: An in-ternational regional experiment 2005. J. Geophys. Res., 112, D22S04, doi: 10.1029/2006JD007592. |
| Li Xingsheng, He Zhuanshi, Fang Xiumei, et al., 1999: Distribution of surface ozone concentration in the clean areas of China and its possible impact on crop yields. Adv. Atmos. Sci., 16, 154-158. |
| Li, Z. Q., H. Chen, M. Cribb, et al., 2007: Preface to special section on East Asian studies of tro-pospheric aerosols: An international regional ex-periment (EAST-AIRE). J. Geophys. Res., 112, D22S04, doi: 10.1029/2006JD007592. |
| Liao, H., and J. H. Seinfeld, 2005: Global impacts of gas-phase chemistry-aerosol interactions on di-rect radiative forcing by anthropogenic aerosols and ozone. J. Geophys. Res., 110, D18208, doi: 10.1029/2005JD005907. |
| Liao, H., W.-T. Chen, and J. H. Seinfeld, 2006: Role of climate change in global predictions of future tropo-spheric ozone and aerosols. J. Geophys. Res., 111, D12304, doi: 10.1029/2005jd006852. |
| Liao Hong and Chang Wenyuan, 2014: Integrated assess-ment of air quality and climate change for policy-making: Highlights of IPCC AR5 and research chal-lenges. National Science Review, 1, 176-179, doi: 10.1093/nsr/nwu005. |
| Lin, W., X. Xu, X. Zhang, et al., 2008: Contributions of pullutants from North China Plain to surface ozone at the Shangdianzi GAW Station. Atmos. Chem. Phy., 8, 5889-5898. |
| Liu, X., K. Chang, C. E. Sioris, et al., 2006: First directly retrieved global distribution of tropospheric column ozone from GOME: Comparison with the GEOS-CHEM model. J. Geophys. Res., 111, D02308, doi: 10.1029/2005JD006564. |
| Liu Jianjun, Zheng Youfei, Li Zhanqing, et al., 2008: Ground-based remote sensing of aerosol optical properties in one city in Northwest China. Atmos. Res., 89, 194-205. |
| Lou Sijia, Liao Hong, and Zhu Bin, 2014: Impacts of aerosols on surface-layer ozone concentrations in China through heterogeneous reactions and changes in photolysis rates. Atmos. Environ., 85, 123-138. |
| Lu, Z., Q. Zhang, and D. G. Streets, 2011: Sulfur diox-ide and primary carbonaceous aerosol emissions in China and India, 1996-2010. Atmos. Chem. Phy., 11, 9839-9864. |
| Lyapustin, A., A. Smirnov, B. Holben, et al., 2011: Re-duction of aerosol absorption in Beijing since 2007 from MODIS and AERONET. Geophys. Res. Lett., 38, L10803, doi: 10.1029/2011GL047306. |
| Ma Jinghui, Zheng Youfei, and Zhang Hua, 2007: The optical depth global distribution of black carbon aerosol and its possible reason analysis. Scientia Meteor. Sinica, 27, 549-556. (in Chinese) |
| Ma, N., C. S. Zhao, A. Nowak, et al., 2011: Aerosol optical properties in the North China Plain during HaChi campaign: An in-situ optical closure study. Atmos. Chem. Phy., 11, 5959-5973. |
| Meng, Z. Y., X. B. Xu, P. Yan, et al., 2009: Character-istics of trace gaseous pollutants at a regional back-ground station in northern China. Atmos. Chem. Phy., 9, 927-936. |
| Menon, S., J. Hansen, L. Nazarenko, et al., 2002: Climate effects of black carbon aerosols in China and India. Science, 297, 2250-2253. |
| Menon, S., D. Koch, G. Beig, et al., 2010: Black car-bon aerosols and the third polar ice cap. Atmos. Chem. Phy., 10, 4559-4571, doi: 10.5194/acp-10-4559-2010. |
| Ming, J., H. Cachier, C. Xiao, et al., 2008: Black carbon record based on a shallow Himalayan ice core and its climatic implications. Atmos. Chem. Phy., 8, 1343-1352. |
| Müller, D., M. Tesche, H. Eichler, et al., 2006: Strong particle light absorption over the Pearl River Delta (South China) and Beijing (North China) deter-mined from combined Raman lidar and Sun pho-tometer observations. Geophys. Res. Lett., 33, L20811, doi: 10.1029/2006GL027196. |
| Prather, M. J., C. D. Holmes, and J. Hsu, 2012: Re-active greenhouse gas scenarios: Systematic explo-ration of uncertainties and the role of atmospheric chemistry. Geophys. Res. Lett., 39, L09803, doi: 10.1029/2012GL051440. |
| Qin, Y., and S. D. Xie, 2011: Estimation of county-level black carbon emissions and its spatial distribution in China in 2000. Atmos. Environ., 45, 6995-7004. |
| Qin, Y., and S. D. Xie, 2012: Spatial and temporal vari-ation of anthropogenic black carbon emissions in China for the period 1980-2009. Atmos. Chem. Phy., 12, 4825-4841. |
| Qiu Jinhuan, Yang Liquan, and Zhang Xiaoye, 2004: Characteristics of the imaginary part and single-scattering albedo of urban aerosols in northern China. Tellus B, 56, 276-284. |
| Qiu Jinhuan and Yang Jingmei, 2008: Absorption prop-erties of urban/suburban aerosols in China. Adv. Atmos. Sci., 25, 1-10. |
| Qu Wenjun, Zhang Xiaoye, Wang Yaqiang, et al., 2006: The physical and chemical characterization of car-bonaceous aerosol at the atmospheric background site in Diqing, Yunnan. China Environ. Sci., 26, 266-270. (in Chinese) |
| Qu Wenjun, Wang Jun, Gao Shanhong, et al., 2013: Effect of the strengthened western Pacific subtropi-cal high on summer visibility decrease over eastern China since 1973. J. Geophys. Res., 118, 7142-7156, doi: 10.1002/jgrd.50535. |
| Ramanathan, V., P. J. Crutzen, J. T. Kiehl, et al., 2001: Aerosols, climate, and the hydrological cycle. Sci-ence, 294, 2119-2124. |
| Shindell, D., J. C. I. Kuylenstierna, E. Vignati, et al., 2012: Simultaneously mitigating near-term climate change and improving human health and food secu-rity. Science, 335, 183-189. |
| Stevenson, D. S., F. J. Dentener, M. G. Schultz, et al., 2006: Multimodel ensemble simulations of present-day and near-future tropospheric ozone. J. Geophys. Res., 111, D08301, doi: 10.1029/2005JD006338. |
| Takami, A., W. Wang, D. G. Tang, et al., 2006: Measure-ments of gas and aerosol for two weeks in northern China during the winter-spring period of 2000, 2001, and 2002. Atmos. Res., 82, 688-697. |
| Tang, G., X. Li, Y. Wang, et al., 2009: Surface ozone trend details and interpretations in Beijing, 2001-2006. Atmos. Chem. Phy., 9, 8813-8823. |
| Tu Jun, Xia Zongguo, Wang Hesheng, et al., 2007: Tem-poral variations in surface ozone and its precursors and meteorological effects at an urban site in China. Atmos. Res., 85, 310-337. |
| UNEP, 2011: Integrated Assessment of Black Carbon and Tropospheric Ozone: Summary for Decision Mak-ers. Nairobi, UNON, Publishing Services Section, 36 pp. |
| Wang Rong, Tao Shu, Wang Wentao, et al., 2012: Black carbon emissions in China from 1949 to 2050. Env-iron. Sci. Technol., 46, 7595-7603. |
| Wang, T., H. L. A. Wong, J. Tang, et al., 2006: On the origin of surface ozone and reactive ni-trogen observed at a remote mountain site in the northeastern Qinghai-Tibetan Plateau, west-ern China. J. Geophys. Res., 111, D08303, doi: 10.1029/2005JD006527. |
| Wang Tijian, Xie Min, Gao Lijie, et al., 2004: Devel-opment and preliminary application of a coupled regional climate-chemistry model system. J. Nan-jing Univ. (Nat. Sci.), 40, 711-727. (in Chinese) |
| Wang Weiguo, Wu Jian, Liu Hongnian, et al., 2005: Researches on the influence of pollution emission on tropospheric ozone variation and radiation over China and its adjacent area. Chinese J. Atmos. Sci., 29, 734-746. (in Chinese) |
| Wang Xin, Xu Baiqing, and Ming Jing, 2014: An overview of the studies on black carbon and mineral dust deposition in snow and ice cores in East Asia. J. Meteor. Res., 28, 354-370, doi: 10.1007/s13351-014-4005-7. |
| Wang, Y., Y. Zhang, J. Hao, et al., 2011: Seasonal and spatial variability of surface ozone over China: Con-tributions from background and domestic pollution. Atmos. Chem. Phy., 11, 3511-3525. |
| Wang Yuxuan, Shen Lulu, Wu Shiliang, et al., 2013: Sensitivity of surface ozone over China to 2000-2050 global changes of climate and emissions. At-mos. Environ., 75, 374-382, doi: 10.1016/j.at-mosenv.2013.04.045. |
| Wang Yuesi, Xin Jinyuan, Pan Yuepeng, et al., 2014: The Campaign on atmospheric Aerosol REsearch network of China: CARE-China. Bull. Amer. Me-teor. Soc., doi: 10.1175/BAMS-D-14-00039.1. |
| Wang Zhili, Guo Pinwen, and Zhang Hua, 2009: A nu-merical study of direct radiative forcing due to black carbon and its effects on the summer precipitation in China. Climatic Environ. Res., 14, 161-171. (in Chinese) |
| Wang Zhili, Zhang Hua, and Shen Xueshun, 2011: Ra-diative forcing and climate response due to black carbon in snow and ice. Adv. Atmos. Sci., 28, 1336-1344, doi: 10.1007/s00376-011-0117-5. Wendisch, M., O. Hellmuth, A. Ansmann, et al., 2008: |
| Wild, O., and H. Akimoto, 2001: Radiative and dynamic effects of absorbing aerosol particles over the Pearl River Delta, China. Atmos. Environ., 42, 6405-6416. |
| Wild, O., and H. Akimoto, 2001: Intercontinental transport of ozone and its precursors in a three-dimensional global CTM. J. Geophys. Res., 106, 27729-27744. |
| Wu, J., C. Fu, Y. Xu, et al., 2008: Simulation of direct effects of black carbon aerosol on temperature and hydrological cycle in Asia by a Regional Climate Model. Meteor. Atmos. Phys., 100, 179-193. |
| Xia Xiang'ao, Chen Hongbin, Wang Pucai, et al., 2005: Aerosol properties and their spatial and temporal variations over North China in spring 2001. Tellus B, 57, 28-39. |
| Xia, X. A., H. B. Chen, P. C. Wang, et al., 2006: Varia-tion of column-integrated aerosol properties in a Chi-nese urban region. J. Geophys. Res., 111, D05204, doi: 10.1029/2005JD006203. |
| Xu, B. Q., J. J. Cao, J. Hansen, et al., 2009: Black soot and the survival of Tibetan glaciers. Proc. Nat. Acad. Sci. USA, 106, 22114-22118. |
| Xu, J., M. H. Bergin, X. Yu, et al., 2002: Measurement of aerosol chemical, physical and radiative proper-ties in the Yangtze Delta region of China. Atmos. Environ., 36, 161-173. |
| Xu Jin, M. H. Bergin, R. Greenwald, et al., 2004: Aerosol chemical, physical, and radiative characteristics near a desert source region of Northwest China during ACE-Asia. J. Geophys. Res., 109, D19S03, doi: 10.1029/2003JD004239. |
| Xu, J., J. Z. Ma, X. L. Zhang, et al., 2011: Measurements of ozone and its precursors in Beijing during sum-mertime: Impact of urban plumes on ozone pollution in downwind rural areas. Atmos. Chem. Phy., 11, 12241-12252. |
| Xu, X., W. Lin, T. Wang, et al., 2008: Long-term trend of surface ozone at a regional background station in eastern China during 1991-2006: Enhanced vari-ability. Atmos. Chem. Phy., 8, 2595-2607. |
| Xu Xiaoguang, Wang Jun, D. K. Henze, et al., 2013: Constraints on aerosol sources using GEOS-Chem adjoint and MODIS radiances, and evaluation with multisensor (OMI, MISR) data. J. Geophys. Res., 118, 6396-6413, doi: 10.1002/jgrd.50515. |
| Yan Peng, Li Xingsheng, Luo Chao, et al., 1997: Ob-servational analysis of surface O3, NOx, and SO2 in China. J. Appl. Meteor. Sci., 8, 53-61. (in Chinese) |
| Yan Peng, Wang Mulin, Cheng Hongbing, et al., 2003: Distributions and variations of surface ozone in Changshu, Yangtze Delta region. Acta Metallur-gica Sinica, 17, 205-217. |
| Yan, P., J. Tang, J. Huang, et al., 2008: The measure-ment of aerosol optical properties at a rural site in northern China. Atmos. Chem. Phy., 8, 2229-2242. |
| Yu Xingna, Zhu Bin, and Zhang Meigen, 2009: Seasonal variability of aerosol optical properties over Beijing. Atmos. Environ., 43, 4095-4101. |
| Zhang Hua, Ma Jinghui, and Zheng Youfei, 2008: The study of global radiative forcing due to black carbon aerosol. Chinese J. Atmos. Sci., 32, 1147-1158. (in Chinese) |
| Zhang Hua, Wang Zhili, Guo Pinwen, et al., 2009: A modeling study of the effects of direct radiative forc-ing due to carbonaceous aerosol on the climate in East Asia. Adv. Atmos. Sci., 26, 57-66. |
| Zhang Hua, Wang Zhili, Wang Zaizhi, et al., 2012: Simu-lation of direct radiative forcing of aerosols and their effects on East Asian climate using an interactive AGCM-aerosol coupled system. Climate Dyn., 38, 1675-1693, doi: 10.1007/s00382-011-1131-0. |
| Zhang Hua, Xie Bing, Zhao Shuyun, et al., 2014: PM2. 5 and tropospheric O3 in China and an analysis of the impact of pollutant emission control. Adv. Climate Change Res., 5, 136-141. |
| Zhang Li, Liao Hong, and Li Jianping, 2010a: Im-pacts of Asian summer monsoon on seasonal and interannual variations of aerosols over east-ern China. J. Geophys. Res., 115, D00K05, doi: 10.1029/2009JD012299. |
| Zhang, L., H. Liao, and J. Li, 2010b: Impact of the Southeast Asian summer monsoon strength on the outflow of aerosols from South Asia. Annales Geo-physicae, 28, 277-287. |
| Zhang, Q., D. G. Streets, G. R. Carmichael, et al., 2009: Asian emissions in 2006 for the NASA INTEX-B mission. Atmos. Chem. Phy., 9, 5131-5153. |
| Zhang, X. Y., Y. Q. Wang, D. Wang, et al., 2005: Characterization and sources of regional-scale trans-ported carbonaceous and dust aerosols from dif-ferent pathways in coastal and sandy land areas of China. J. Geophys. Res., 110, D15301, doi: 10.1029/2004JD005457. |
| Zhang, X. Y., Y. Q. Wang, X. C. Zhang, et al., 2008b: Carbonaceous aerosol composition over various re-gions of China during 2006. J. Geophys. Res., 113, D14111, doi: 10.1029/2007JD009525. |
| Zhuang Bingliang, Wang Tijian, and Li Shu, 2009: The first indirect radiative forcing of black carbon aerosol and its effect on regional climate of China. Plateau Meteor., 28, 1095-1104. (in Chinese) |
| Zhuang, B. L., L. Liu, F. H. Shen, et al., 2010a: Semidi-rect radiative forcing of internal mixed black car-bon cloud droplet and its regional climatic effect over China. J. Geophys. Res., 115, D00K19, doi: 10.1029/2009JD013165. |
| Zhuang Bingliang, Jiang Fei, Wang Tijian, et al., 2010b: Investigation on the direct radiative effect of fossil fuel black-carbon aerosol over China. Theor. Appl. Climatol., 104, 301-312. |
| Zhuang Bingliang, Liu Qian, Wang Tijian, et al., 2013: Investigation on semi-direct and indirect climate ef-fects of fossil fuel black carbon aerosol over China. Theor. Appl. Climatol., 114, 651-672. |
| Zhuang, B. L., T. J. Wang, S. Li, et al., 2014: Optical properties and radiative forcing of urban aerosols in Nanjing, China. Atmos. Environ., 83, 43-52. |