 2015, Vol. 28
The Chinese Meteorological Society
Article Information
- WANG Fei, ZHANG Yijun, ZHENG Dong, XU Liangtao. 2015.
- Impact of the Vertical Velocity Field on Charging Processes and Charge Separation in a Simulated Thunderstorm
- J. Meteor. Res., 28(2): 328-343
- http://dx.doi.org/10.1007/s13351-015-4023-0
Article History
- Received July 17, 2014;
- in final form October 16, 2014


2 Laboratory of Lightning Physics and Protection Engineering, Chinese Academy of Meteorological Sciences, Beijing 100081
Updraft, especially strong updraft, in a thunderstormis a key factor causing lightning activity. Updraftis conducive to the development of graupel and ice crystals. It also increases the collision probability, and then strengthens the non-inductive charging processesbetween these two kinds of particles. Based ontheoretical analysis, Boccippio(2002) proposed thatthe power of the electrical generator in thunderstormsis linearly related to lightning activity(current) and also to the product of current density of the electricalgenerator and thunderstorm size.
Many observations have confirmed the connectionbetween updraft and lightning activity. Someresearchers believed that the strong updraft existingin the mixed phase zone(–40 to 0℃)is important forthe production of lightning(Workman and Reynolds, 1949; Williams and Lhermitte, 1983; Dye et al., 1989;Rutledge et al., 1992; Carey and Rutledge, 1996; Petersen et al., 1996, 1999; Wang et al., 2009; Heymsfield et al., 2010; Zheng et al., 2010; Palucki et al., 2011;Reinhart et al., 2014). Zipser(1994)hypothesized thatweak updrafts in most oceanic storms produce insufficientconcentrations of supercooled liquid water, largeice particles, and ice-ice collisions in the mixed phase zone, which are otherwise essential for the electrificationprocess leading to lightning. Indeed, based ondual polarization radar data, research subsequently indicatedthat only after the mixed region of graupel and ice crystals is formed under sufficiently strong updraftconditions is lightning initiated(Bringi et al., 1997; Carey et al., 2003). Furthermore, analysis combiningthe wind field derived from radar data withlightning data has suggested a strong correlation betweenradar-inferred graupel volume suspended in avigorous updraft in the upper portions of the storm and the in-cloud lightning rate(Carey and Rutledge, 1996). Black and Hallett(1999)summarized 20-yrdata from aircraft flying through hurricanes and foundthat lightning activity in a thunderstorm correlateswith strong updraft(> 10 m s−1). Lang and Rutledge(2002)found that thunderstorms dominated bypositive cloud-to-ground lightning flashes always havea large area of strong updraft(> 20 m s−1), producemore supercooled water, and cause more collision and stronger charging processes between ice particles.Tessendorf et al.(2005) and Wiens et al.(2005)alsofound a close correlation between total lightning activity and the volume of strong updrafts(> 10 m s−1).
Deierling and Petersen(2008)analyzed the relationshipbetween total lightning activity and the characteristicsof updraft in a large number of differenttypes of storms. They found that the time series ofupdraft volume in the charging zone(at temperaturecolder than –5℃)with vertical velocities greater thaneither 5 or 10 m s−1 had a clear relationship with totallightning activity(r = 0.93); the correlation coefficientbetween total lightning activity and either the maximumor the mean updraft speed was less than thatfor updraft volume, but was still evident(r=0.8).They also indicated that the relationship between updraftvolume and total lightning activity varied as afunction of temperature and , depending on the temperature, also with region.
Updraft is believed to be a key component ofthe electrical generator of a storm through its drivingof the development of graupel and ice crystals, enhancing the frequency of particle collision at updraftboundaries, and then affecting the charge separation.By comparing the wind field retrieved fromDoppler radar and the location of cloud-to-groundlightning flashes, Liu et al.(2010)found that cloud-togroundlightning flashes usually strike in regions withcyclonic shear or wind shear corresponding to intenseecho, and also that cloud-to-ground lightning flashesoccur more easily in the stage that updraft reachesits maximum and downdraft appears. Furthermore, some researchers have suggested that strong updrafthas a close link with the “lighting ring” or “lightninghole” phenomenon(Krehbiel et al., 2000; Zhang et al., 2004). A recent study shows that strong updraft canaffect the lighting frequency and scale in a thunderstorm(Bruning and MacGorman, 2013).
Due to the limited amount of updraft observations, detailed studies of the relationship between updraft and lightning activity depend upon numericalmodels. For example, Baker et al.(1995, 1999)used a model to reveal that the lightning flash rateis proportional to the fourth power of vertical velocity.Kuhlman et al.(2006)reported close correlationbetween updraft volume and total lightning forat least one simulated severe thunderstorm case. Usinga two dimentional(2D)cumulus model simulation, Yan et al.(1996)indicated that the electrification processin clouds depends on the presence of updraft, and lightning only occurs after the center of updraft passesthrough the –20℃ isotherm. More recently, the simulationresult from a three-dimensional(3D)numericalmodel showed that total lightning flashes usually initiatein regions with weak updraft and low liquid watercontent(Zhou and Guo, 2009). The simulation resultsfrom Zhang et al.(1999, 2003) and Miller et al.(2001)also indicated that updraft speed has a great influenceon discharging processes.
Although a reasonable level of underst and ing regardingthe relationship between updraft and lightningactivity has been established through observations and numerical studies, detailed knowledge on the connectionbetween them is still lacking because direct observationsof updraft and electric field in clouds are difficult and the factors influencing the discharging processare complex. As we know, the premise of the dischargingprocess is a favorable charge structure. The charge structure is the result of charging and charge separationprocesses. Therefore, these processes should bedirectly and closely(but not exclusively)linked withupdraft. Therefore, the aim of the present study isto elucidate the impact of updraft movement on thecharging and charge separation processes. All verticalmovements, including different degrees of updraft and downdraft movements, are taken into account toinvestigate the effect of the charging and charge separationprocesses in different vertical velocity fields.By analyzing these links, lacking in previous studies, we hope to contribute to a more comprehensive underst and ingof the relationship between the dynamics and lightning activity of thunderstorms.2. Model and simulations
The 3D cloud numerical model used in this studywas originally developed by the Chinese Academy ofMeteorological Sciences(CAMS)(Hu and He, 1987) and was subsequently coupled with charging and dischargingprocesses by Tan(2006). The initial field ofthe simulation was obtained from the sounding dataof an isolated thunderstorm in the Cooperative ConvectivePrecipitation Experiment(CCOPE)in China.Tan(2006)used these data for simulation and testedthe simulation results. Through analyzing the revolutionof updraft, cloud top and hydrometeors in thesimulated thunderstorm and comparing with opticalobservations and observations from aircraft throughclouds, the results indicated basic agreement betweenthe simulation and observations. At the same time, comparisons with previous simulations using other2D or 3D models for the same isolated thunderstormshowed a similar result. Therefore, we were confidentthat the 3D cloud model used in our study would besufficiently capable of simulating the CCOPE isolatedthunderstorm.
The horizontal and vertical resolutions of themodel were set to 1 and 0.5 km, respectively. The horizontalsimulation range was a square area of 76 km×76km, and the vertical simulation range was from 0 to 20km. The time step was 1 s and the simulation resultwas output every 1 minute. The simulation lasted for60 min.
Our analysis of the simulation was performed inthe following three cases:(1)only the region wherethe absolute net charge density was greater than 0.001nC m−3 was taken into account in the statistics ofthe total amount of net charges in the thunderstorm;(2)only the region where the absolute charge densityon graupel or ice crystals was higher than 0.001 nCm−3 was taken into account in the statistics of thetotal amount of charges on graupel or ice crystals ofthe whole thunderstorm; and (3)when searching forthe center of net charges and calculating the weightedheight of charges on graupel or ice crystals, the searchor calculation area only included regions with an absolutedensity of net charges on ice particles greaterthan 0.5 nC m−3.
Based on previous observations and theoretical research(Black and Hallett, 1999; Lang and Rutledge, 2002; Tessendorf et al., 2005; Wiens et al., 2005; Deierling and Petersen, 2008), the whole simulation regionwas categorized into six regions with different verticalvelocity ranges, where w is the updraft speed: updraftregion 2(w ≥ 13 m s−1), updraft region 1(13 > w ≥5 m s−1), updraft region(5 > w ≥1 m s−1), quasisteadyregion(1 > w > –1 m s−1), subsidence region(–1 ≥ w >–5 m s−1), and subsidence region 1(w ≤ –5m s−1). These regions were then used for the followinganalysis.3. Simulation results
A total of 126 lightning flashes in the thunderstormwere simulated. The lightning frequency evolution is shown in Fig. 1. The first flash of lightning appearedat the 20th minute of the simulation and thelast was at the 36th minute. The frequency reacheda peak of 16 flashes per minute at both the 23rd and 24th minute. The total charge neutralized by lightningflashes was about 6.9 × 10¹⁰ nC.
 |
| Fig. 1. Simulated lightning frequency. |
The maximum updraft speed in the thunderstormfirst exceeded 10 m s−1 at the 4th minute. The evolutionof the maximum updraft speed shows that theupdraft speed kept increasing until it reached a peak of34.3 m s−1 at the 13th minute(Fig. 2a). Evident netcharges first emerged at the 12th minute. However, the maximum density of either positive or negativecharge never exceeded 0.01 nC m−3, and the centersof net positive and negative charge were all coincidentwith the center of updraft at the time. After that, thenet charge densities kept increasing and the distancesbetween their centers and the center of updraft alsoexp and ed continuously(Figs. 2b and 2c). The maximumvalues of net positive and negative charge densityreached their peak when the maximum updraft speedwas decreasing. The peak time(21st minute)for netnegative charge density was earlier than that for netpositive charge density(24th minute). The horizontaldistances between the net charge centers and theupdraft center kept increasing after their charge densitiesreached their peaks. The distance between the netnegative charge center and the updraft center reacheda maximum of about 8.6 km at the 28th minute, whilethe distance for the net positive charge center reachedits peak of about 9.2 km at the 26th minute. Overall, both the net positive and negative charge centersevolved from near the updraft center to far away fromthe updraft center with the development of the thunderstorm.Most of the time, the net charge centers didnot overlap with the updraft center.
 |
| Fig. 2. Evolution of(a)the maximum updraft speed and the distances between(b)negative and (c)positive net charge centers and the updraft core. |
 |
| Fig. 3. Evolution of positive and negative net charge amount in different vertical velocity ranges.(a)Updraft region 2, (b)updraft region 1, (c)updraft region, (d)quasi-steady region, (e)subsidence region, and (f)subsidence region 1. |
The comparison illustrated in Fig. 3 shows thatthe net charge durations in subsidence region 1 and updraft region 2, emerging before lightning started, were evidently shorter than those in other regions.The longest duration of net charge occurred in thequasi-steady region, the second longest appeared inthe subsidence region, followed by the updraft region, and then updraft region 1. The total net charge in updraftregion 2 reached its peak the earliest, the secondearliest was subsidence region 1, followed by updraftregion 1, updraft region, subsidence region, and finallyquasi-steady region. According to the distribution illustratedin Fig. 4, subsidence region 1, subsidence region, and updraft region were distributed one-by-onealong the vertical direction; while in the horizontal direction, updraft region 2, updraft region 1, updraftregion, and quasi-steady region were distributed concentricallyfrom inside to outside. The peaks of netcharge in these regions appeared consecutively frominside to outside.
 |
| Fig. 4. Profiles of vertical velocity and (a, b)net charge concentration and (c, d)electric field at the(a, c)18th and (b, d)24th minute. |
The vertical profiles of net charge density and electric field in the updraft center at the time light-ning activity commenced(18th minute) and the timeof peak lightning frequency(24th minute)show thatthe main regions of net positive and net negativecharge were located in the region with absolute verticalspeed less than 5 m s−1. Before lightning activitystarted, the main net charge regions were smaller and located on one side of the updraft channel(Fig. 4a).The center of the net positive charge region primarilyappeared in the quasi-steady region and its height wasabout 9.5 km; the center of the net negative charge regionwas primarily located in the updraft region and had a lower height of 8.5 km. At the same time, an evidentelectric field(positive meaning upward and negativemeaning downward)was also formed on the side ofthe updraft channel, where there was an obvious netcharge structure(Fig. 4c). In the updraft channel, the electric field was very small. When the lightningflashes were most frequent, the vertical velocity fieldwith high vertical velocity had disappeared, while theupdraft region, quasi-steady region, and subsidence regionwere dominant(Fig. 4b). The main net chargeregions increased significantly. The density value ofthe charge centers also showed an evident increase.The center of the net positive charge region was stilllocated in the quasi-steady region, but the height ofthe center decreased to about 9 km; the center of thenet negative charge region was in the updraft region and the height of the center fell to 7.5–8.0 km. Simultaneously, corresponding to the distribution of the netcharge regions, there was a large area of evident electricfield(Fig. 4d). The electric field was strengthenedobviously and the maximum electric field exceeded 120kV m−1.3.2 Distribution and evolution of the masses of graupel and ice crystalsThe evolution of the masses of graupel and icecrystals in different vertical velocity ranges illustrates that the duration times of graupel and ice crystals inupdraft region, quasi-steady region, and subsidence regionwere relatively longer than those in updraft region2, updraft region 1, and subsidence region 1(Fig. 5).The time when ice particles emerged in subsidence region1 was later than in updraft region 2. When the iceparticles disappeared in updraft region 2 at the 19thminute, so did the ice particles in subsidence region.The spatial relationship between updraft region 1 and subsidence region 1 illustrated in Fig. 4 shows that subsidence region 1 was situated above updraft region1. Combined with the distribution of graupel and icecrystals depicted in Fig. 6, we speculate that the iceparticles in subsidence region 1 might have been transferredupward by updraft from the updraft regions, orformed by the influence of liquid water arriving fromthe low updraft regions. Therefore, when strong updraftdisappeared, the ice particles in subsidence region1, above the updraft regions, also disappeared.
 |
| Fig. 5. Evolution of the masses of graupel and ice crystals in different vertical velocity ranges.(a)Updraft region 2, (b)updraft region 1, (c)updraft region, (d)quasi-steady region, (e)subsidence region, and (f)subsidence region 1. |
 |
| Fig. 6. Profiles of vertical velocity, graupel concentration, and ice crystal concentration at the(a)18th and (b)24th minute. |
In all vertical velocity ranges, ice crystals formedearlier than graupel(Fig. 5). The rapid increase inice crystal mass emerged earliest in updraft region 2.The ice crystal mass in updraft region 1, updraft region, quasi-steady region, subsidence region, and subsidenceregion 1 then began rapidly increasing in succession.The maximum total mass of ice crystals inquasi-steady region was the largest among all the regions, followed by updraft region, updraft region 1, and subsidence region. The peak time of ice crystalmass in updraft region 2 occurred the earliest, followedby subsidence region 1, updraft region 1, subsidenceregion, and updraft region. The mass of ice crystalsin quasi-steady region kept increasing until the end ofthe lightning activity.
The time at which graupel first emerged wassimilar among the different vertical velocity ranges(around the 11th minute), although for subsidenceregion 1 the time was slightly later. The maximumgraupel mass in quasi-steady region was the largest, followed by updraft region, subsidence region, updraftregion 1, updraft region 2, and subsidence region 1.The first peak of graupel mass emerged in updraft region2, followed by subsidence region 1, updraft region1, updraft region, subsidence region, and quasi-steadyregion. The rate of increase of graupel mass in updraftregion 2 was the quickest, although the mass peak inthis region was the smallest. In the 14th minute, thegraupel mass in updraft region 2 was the largest. Becauseupdraft region 2 was located in the innermostregion, and the strong updraft in this region wouldhave continuously carried graupel generated there outof the region, the graupel mass generated should havebeen larger than the value illustrated in Fig. 5. Consequently, the increase rate of graupel mass in updraftregion 2 might have been the quickest before the startof lightning activity.
In the same profiles as in Fig. 4, the distributionsof graupel and ice crystals in Fig. 6 show thatice crystals were mainly located in the middle and upperparts of the updraft channel, and the low part ofthe subsidence region adjacent with the upper part ofthe updraft region in the 18th minute. Meanwhile, graupel was mainly located in the upper part of theupdraft channel, and the lower part of the subsidenceregion adjacent with the upper part of the updraft region.The concentration centers of ice crystals and graupel did not overlap: the center for ice crystalswas located in the upper left of the updraft channel, while the center for graupel was located to the rightof the updraft channel and on the border betweenthe updraft region and the upper subsidence region.Because ice crystals had a larger distribution region and the distribution region of graupel was included init, the mixed region of graupel and ice crystals musthave belonged to the graupel distribution region and was mainly located in the upper region of the updraftchannel and on the border between the updraft region and the upper subsidence region. These resultsare coincident with observation-based results derivedfrom radar data(Carey and Rutledge, 1996), in whichit was found that the mixed region of graupel and icecrystals primarily emerged in the upper portions of thestorm and were suspended in a vigorous updraft. Inthe 24th minute, the distribution height of ice crystalsremained the same as in the 18th minute(7–12 km), but the distribution height of graupel showed an evidentdecrease. The center of graupel distribution inthe 18th minute was 10–11 km. In the 24th minute, most graupel was located below 10 km, and a clearseparation between graupel and ice crystals occurred.3.3 Comparison of charges on graupel and on ice crystals
Ice crystals and graupel are charged with differentpolarities during charging processes. The net chargeof a region is the combined result of charges of differentpolarities on all kinds of particles. The evolutionsof the negative and positive charges on graupel and ice crystals in different vertical velocity ranges are illustratedin Fig. 7. In this simulated thunderstorm, thepositive charge was primarily carried by ice crystals and the negative charge by graupel. The evolutionof the positive charge on ice crystals and the negativecharge on graupel in most vertical velocity ranges weresymmetrical, except for in subsidence region 1.
 |
| Fig. 7. Evolution of the(a1–f1)postive charge and (a2–f2)negative charge(nC)on graupel and ice crystals in different vertical velocity ranges. |
According to the Gauss Eq.(1), the divergence(or convergence)of the negative charge on graupel canbe calculated:
where ρ is the density of negative charge on graupel, and v and vn are the velocity and the velocity perpendicularto the boundary, respectively. The timeseries of the charge divergence(positive meaning divergence and negative meaning convergence)in all verticalvelocity ranges are illustrated in Fig. 8a. Themain divergence regions of negative charge on graupelwere updraft region 2, updraft region 1, updraftregion, and quasi-steady region. The peak divergencein these regions increased from inside to outside accordingto their location relative to the updraft center.The peak times followed the order of first appearing inthe center, then the outside. The periods of negativecharge divergence partially overlapped in updraft region1, updraft region, and quasi-steady region. Thedivergence period in updraft region 2 was relativelyisolated compared to the periods in other regions. Themaximum divergence peak of graupel negative chargeappeared in the updraft region, followed by updraftregion 1 and quasi-steady region; the divergence peakin updraft region 2 was the smallest among the regionsin Fig. 8a.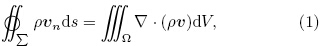
 |
| Fig. 8. Comparison in different vertical velocity ranges of(a)the outflow of negative charge(nC)on graupel and (b)the change in negative charge on graupel due to transformation of the vertical velocity region. |
On the other h and , there were some periods whenthe negative charge on graupel converged in all ofthe regions except for updraft region 2. The negativecharge on graupel in updraft region 1 kept convergingbefore the 16th minute; the negative chargein the updraft region primarily converged before the19th minute; the convergence of the negative charge inthe quasi-steady region dominated at all times exceptfor the period from the 20th to 26th minute; similarly, the convergence of the negative charge in the subsidenceregion also dominated most of the time exceptfor the period before the 23rd minute; and in subsidenceregion 1, the convergence also dominated mostof the time but the mass of the convergence was verysmall, 2–4 orders of magnitude less than the masses inother regions, although the duration of charge in thisregion was short. Thus, the main divergence regionsof negative charge on graupel were updraft regions, including updraft region 2, updraft region 1, and updraftregion.
According to the comparison of the vertical velocityin the same grid between adjacent times, thechange in the negative charge on graupel in the thunderstormdue to the change in vertical velocity couldbe calculated(Fig. 8b). The calculation results showthat the increase in negative charge on graupel due to transformations from other regions to the quasi-steadyregion was the largest. The amplitude of change fromthe maximum positive value to the maximum negativevalue in the updraft region was the most significant.On the whole, the magnitude of change due to thisfactor was 1011 nC at its largest, which was 2–3 ordersof magnitude less than the magnitude of changedue to charge transfer.
For the negative charge on graupel in a region, the source and sink of the negative charge should keepbalance as in Eq.(2):
where Qdeposit is the negative charge deposit, Qchargeis the negative charge generated in situ, QVC is thenegative charge change due to region transformation, Qoutflow is the divergence of negative charge, QPT isthe change in negative charge due to phase change, and Qneutra is the negative charge neutralized by lightningflashes. Qdeposit could be estimated according tothe change in negative charge on graupel illustrated inFig. 7. Qoutflow and QVC could be estimated accordingto the data in Fig. 8. QPT and Qneutra were allnegative, which always caused a reduction in the negativecharge on graupels. When the negative chargeon graupel in a region kept diverging, the estimatedQcharge would always be smaller than the actual evenif QPT and Qneutra were not taken into account.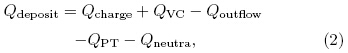
According to the above analysis, Qcharge was estimatedin updraft region 2, updraft region 1, and updraftregion, which were the main regions of negativecharge divergence(Fig. 9). The results indicated that:(1)the negative charge on graupels due to chargingprocesses in updraft region 2 was relatively significantbefore the start of lightning activity;(2)the increase innegative charge on graupel due to charging processesin updraft region 1 was significant during the first periodof lightning activity; and (3)the negative chargeon graupel due to charging processes in updraft regionwas significant during the last period of lightningactivity. The relatively long persistence of updraft region and the gradual increase in the volume of updraftregion due to the transformation from updraft region 2 and updraft region 1, causing increased concentrationsof graupel and ice crystals, should have been themain reasons leading to the maximum negative chargeon graupel due to charging processes in the updraftregion. Simultaneously, the time series evolutions alsoshow that the negative charge on graupel due to chargingprocesses in updraft region 2 and updraft region 1contributed the most to the negative charge on graupeldue to charging processes before the start of lightningactivity. Therefore, the dynamic and microphysicalcharacteristics in updraft region 2 and updraft region1 should have an important influence on the first lightningoccurrence.
 |
| Fig. 9. Evolution of negative charge on graupel due to the charging processes in different vertical velocity ranges. |
The above results indicate that the charging processesin updraft region 2 and updraft region 1 hadsignificant influence on the charge on graupel beforethe start of lightning activity. However, the net chargein these two regions was relatively smaller than that inother regions(Fig. 3). The reason might be that theseparation of negative charge on graupel and positivecharge on ice crystals in these two regions was inadequate, making the net charge in these regions muchsmaller than the charge on one kind of ice particle.
To investigate this possibility, the ratio of the negativecharge on graupel to the net negative charge inthose regions showing net negative charge was calculatedin all vertical velocity ranges(Fig. 10). A largerratio would mean a smaller contribution of the negativecharge on graupel to the net negative charge, and the mix of graupel-charged negative charge and icecrystal-charged positive charge was sufficient. FromFig. 10, the largest ratio appeared in updraft region 1 and the second largest in updraft region 2. Theyhad magnitudes equal to 104 or 105, which were significantlylarger than the magnitude of ratios in otherregions.
 |
| Fig. 10. Comparison for different vertical velocity ranges of the ratio of negative charge on graupel to net negative charge in grids with net negative charge. |
Simultaneously, the weighted heights of the negativecharge on graupel and the positive charge on icecrystals in all vertical velocity ranges were calculated(Fig. 11). The evolutions of the weighted heights showthat the vertical distance between the weighted heightof negative charge on graupel and the weighted heightof positive charge on ice crystals in quasi-steady regionwas the largest among all regions, and the vertical distanceincreased over time. The vertical distance in thesubsidence region was also evident at the beginning, but the distance became increasingly narrow after the26th minute. On the contrary, the vertical distance inthe updraft region was not obvious at the beginning, and the distance became increasingly large after the26th minute. The statistics on the weighted heightof negative charge on graupel and the positive chargeon ice crystals indicated that:(1)the vertical distancebetween these two weighted heights in quasi-steady regionwas the most significant, followed by subsidenceregion and then updraft region(Table 1);(2)the verticaldistances in all vertical velocity ranges increasedover time;(3)comparing the result before and afterthe 20th minute, the weighted heights of both nega-tive charge on graupel and positive charge on ice crystalsall decreased evidently; and (4)except for inupdraft region 2 and updraft region 1, the weightedheight of negative charge on graupel was always lowerthan that of positive charge on ice crystals in mostof the regions. The results indicate that the verticalvelocity range in the quasi-steady region should havebeen the most conducive for the separation of chargeof opposite polarity on different ice particles.
 |
| Fig. 11. Evolution of weighted average heights of negative charge on graupel and positive charge on ice crystals in the(a)updraft, (b)quasi-steady, and (c)subsidence regions. |
 |
According to the analysis in the present study, the biggest source of negative charge on graupel dueto charging processes was updraft region. Before thestart of lightning activity, the main negative chargeon graupel came from updraft region 2 and updraftregion 1. Compared with the distribution of graupel and ice crystals in the updraft channel, we concludethat the charging processes between graupel and icecrystals should primarily occur in the upper part ofthe strong updraft channel. This conclusion is supportedby previous observations(Carey and Rutledge, 1996).
Although the net charge in updraft region 2 and updraft region 1 was evidently smaller than that inother regions, the charge on graupel or ice crystals inthese two regions was not so small as the net chargecompared to the charge on ice particles in other regions.The analysis on the weighted height of negativecharge on graupel and positive charge on ice crystalsindicated that the vertical distance between these twoweighted heights in the quasi-steady region was themost significant, while the vertical distances in updraftregion and subsidence region—both adjacent tothe quasi-steady region—were the second most significant.At the same time, the net charge in these threeregions was more significant than in other regions.
Consequently, we constructed a conceptual modelto describe the generation and separation of charge asfollows: before the start of lightning activity, graupel and ice crystals are generated in updraft region 2 and updraft region 1. Graupel and ice crystals mix in theupper part of the updraft channel, and then the strongnon-inductive charging processes occur. Ice particlesare quickly charged during the first period of the thunderstorm, but the net charge is not significant becausethe separation between different polarities of chargeon ice particles is still insufficient. As the charged iceparticles are transferred into the region with weak verticalvelocity, graupel and ice crystals charged with differentpolarities begin to show significant separation.An evident charge structure is then formed in this region, with weak vertical velocity, and the electric fieldproduced in the charge structure becomes increasinglystrong until it results in lightning initiation. With theappearance of updraft region 2 and updraft region 1, amixed region of graupel, ice crystals, and supercooledwater appears mainly in updraft region, causing thecharging process to work primarily in this part of thestorm. Because of the huge volume of the updraft region, containing many ice particles, as well as the longpersistence time of the updraft region, the amount ofcharge generated in the updraft region due to chargingprocesses is the greatest.
The above model could explain observations ofthe “lightning hole” phenomenon(Krehbiel et al., 2000; Zhang et al., 2004; Calhoun et al., 2013). Theseparation of ice particles charged with different polaritiesmight be insufficient in the updraft channel in a strong thunderstorm, meaning the net charge inthe updraft channel would be so small that it wouldbe impossible to form an electric field strong enoughto produce lightning. When the charged ice particlesare transferred to the region with weak vertical velocity, the separation between opposite polarities ofcharge would become significant. A net charge layerstructure would then be constructed while the electricfield also becomes increasingly strong, until lightningis initiated. After the lightning initiation, lightningchannels would always tend to develop in the region, also with sufficient net charge. Therefore, lightningchannels would seldom develop into the strong updraftchannel because net charge is rare. Hence, a “hole”in lightning radiation sources in strong updraft, surroundedby regions with relative intensity of radiationsources, can sometimes be observed.
Owing to limited observations, wide detectionof net charge and vertical velocity in cloud is difficult, which made it impossible to improve our resultsthrough observations of the relatively weak vertical velocityrange being beneficial for the construction of anet charge structure. However, some recent observationscan support our suggestion. For example, Soula and Georgis(2013)reported large electric field valuesbelow weak precipitation regions compared to convectiveregions in southwestern France thanks to a fieldmill: 5–6 and 2–3 kV m−1, respectively. These resultsimply that there is more net charge in weak precipitationregions with weak vertical velocity than in convectiveregions with strong updraft. Wang(2014)analyzedthe wind field derived from dual-Doppler radardata and cloud-to-ground lightning location data, and found that about 79.1% of the cloud-to-ground lightningflashes were located in regions with weak updraftspeed or weak downdraft speed(–5 to 5 m s−1); relativelymore cloud-to-ground lightning flashes tended toappear in the region with weak updraft. A net chargestructure was necessary for formation of the strongelectric field, and the sufficiently strong electric fieldwould have directly initiated the lightning. Accordingto the observation that more lightning tended to occurin the region with weak vertical velocity, it can be reasonablyconcluded that a net charge structure shouldbe easier to construct in this region. Therefore, thisobservation supports our suggestion that a net chargestructure is mainly formed in the region with weakvertical velocity.5. Conclusions
An isolated thunderstorm was simulated by usinga 3D cloud model coupled with charging and dischargingprocesses. Analysis of the spatial and temporalcharacteristics of the content of ice particles and thecharges on ice particles in different vertical velocityranges indicated that:
(1)Ice particles obtained the most charge due tocharging processes in the updraft region. The maximummagnitude of negative charge on graupel in theupdraft region could reach 1014 nC.
(2)Before the start of lightning activity, chargeson ice particles were generated in the charging processesin updraft region 2 and updraft region 1. Duringthis period, the total negative charge on graupelin these two regions all reached a magnitude of 1013nC. Because of the sufficient mix between ice crystalscharged with positive charge and graupel chargedwith negative charge, a net charge in these two regionswas net evident. After the charged ice particles weretransferred into the outer regions, beneficial for chargeseparation, a layered charge structure quickly formed.Therefore, the charging processes in updraft region 2 and updraft region 1 were important for the first lightningactivity.
(3)Charging processes between ice particles inthe quasi-steady region could also occur, but primarilyworked during the middle stage of lightning activity.The peak of negative charge on graupel in quasi-steadyregion was close to 1 × 10¹⁴ nC. With the decreasein updraft, updraft regions were weakened and transformedinto quasi-steady region. Much graupel in theupdraft regions transferred into the quasi-steady region, intensifying the charging processes there.
(4)Through comparison of the contribution ofcharging processes, the vertical velocity in the quasisteadyregion was more conducive to the separation ofcharges with different polarities, causing the most significant net charge in the quasi-steady region. Thepeaks of net positive charge and net negative charge inthe quasi-steady region all exceeded and neared 1000nC, which was much larger than the peaks in othervertical velocity ranges.
Our study represents an important contributiontoward an advanced underst and ing of the relationshipbetween lightning activity and the dynamics of thunderstorms.The results indicate that the vertical velocityin a storm’s quasi-steady and adjacent regionsis beneficial for the formation of a net charge structure, and thus these regions should be the main regionswhere lightning initiates and propagates. Our findingsprovide a reference for the development of lightningwarning or forecasting methods using numerical models and advanced detection equipment.
| Baker, M. B., H. J. Christian, and J. Latham, 1995: A computational study of the relationships linking lightning frequency and other thunderstorm param-eters. Quart. J. Roy. Meteor. Soc., 121, 1525-1548. |
| Baker, M. B., A. M. Blyth, H. J. Christian, et al., 1999: Relationships between lightning activity and various thundercloud parameters: Satellite and modeling studies. Atmos. Res., 51, 221-236. |
| Black, R. A., and J. Hallett, 1999: Electrification of the hurricane. J. Atmos. Sci., 56, 2004-2028. |
| Boccippio, D. J., 2002: Lightning scaling relations revis-ited. J. Atmos. Sci., 59, 1086-1104. |
| Bringi, V. N., K. Knupp, A. Dtwiler, et al., 1997: Evolu-tion of a Florida thunderstorm during the convection and precipitation/electrification experiment: The case of 9 August 1991. Mon. Wea. Rev., 125, 2131-2160. |
| Bruning, E. C., and D. R. MacGorman, 2013: Theory and observations of controls on lightning flash size spectra. J. Atmos. Sci., 70, 4012-4029. |
| Calhoun, K. M., D. R. MacGorman, C. L. Ziegler, et al., 2013: Evolution of lightning activity and storm charge relative to dual-Doppler analysis of a high-precipitation supercell storm. Mon. Wea. Rev., 141, 2199-2223. |
| Carey, L. D., and S. A. Rutledge, 1996: A multiparameter radar case study of the microphysical and kinematic evolution of a lightning producing storm. Meteor. Atmos. Phys., 59, 33-64. |
| Carey, L. D., S. A. Rutledge, and W. A. Petersen, 2003: The relationship between severe storm reports and cloud-to-ground lightning polarity in the contiguous United States from 1989 to 1998. Mon. Wea. Rev., 131, 1211-1228. |
| Deierling, W., and W. A. Petersen, 2008: Total light-ning activity as an indicator of updraft charac-teristics. J. Geophys. Res., 113, D16210, doi: 10.1029/2007JD009598. |
| Dye, J. E., J. J. Jones, A. J. Weinheimer, et al., 1989: Observations within two regions of charge during initial thunderstorm electrification. Quart. J. Roy. Meteor. Soc., 114, 1271-1290. |
| Heymsfield, G. M., L. Tian, A. J. Heymsfield, et al., 2010: Characteristics of deep tropical and subtropical con-vection from nadir-viewing high-altitude airborne Doppler radar. J. Atmos. Sci., 67, 285-308. |
| Hu Zhijin and He Guanfang, 1987: Numerical simulation of microphysical processes in cumulonimbus. Part I: Microphysical model. Acta Meteor. Sinica, 45, 467-483. (in Chinese) |
| Krehbiel, P. R., R. J. Thomas, W. Rison, et al., 2000: Lightning mapping observations in central Okla-homa. Eos Trans. AGU, 81, 21-25. |
| Kuhlman, K. M., C. L. Ziegler, E. R. Mansell, et al., 2006: Numerically simulated electrification and lightning of the 29 June 2000 STEPS supercell storm. Mon. Wea. Rev., 134, 2734-2757. |
| Lang, T. J., and S. A. Rutledge, 2002: Relationships between convective storm kinematics, precipitation, and lightning. Mon. Wea. Rev., 130, 2492-2506. |
| Liu Dongxia, Qie Xiushu, and Feng Guili, 2010: Evolu-tion characteristics of the lightning and the relation with dynamical structure in a mesoscale convective system over North China. Chinese J. Atmos. Sci., 34, 95-104. (in Chinese) |
| Miller, K., A. Gadian, C. Saunders, et al., 2001: Model-ing and observations of thundercloud electrification and lightning. Atmos. Res., 58, 89-115. |
| Palucki, J. L., M. I. Biggerstaff, D. R. MacGorman, et al., 2011: Comparison between low-flash and non-lightnig-producing convective areas within a mature mesoscale convective system. Wea. Forecasting, 26, 468-486. |
| Petersen, W. A., S. A. Rutledge, and R. E. Orville, 1996: Cloud-to-ground lightning observations to TOGA COARE: Selected results and lightning location al-gorithm. Mon. Wea. Rev., 124, 602-620. |
| Petersen, W. A., S. A. Rutledge, R. C. Cifelli, et al., 1999: Shipborne dual-Doppler operations during TOGA COARE: Integrated observations of storm kinemat-ics and electrification. Bull. Amer. Meteor. Soc., 80, 81-97. |
| Reinhart, B., H. Fuelberg, R. Blakeslee, et al., 2014: Understanding the relationships between lightning, cloud microphysics, and airborne radar-derived storm structure during Hurricane Karl (2010). Mon. Wea. Rev., 142, 590-605. |
| Rutledge, S. A., E. R. Williams, and T. D. Keenan, 1992: The down under Doppler and electricity ex-periment (DUNDEE): Overview and preliminary results. Bull. Amer. Meteor. Soc., 73, 3-16. |
| Soula, S., and J. F. Georgis, 2013: Surface electrostatic field below weak precipitation and stratiform regions of mid-latitude storms. Atmos. Res., 132-133, 264-277. |
| Tan Yongbo, 2006: Numerical simulation of the relation-ship of the lightning discharge with the space charge and potential distribution in thundercloud. Ph. D. dissertation, University of Science and Technology of China, China, 173 pp. (in Chinese) |
| Tessendorf, S. A., L. J. Miller, K. C. Wiens, et al., 2005: The 29 June 2000 supercell observed during STEPS. Part I: Kinematics and microphysics. J. Atmos. Sci., 62, 4127-4150. |
| Wang Chenxi, 2014: The relationship between vertical airflow characteristics and lightning activity of thun-derstorm. Master degree thesis, Chinese Academy of Meteorological Sciences, China, 66 pp. (in Chi-nese) |
| Wang Fang, Xiao Wenan, Lei Hengchi, et al., 2009: Nu-merical simulation of electricity characteristic of a thunderstorm case in summer of Jilin. Plateau Me-teor., 28, 385-394. (in Chinese) |
| Wiens, K. C., S. A. Rutledge, and S. A. Tessendorf, 2005: The 29 June 2000 supercell observed during STEPS. Part II: Lightning and charge structure. J. Atmos. Sci., 62, 4151-4177. |
| Williams, E. R., and R. M. Lhermitte, 1983: Radar tests of the precipitation hypothesis for thunderstorm electrification. J. Geophys. Res., 88, 10984-10992. |
| Workman, E. J., and S. E. Reynolds, 1949: Electrical ac-tivity as related to thunderstorm cell growth. Bull. Amer. Meteor. Soc., 30, 142-149. |
| Yan Muhong, Liu Xinsheng, An Xuemin, et al., 1996: A simulation study of non-inductive charging mech-anism in thunderstorm. I: Affect of cloud factor. Plateau Meteor., 15, 425-437. (in Chinese) |
| Zhang Yijun, Yan Mohong, and Liu Xinsheng, 1999: Model study of discharging processes in thunder-storm. Chin. Sci. Bull., 44, 1322-1325. (in Chi-nese) |
| Zhang Yijun, P. R. Krehbiel, Liu Xinsheng, et al., 2003: Three dimensions structure of lightning discharge channel. Plateau Meteor., 22, 217-220. (in Chinese) |
| Zhang Yijun, Meng Qing, P. R. Krehbiel, et al., 2004: Temporal and spatial distribution characteristics of lightning VHF radiation sources in supercell. Chin. Sci. Bull., 49, 499-505. (in Chinese) |
| Zheng Dong, Zhang Yijun, Meng Qing, et al., 2010: Total lightning characteristics and the electric structures evolution in a hailstorm. Acta Meteor. Sinica, 68, 248-263. (in Chinese) |
| Zhou Zhimin and Guo Xueliang, 2009: 3D modeling on relationships among intracloud lightning, updraft and liquid water content in a severe thunderstorm case. Climatic Environ. Res., 14, 31-44. (in Chi-nese) |
| Zipser, E. J., 1994: Deep cumulonimbus cloud systems in the tropic with and without lightning. Mon. Wea. Rev., 122, 1837-1851. |