 2015, Vol. 28
The Chinese Meteorological Society
Article Information
- LIU Yin, ZOU Xiaolei. 2015.
- Impact of 4DVAR Assimilation of AIRS Total Column Ozone Observations on the Simulation of Hurricane Earl
- J. Meteor. Res., 28(2): 257-271
- http://dx.doi.org/10.1007/s13351-015-4058-2
Article History
- Received May 14, 2014
- in final form December 14, 20144


2 Key Laboratory of Meteorological Disaster of Ministry of Education, Nanjing University of Information Science & Technology, Nanjing 210044, China;
3 Earth System Science Interdisciplinary Center, University of Maryland, MD 20740, USA
Due to imperfect parameterization of the air-seainteraction and convection, and a lack of observationsover the ocean, the large-scale environmental fields and initial conditions of a tropical cyclone(TC)cannotbe accurately described in a numerical weatherprediction(NWP)model. This leads to serious errorsin numerical prediction of TCs. However, satellite remotesensing data contain valuable meteorological information and have wide coverage(especially in areaswith limited conventional observations, such as oceans and remote plateaus) and high spatial and temporal resolution. Satellite observation is therefore a majorobservational source used to improve prediction of TCs(Li and Fang, 2012).
In general, satellite data assimilations are dividedinto two categories: indirect assimilation of atmospherictemperature and moisture data retrieved fromsatellite observations in an NWP model, and directassimilation through a radiative transfer model, linkingsatellite observations and model variables to obtaintemperature and moisture variables close to theactual state of the atmosphere(Xue, 2009). Previousstudies have demonstrated that these two methods areefficient in improving the numerical prediction of TC track and intensity(Le et al., 2002; Ding et al., 2010;Wang et al., 2013; Wu et al., 2014). However, thereare still a number of satellite observations that cannotbe in any way incorporated into an NWP model, resultingfrom lack of an observation operator. Amongthem are the ozone data measured by the AtmosphericInfrared Sounder(AIRS)on board the Aqua satelliteof the Earth Observing System(EOS).
AIRS is presently the most advanced hyperspectralinfrared atmospheric sounding instrument, covering2378 spectral channels from 3.74 to 15.4 μm.The cross-track dimension of AIRS is 1650 km and thespatial resolution at nadir is 13.5 km with twice-dailyobservations. With the Advanced Microwave SoundingUnit(AMSU) and Humidity Sounder for Brazil(HSB), AIRS can provide ozone profiles and total columnozone with high spatial and temporal resolution(Aumann et al., 2003). Since ozone concentrationvaries at different altitudes and latitudes due to inhomogeneoustransport of atmospheric flow, total columnozone is a passive tracer on synoptic scale. Therefore, ozone is highly correlated with many atmosphericvariables(Tian et al., 2007).
In the early days, Norm and (1953) and Ohring and Muench(1960)noted that the temporal variationsof station ozone data were inherently related tothose of temperature, geopotential height, and meridionalwind at 100 hPa. Danielsen(1968) and Shapiroet al.(1982)found that ozone distributions at thetropopause could be treated as a surrogate for potentialvorticity(PV)in the stratosphere and containedinformation on both synoptic-scale and mesoscale flowregimes. Davis et al.(1999)noted that the distributioncharacter of vertically integrated ozone was linkedto the positions of upper-level troughs and ridges.Jang et al.(2003)made the first efforts to assimilateTotal Ozone Mapping Spectrometer(TOMS)data.Their results indicated that the spatial distributionof total ozone within a TC reflected the cyclone circulationevolution, so the total ozone distribution couldbe used to predict winter storms.
Attempts have been made to apply ozone datato the study of hurricanes. Using TOMS ozone datafrom 1979 to 1982, Stout and Rodgers(1992)concluded that a TC changed direction when its distancefrom the ozone-rich upper tropospheric troughwas approximately 15-degree latitude. Carsey and Willoughby(2005)reported that the minimum and maximum ozone concentrations during intensificationof hurricanes measured by the NOAA P-3 hurricaneresearch aircraft were observed in the eyewall and eyerespectively, while low ozone concentrations duringweakening of hurricanes were found throughout theeyewall and eye regions. After a careful examinationof TOMS observations of many hurricanes from1996 to 2003, Zou and Wu(2005)confirmed Carsey and Willoughby’s findings. Moreover, Zou and Wu(2005)found that the spatial distribution of totalozone within TCs was correlated with that of meanPV and upper-level geopotential height. Wu and Zou(2008)subsequently assimilated TOMS ozone datainto an NWP model to better describe the large-scaleenvironment of Hurricane Erin(2001), based on therelationship between total ozone and mean PV. Theirresults suggested that the assimilation of total ozonedata produced a significant improvement in hurricanetrack prediction. More recently, a quality control(QC)scheme for assimilating AIRS ozone data in an NWPmodel was developed by Wang et al.(2012). Thenumerical simulation results of hurricane cases implementedby the QC scheme showed that the main informationprovided by the ozone data was retained, while the data quality was significantly improved.
Previous studies have concerned primarily on improvingTC simulations by adjusting the large-scaleenvironment field with TOMS ozone data assimilation.In contrast to TOMS data, AIRS ozone datahave higher temporal and spatial resolution and containmore meteorological information in the upper troposphere.This study aims to examine if it is possibleto improve the prediction of TC track and intensityby assimilating the AIRS ozone data into the initialfields of a mesoscale NWP model. For this purpose, application of a four-dimensional variational(4DVAR)assimilation scheme on selected model levels is developedto assimilate AIRS ozone data and to verify theassimilation effects on numerical prediction of Hurricane Earl(2010).
2. Synoptic overview of Hurricane Earl(2010)Hurricane Earl(2010) is chosen for initialization and hindcast experiments in this study. Figure 1 depicts its observed track based on Unisys data(http://weather.unisys.com/hurricane/). Hurricane Earl began as a tropical depression on 25 August 2010, and strengthened into a tropical storm around 1200UTC 25 August. Under the influence of a subtropicalridge over the western Atlantic, the storm movedquickly westward in the next two days. It was expectedto slow and turn northwestward due to the Fujiwharaeffect of the nearby Hurricane Danielle(2010).At about 0000 UTC 30 August, Hurricane Earl intensifiedinto a category-3 hurricane, and reached category-4 strength on the same day. At 0000 UTC 1 September, Earl weakened to a category-3 hurricane, due toincreased southwest shear. However, data from NOAAindicate that Earl re-strengthened to a category-4hurricane at 1800 UTC 1 September, with a minimum sea level pressure(SLP)of 927 hPa and 230 km h−1maximum sustained winds. Earl remained at this intensityuntil 1500 UTC 2 September 2010, then itbegan to weaken on 3 September 2010. Earl turnednortheastward and further weakened to a tropicalstorm at 0000 UTC 4 September, before making l and fallin Nova Scotia as a category-1 hurricane around1400 UTC 4 September. After l and fall, Earl transformedinto an extratropical cyclone, and merged withanother low pressure system over the Labrador Sea by0600 UTC 6 September. This study focuses on the periodwhen Earl regained its peak intensity prior to itsl and fall from 1800 UTC 1 to 1800 UTC 4 September2010.
3. Numerical model, observational data, and assimilation scheme 3.1 Numerical modelThe Penn State/NCAR non-hydrostatic mesoscalemodel version 5(MM5)(Grell et al., 1994) and its 4DVAR system(Zou et al., 1997)are used in thisstudy. All experiments are carried out on two nestedmodel domains(Fig. 1). The outer domain(D01), with 95 × 95 grid points, is fixed, and simulates thelarge-scale environment with a horizontal resolutionof 45 km. The inner domain(D02)has 91 × 91 gridpoints and moves with Hurricane Earl, simulating thestorm-scale flows with a horizontal resolution of 15km. There are 27 σ layers in the vertical direction, and the pressure at model top is 50 hPa. The physicalparameterizations used for the forecast model are thesame as those for the data assimilation system, includingthe Grell cumulus scheme, the medium-range forecast(MRF)planetary boundary layer(PBL)scheme, and the Reisner explicit moisture scheme(Grell et al., 1994). The initial and lateral boundary conditionsare obtained from the NCEP Global Forecast System(GFS)Final(FNL)data with a spatial resolution of1◦× 1◦.
 |
| Fig. 1. Observed track of Hurricane Earl from 0000 UTC30 August to 1800 UTC 5 September 2010, with open circlesindicating storm or depression status, and plus symbolsindicating hurricane status. The dates are indicatedalong the track. Also indicated in this figure are the outermosthindcast domain, D01(45-km resolution), and twomoving inner domains, D02(15-km resolution), one at thebeginning(1800 UTC 1 September 2010) and one at theend(1800 UTC 4 September 2010)of the Hurricane Earlsimulation with a start time of 1800 UTC 1 September. |
AIRS ozone data are retrieved from 41 channels, covering a spectral range from 9.354 to 10.029 μm(includingthe peak of the P-branch of the strong ozone absorption close to 10 μm). These ozone data can befound in both AIRS level-2 and level-3 st and ard products.AIRS level-2 datasets, which are produced twicedaily, contain the ozone mixing ratio at 28 st and ardpressure levels and the total column ozone on a resolutionof 45 km at nadir. Many studies on the evaluationof AIRS-retrieved ozone have shown that AIRS ozonedata are credible and appropriate for further applications(Bian et al., 2007; Monahan et al., 2007; Pan et al., 2007; Pittman et al., 2009). The AIRS level-2st and ard ozone data are chosen for this study.
The spatial distribution of AIRS total ozone ishighly correlated with the corresponding GeostationaryOperational Environmental Satellite(GOES)-13visible cloud image(http://www.nrlmry.navy.mil/)forHurricane Earl(Fig. 2). It is shown that AIRS totalozone may be a good source of information reflectingthe structure of hurricane near the tropopause, with high total ozone in downdraft areas and low totalozone in updraft areas. The intrusion of stratosphericair into the hurricane core usually causes ozone-richareas, defined as tropopause folding(Rodgers et al., 1990; Bosart, 2003). AIRS provided good data coveragefor Hurricane Earl at 1800 UTC 1 September2010, which was chosen as the model initial time.
 |
| Fig. 2.(a)AIRS total ozone distribution for Hurricane Earl at 1800 UTC 1 September 2010 and (b)the correspondingGOES-13 visible cloud image(http://www.nrlmry.navy.mil)for Hurricane Earl at 1325 UTC 1 September 2010. |
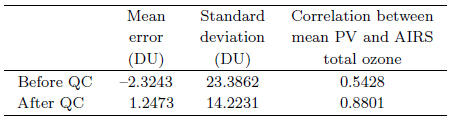
Before applying AIRS total ozone to data assimilation, erroneous data were removed by a QC scheme.The QC scheme also ensures that the observation errorsare consistent with the errors assumed in the dataassimilation model. Wang et al.(2012)found that almostall AIRS ozone data around the center of a hurricaneare flagged as poor by the original QC scheme, even though the data might be informative. They developeda new QC scheme that improved the qualityof AIRS ozone data for the assimilation requirement, while retaining more observations than the originalQC scheme near the hurricane center. The QC schemedeveloped by Wang et al.(2012)is used to improvethe quality of AIRS ozone data in this study. The significantimprovement of the correlation between meanPV and AIRS total ozone after QC, as well as lowermean error and st and ard deviation in the data as seenin Table 1, lends credibility to the assimilation applicationsof AIRS ozone data.
NWP model, because total ozone is not a modelvariable or an explicit function of model variables.Jang et al.(2003)found that TOMS total ozone observations(Ω)were highly correlated with mean PV(q)in midlatitudes at both 30- and 90-km resolutions. A linear regression model between total ozone and mean PV was used as a simple observation operatorfor assimilating TOMS ozone in a 4DVAR procedure:
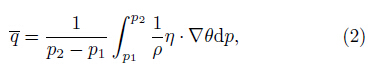
where α and β are constants determined by the statisticsof total ozone and mean PV. The mean PV iscalculated by usingwhere p is pressure, p1 is 400 hPa, p2 is 50 hPa, ρis atmospheric density, η is absolute vorticity, and θis potential temperature. The unit of mean PV isPVU, where 1 PVU = 10−6 m2 K kg−1 s−1. Thus, total ozone is associated with the model variables byEqs.(1) and (2). Using TOMS ozone data, Zou and Wu(2005)found that high correlations between totalozone and mean PV could still be obtained if storm and synoptic-scale features were separated. They developeda procedure to apply Eq.(1)in two differentregimes, making it possible to assimilate totalozone data within and around a TC. In the later largescaleassimilation experiments conducted by Wu and Zou(2008), they took a simple regime-dependent linearregression model as the observation operator, and demonstrated the capability of TOMS ozone data inhurricane track prediction.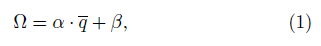
The relationship of Eq.(1)is applicable throughoutthe whole development process of a TC(Liu, 2014). Therefore, ozone data assimilation based onEq.(1)can be used to efficiently adjust the largescaleenvironment field(Wu and Zou, 2008). However, a known problem in the total ozone assimilationis the incorrect vertical data distribution, which resultsin a difficulty of TC initialization based on ozonedata assimilation(Durnford et al., 2009). Comparedwith TOMS ozone data used in Jang et al.(2003), Zou and Wu(2005), and Wu and Zou(2008), AIRSozone data have a higher spatial and temporal resolution and contain more meteorological informationthat can be incorporated into mesoscale data assimilation.Thus, Eq.(1)requires modification before itis used to assimilate AIRS ozone data. Moreover, thetotal ozone is highly correlated with PV at some levels(Hood et al., 2005), indicating that different linearrelations between total ozone and mean PV at differentlevels may need to be applied in the ozone dataassimilation(Durnford et al., 2009). Based on theabove discussion, this study seeks a proper initializationscheme to incorporate AIRS ozone data into themeso- and micro-scale initial field over D02 to improveTC prediction.
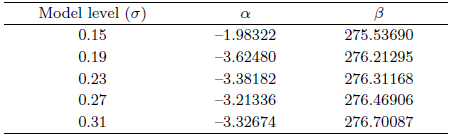
First, we calculate the correlation between theAIRS total ozone and mean PV in D02 at 1800 UTC1 September 2010, and obtain a correlation value of0.88, which is consistent with the result of Zou and Wu(2005). Second, we calculate the correlation betweenAIRS total ozone and PV at each model levelfrom 400 to 50 hPa. The correlation values range from–0.51 to –0.76, indicating the existence of high correlationbetween total ozone and PV at some model levels.Third, we select five model sigma levels(σ = 0.15, 0.19, 0.23, 0.27, and 0.31)with the highest correlationcoefficients and establish the observation operator ofeach level for the 4DVAR assimilation of AIRS ozonedata. The observation operator can be linearly expressedas
where α and β are constants.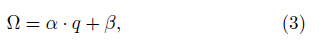
For Hurricane Earl, specific steps for AIRS ozonedata preparation are as follows. First, we improve thequality of AIRS ozone data with the QC scheme developedby Wang et al.(2012). After QC, 1672 ozonedata were collected at 1800 UTC 1 September 2010.Second, we use the Cressman interpolation method toobtain the PV value at the corresponding location ofozone data at each level. At 1800 UTC 1 September2010, 1672 PV data were collected at each level.Third, we perform a statistical analysis on the ozonedata and the PV data to obtain α and β at each level.The values of α and β at the five selected levels areshown in Table 2.
 |
The assimilation module of the AIRS ozone datais then designed and added in the MM5 4DVAR system.In 4DVAR experiments, the cost function to beminimized is written as
where x0 is the model state at t0(the beginning ofthe assimilation window); xb is a background or priorestimate of x0; B is the background error covariancematrix; R is the observation error covariance matrix;d is the AIRS ozone observation, M is the nonlinearoperator representing the NWP model from initialtime t0 to time ti; and H is the observation operatorthat converts model space to observation space. The4DVAR method seeks the optimal initial conditionsunder the constraint of an NWP model, so the initialmodel fields are dynamically and physically consistent.It is also worth noting that the observation operator inthis study, established directly at a model level, avoidsthe conversion process between the p-coordinate and σ-coordinate systems in Eq.(1). Therefore, the assimilationefficiency with Eq.(3)is significantly greaterthan that with Eq.(1).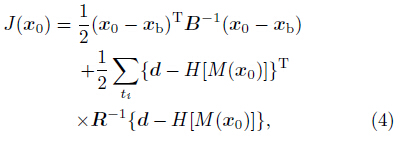
A group of experiments(denoted as Earl0118)areconducted to assess the impact of AIRS ozone data onthe 72-h hindcast of Hurricane Earl. Hindcasts withoutdata assimilation(i.e., initialized with xb)are referredto as “control.” Experiments labeled “ozone”use the initial conditions obtained after AIRS ozone data assimilation. In Earl0118, AIRS ozone data at1800 UTC 1 September 2010 are assimilated at 3-minintervals in a half-hour 4DVAR assimilation windowfrom 1800 to 1830 UTC.
4. Numerical results 4.1 TC trackFigure 3a shows the predicted tracks of HurricaneEarl from both the control and ozone experiments, from 1800 UTC 1 September 2010. The Unisys observedbest track(OBS)is also plotted for comparison.Earl initially moved northwestward, experienceda sharp turn, and then moved northeastward 24 hlater. Without any data assimilated into the NWPmodel, the TC track predicted by the control experimentis on the east side of the observed track and thetrack error increases rapidly after the simulation starttime(Fig. 3b), resulting in delayed l and fall with a positionerror of about 250 km. Compared with the controlexperiment, the ozone experiment improves thetrack simulation significantly during the entire 72-hhindcast period, with the track error below 150 km and the l and fall position closer to that observed. Thetrack differences between the control and ozone experimentsare very small during the first 18 h and becomemuch larger afterwards.
 |
| Fig. 3.(a)Tracks of Hurricane Earl from control and ozone experiments of Earl0118 and the best track provided byUnisys(http://weather.unisys.com), and (b)track errors of the control and ozone experiments of Earl0118 during the72-h hindcast period. The hindcast model is initialized at 1800 UTC 1 September 2010, and the numbers along thetracks in(a)indicate the hindcast hour. |
Figure 4 depicts the time variation of the centralSLP(Fig. 4a) and the central SLP error(Fig. 4b)from the control and ozone experiments. The observedcentral SLP from Unisys is also shown as a referencein the figure. The OBS shows that the central SLPof Earl during the first 15 hours rapidly reduces from940 to 930 hPa, prior to the gradual weakening. Withoutthe assimilation of AIRS ozone data, variations ofTC central SLP predicted by the control experimentshow a steady trend that fails to capture the intensitychange of Earl. In contrast, the central SLP inthe ozone experiment reduces significantly during thefirst 18 hours and is almost the same as the observationbetween 1800 and 2100 UTC. This indicates thatthe central SLP is adjusted by the numerical modelgradually after the assimilation of ozone data. From the SLP error of control and ozone experimentsof Earl0118 during the 72-h hindcast period(Fig. 4b), it can be seen more clearly that the ozone experimentduring the first 18 hours improves the intensity simulationconstantly, but tends to overpredict the intensityduring the following simulation.
 |
| Fig. 4.(a)Sea level pressure(SLP)of the center of Hurricane Earl from control and ozone experiments of Earl0118 and Unisys(http://weather.unisys.com), and (b)SLP error of control and ozone experiments of Earl0118 during the 72-hhindcast period. |
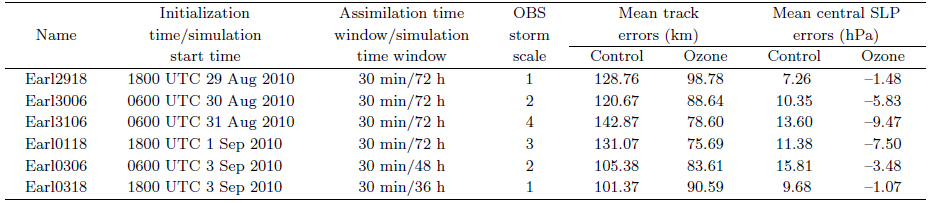
To investigate the effectiveness of the 4DVAR assimilationscheme using AIRS ozone data in improvingthe prediction of Hurricane Earl, comparison experimentsare conducted for five more cases(see Table 3). Because AIRS provides twice-daily global observations, the overpass time of the chosen areas is within±3 h of 0600 and 1800 UTC every day. Thus, theinitial time in this study is chosen to be either 0600or 1800 UTC, corresponding to the observation timeof AIRS ozone data. Moreover, only the AIRS ozonedata with good coverage of Earl are selected. Similarto Earl0118, the QC scheme developed by Wang etal.(2012)is applied in the five added cases(Earl2918, Earl3006, Earl3106, Earl0306, and Earl0318). In addition, the physical options in the five cases are thesame as those in Earl0118, with only different timesettings as shown in Table 3. The statistical resultsshow that the mean track error is reduced significantlyafter the assimilation of AIRS ozone data, especiallyafter assimilating the ozone data during the strongintensity period. Compared with the control experiment, the simulated central SLP is reduced significantlyafter the assimilation of AIRS ozone data, and is even lower than the observation. On the whole, thebatch experiments indicate that the 4DVAR assimilationscheme on the selected levels(as indicated in Table 1 for Earl0118, table omitted for other groups of experiments)improves the track prediction of HurricaneEarl effectively, in addition to having some capabilityin reproducing the intensity and intensity changes ofHurricane Earl as the time of integration increases.
 |
PV is a physical quantity containing thermodynamic and dynamic information, which can be appliedto the comprehensive diagnosis of TCs(Wu and Wang, 2000). In order to assess the impact of incorporatingAIRS ozone data into the initial field in simulatingHurricane Earl, Fig. 5 shows PV at 400 hPa, thezonal cross-section of PV through the hurricane centerfrom the control experiment of Earl0118, and PV incrementsfrom ozone experiment of Earl0118 at 1800UTC 1 September 2010. Mesoscale information is incorporatedinto the PV field after the assimilation ofAIRS ozone data(Figs. 5a and 5b). From Figs. 5c and 5d, the assimilation of AIRS ozone data is seen tomodify the PV field most above 400 hPa, consistentwith the selected levels in the assimilation scheme. PVabove 400 hPa is increased in the ozone experiment.To assess the impact of the initial PV adjustments onthe development of Earl, Fig. 6 shows PV at 400 hPa, a zonal cross-section of PV through the hurricane centerfrom the control experiment, and PV incrementsfrom the ozone experiment of Earl0118 at 1200 UTC2 September 2010. This last panel corresponds to thetiming of the significant improvement of Earl as observedin Figs. 3 and 4. This result shows that the PV increments from the ozone experiment of Earl0118are stronger after an 18-h integration, compared withthe control experiment(Figs. 6a and 6b). Meanwhile, vertical differences are found below 300 hPa, especiallybelow 500 hPa(Figs. 6c and 6d). The results fromthe other five groups of experiments(figures omitted)also indicate that the PV differences in the ozone experimentpropagate into the lower layers as the integrationtime increases, although the assimilation ofAIRS ozone data at the initial time is found to mainlychange the PV distribution close to the tropopause.According to the conclusion of Wu and Wang(2000), low-level vortex motion can be affected through the socalledasymmetric penetration flows associated withthe upper-level PV anomaly. Thus, the modificationof the PV field in the ozone experiment improves thesimulation of Hurricane Earl.
 |
| Fig. 5. Horizontal distributions of(a)PV at 400 hPa from the control experiment and (b)PV increments at 400 hPafrom the ozone experiment. Zonal sections across the hurricane center of(c)PV from the control experiment and (d)PV increments from the ozone experiment. All panels are for Earl0118 at 1800 UTC 1 September 2010. |
 |
| Fig. 6. As in Fig. 5, but at 1200 UTC 2 September 2010. |
Around the TC center, release of huge latent heatassociated with vigorous updrafts and abundant moistureoccurs, while in the TC eye area, adiabatic warmingoccurs with strong downdrafts. They are combinedto generate the TC warm core(Yan et al., 2013). Figure 7 shows zonal and meridional cross-sections of temperature departure in the control and ozone experimentsat 1800 UTC 1 September 2010. Temperaturedeparture is calculated as the temperature at each gridpoint minus the mean temperature averaged over thearea centered at the hurricane eye and with a radiusof 500 km to the hurricane center at each model level.At the model intial time, the warm core in the ozoneexperiment is stronger, with a maximum temperaturedeparture of 12℃(while it is about 7℃ in the controlexperiment) and a narrower cylindrical area from 600to 150 hPa(Fig. 7). The stronger warm core in theozone experiment indicates that the intensity of the hurricane is increased at some model levels with theassimilation of AIRS ozone data. The wind field inthe ozone experiment displays no much difference atthis time. Figure 8 shows zonal and meridional crosssectionsof temperature departure in control and ozoneexperiments after an 18-h integration. The maximumwind speed surrounding the hurricane center is significantlyenhanced after 18 h, and the warm core isstronger at all the levels above 700 hPa with a moreuniform vertical structure, indicating that the effectof ozone data assimilation has penetrated to a largervertical extent. The results from the other five groups of experiments(figures omitted)reveal that the warmcore of Hurricane Earl is significantly intensified in allthe cases after the assimilation of AIRS ozone data, which leads to improvement in simulation of otherfields(such as wind)near the hurricane center. A detaileddiagnosis of the impact of ozone data assimilationon wind field is provided next.
 |
| Fig. 7.(a, b)Longitude-height sections and (c, d)latitude-height sections of the temperature departure(shaded) and horizontal wind field(contour)across the hurricane center from(a, c)the control experiment of Earl0118 and (b, d)theozone experiment of Earl0118 at 1800 UTC 1 September 2010. |
 |
| Fig. 8. As in Fig. 7, but at 1200 UTC 2 September 2010. |
TC motion can be approximated by a massweighteddeep layer-mean flow field, which is generallybetter than single level steering(Dong and Neumann, 1983; Velden and Leslie, 1991). The environmentalsteering flows can be approximated by the mean flows near the TC center(Holl and , 1984; Wang et al., 1998).Therefore, the steering flows in this study are calculatedbetween 850 and 300 hPa in the hurricane centerarea with a radius of 500 km. Figure 9 shows the zonal and meridional components of the steering flows fromthe control and ozone experiments of Earl0118 duringthe 72-h hindcast period. It is found that the zonalcomponent of the steering flows from the control and ozone experiments first decreased, and then increasedduring the simulation(Fig. 9a), consistent with thesimulated motion feature as shown in Fig. 3a. Moreover, the zonal component of the steering flows fromthe ozone experiment during 12–51 h is smaller thanthat from the control experiment, resulting in a west-ward track during the simulation. Figure 9b indicatesthat the difference in the meridional component of thesteering flows between the control and ozone experimentsis obvious after 54 h. In particular, the meridionalcomponent of the steering flows from the ozoneexperiment is greater than that from the control experimentduring 12–54 h, while less than that from thecontrol experiment after 54 h, resulting in the meridionaldifference of the track. The results from theother five groups of experiments(figures omitted)alsoconfirm that the improvement in the track predictionof Hurricane Earl is mainly due to the adjustment of the steering flows after the assimilation of AIRS ozonedata.
 |
| Fig. 9.(a)Zonal and (b)meridional components of the steering flows from the control and ozone experiments ofEarl0118 during the 72-h hindcast period. |
Defining the initial conditions for numerical predictionof a TC with few observations is challenging.This study applies the AIRS ozone data for numericalprediction of Hurricane Earl(2010). Based on the relationshipbetween total column ozone and mean PVas found in previous studies(Jang et al., 2003; Zou and Wu, 2005; Wu and Zou, 2008; Wang et al., 2012; Liu, 2014), a 4DVAR assimilation scheme at selectedmodel levels is adopted and implemented in MM5 tosimulate Hurricane Earl. Meanwhile, batch experimentsare conducted to show that this scheme couldbe useful for improved hurricane prediction. The resultsare summarized as follows.
(1)In order to assimilate AIRS ozone data, theobservation operator is established at the levels withhigh correlation coefficients between total columnozone and PV. Five levels with the highest correlationcoefficients between total column ozone and PVare selected from the model levels between 400 and 50hPa.
(2)Assimilation of AIRS ozone data improvesprediction of the hurricane track, and has some capabilityin reproducing the intensity and intensitychanges of the hurricane as the integration time increases.
(3)Ozone data assimilation affects PV first athigh level, and then the effect propogates to bothmiddle and low levels. Due to high spatial and temporalresolution of ozone data, mesoscale information inthe upper-level PV field is incorporated into the modelinitial condition. Through the so-called asymmetricpenetration flows associated with the upper-level PVanomaly, mesoscale disturbances occur at lower levels.The overall improved PV simulation leads to bettertrack and intensity prediction of Hurricane Earl.
(4)With the assimilation of AIRS ozone data, the warm core of Hurricane Earl is significantly intensified, resulting in improvement of other fields(suchas wind)near the hurricane center.
(5)The improvement in the track prediction ofHurricane Earl is mainly due to the adjustment of thesteering flows after the assimilation of AIRS ozonedata.
This study suggests that AIRS ozone data containvaluable meteorological information about theupper troposphere and could therefore be useful fornumerical prediction of TCs such as Hurricane Earl(2010). However, we realize that more case studiesare needed before drawing any general conclusion onthe performance of the ozone assimilation scheme.Additionally, there is room for further improvement of the ozone assimilation scheme. For example, thecombined assimilation of AIRS ozone data and bogusdata(Zou and Xiao, 2000; Park and Zou, 2004)mayfurther improve the initialization and forecast of TCs.
Acknowledgments. The authors are thankfulto Dr. Xiaoyu Chen for his enthusiastic and rigorouscomments on this paper. The comments from theanonymous reviewers are also appreciated.
| Aumann, H. H., M. T. Chahine, C. Gautier, et al., 2003: AIRS/AMSU/HSB on the Aqua mission: Design, science objectives, data products, and processing systems. IEEE Trans. Geosci. Remote Sens., 41, 253-264. |
| Bian, J. C., A. Gettelman, H. B. Chen, et al., 2007: Validation of satellite ozone profile retrievals using Beijing ozone sonde data. J. Geophys. Res., 112, D06305, doi: 10.1029/ 2006JD007502. |
| Bosart, L. F., 2003: Tropopause folding, upper-level fron-togenesis, and beyond.Meteor. Monogr., 31, 13-47. |
| Carsey, T. P., and H. E. Willoughby, 2005: Ozone mea-surements from eyewall transects of two Atlantic tropical cyclones. Mon. Wea. Rev., 133, 166-174. |
| Danielsen, E. F., 1968: Stratospheric-tropospheric ex-change based on radio activity, ozone, and potential vorticity. J. Atmos. Sci., 25, 502-518. |
| Davis, C., N. S. Low, M. A. Shapiro, et al., 1999: Di-rect retrieval of wind from Total Ozone Mapping Spectrometer (TOMS) data: Examples from FAS-TEX. Quart. J. Roy. Meteor. Soc., 125, 3375-3391. |
| Ding Weiyu, Wan Qilin, Zhang Chengzhong, et al., 2010: Assimilation of HIRS/3 brightness temperature in cloud condition and its impact on Typhoon Chanchu forecast. Acta Meteor. Sinica, 68, 70-78. (in Chi-nese) |
| Dong, K., and C. J. Neumann, 1983: On the relative mo-tion of binary tropical cyclones. Mon. Wea. Rev., 111, 945-953. |
| Durnford, D., J. Gyakum, and E. Atallah, 2009: The conversion of total column ozone data to numeri-cal weather prediction model initializing fields, with simulations of the 24-25 January 2000 East Coast snowstorm. Mon. Wea. Rev., 137, 161-188. |
| Grell, G. A., J. Dudhia, and D. R. Stauffer, 1994: A De-scription of the Fifth Generation Penn State/NCAR Mesoscale Model (MM5). NCAR Technical Note NCAR/TN-398+STR, 117 pp. |
| Holland, G. J., 1984: Tropical cyclone motion: A com-parison of theory and observation. J. Atmos. Sci., 41, 68-75. |
| Hood, L. L., and B. E. Soukharev, 2005: Interannual variations of total ozone at northern midlatitudes correlated with stratospheric EP flux and potential vorticity. J. Atmos. Sci., 62, 3724-3740. |
| Jang, K. I., X. Zou, M. S. F. V. De Pondeca, et al., 2003: Incorporating TOMS ozone measurements into the prediction of the Washington D. C. winter storm during 24-25 January 2000. J. Appl. Meteor., 42, 797-812. |
| Le Marshall, J. F., L. M. Leslie, Jr. R. F. Abbey, et al., 2002: Tropical cyclone track and intensity pre-diction: The generation and assimilation of high-density, satellite-derived data. Meteor. Atmos. Phys., 80, 43-57. |
| Li Jun and Fang Zongyi, 2012: The development of satellite meteorology—Challenges and opportuni-ties. Meteor. Mon., 38, 129-146. (in Chinese) |
| Liu Yin, 2014: Quality control of FY-3A total column ozone and its application in typhoons Tembin (2012) and Isaac (2012). Chinese J. Atmos. Sci., 38, 1066- 1078. (in Chinese) |
| Monahan, K. P., L. L. Pan, A. J. McDonald, et al., 2007: Validation of AIRS v4 ozone profiles in the UTLS using ozonesondes from Lauder, NZ and Boul-der, USA. J. Geophys. Res., 112, D17304, doi: 10.1029/2006JD008181. |
| Normand, C., 1953: Atmospheric ozone and the upper-air conditions. Quart. J. Roy. Meteor. Soc., 79, 39-50. |
| Ohring, G., and H. S. Muench, 1960: Relationships be-tween ozone and meteorological parameters in the lower stratosphere. J. Atmos. Sci., 17, 195-206. |
| Pan, L. L., K. P. Bowman, M. Shapiro, et al., 2007: Chemical behavior of the tropopause observed dur-ing the Stratosphere-Troposphere Analyses of Re-gional Transport Experiment. J. Geophys. Res., 112, D18110, doi: 10.1029/2007JD008645. |
| Park, K., and X. Zou, 2004: Toward developing an objec-tive 4DVAR BDA scheme for hurricane initialization based on TPC observed parameters. Mon. Wea. Rev., 132, 2054-2069. |
| Pittman, J. V., L. L. Pan, J. C. Wei, et al., 2009: Evalua-tion of AIRS, IASI, and OMI ozone profile retrievals in the extratropical tropopause region using in-situ aircraft measurements. J. Geophys. Res., 114, D24109, doi: 10.1029/2009JD012493. |
| Rodgers, E. B., J. Stout, J. Steranka, et al., 1990: Trop-ical cyclone-upper atmospheric interaction as in-ferred from satellite total ozone observations. J. Appl. Meteor., 29, 934-954. |
| Shapiro, M. A., A. J. Krueger, and P. J. Kennedy, 1982: Nowcasting the position and intensity of jet streams using a satellite-borne total ozone mapping spec-trometer. Nowcasting. Academic Press, San Diego, 137-145. |
| Stout, J., and E. B. Rodgers, 1992: Nimbus-7 total ozone observations of western North Pacific tropical cy-clones. J. Appl. Meteor., 31, 758-783. |
| Tian, B., Y. L. Yung, D. E. Waliser, et al., 2007: In-traseasonal variations of the tropical total ozone and their connection to the Madden-Julian Os-cillation. Geophys. Res. Lett., 34, L08704, doi: 10.1029/2007GL029451. |
| Velden, C. S., and L. M. Leslie, 1991: The basic rela-tionship between tropical cyclone intensity and the depth of the environmental steering layer in the Australian region. Wea. Forecasting, 6, 244-253. |
| Wang Bin, R. L. Elsberry, Wang Yuqing, et al., 1998: Dynamics in tropical cyclone motion: A review. Chinese J. Atmos. Sci., 22, 535-547. (in Chinese) |
| Wang, H., X. Zou, and G. Li, 2012: An improved quality control for AIRS total column ozone observations within and around hurricanes. J. Atmos. Oceanic Technol., 29, 417-432. |
| Wang Yunfeng, Wang Bin, Fei Jianfang, et al., 2013: The effects of assimilating satellite brightness tempera-ture and bogus data on the simulation of Typhoon Kalmaegi (2008). Acta Meteor. Sinica, 27, 415-434. |
| Wu, L. G., and B. Wang, 2000: A potential vorticity tendency diagnostic approach for tropical cyclone motion. Mon. Wea. Rev., 128, 1899-1911. |
| Wu, T. C., H. Liu, S. J. Majumdar, et al., 2014: Influence of assimilating satellite-derived atmospheric motion vector observations on numerical analyses and fore-casts of tropical cyclone track and intensity. Mon. Wea. Rev., 142, 49-71. |
| Wu, Y., and X. Zou, 2008: Numerical test of a simple approach for using TOMS total ozone data in hur-ricane environment. Quart. J. Roy. Meteor. Soc., 134, 1397-1408. |
| Xue Jishan, 2009: Scientific issues and perspective of assimilation of meteorological satellite data. Acta Meteor. Sinica, 67, 903-911. (in Chinese) |
| Yan Wei, Han Ding, Zhou Xiaoke, et al., 2013: Analysing the structure characteristics of tropical cyclones based on CloudSat satellite data. Chinese J. Geo-phys., 56, 1809-1824. (in Chinese) |
| Zou, X., F. Vandenberghe, M. Pondeca, et al., 1997: Introduction to Adjoint Techniques and the MM5 Adjoint Modelling System. NCAR Technical Note, NCAR/TN-435-STR, 117 pp. |
| Zou, X., and Q. Xiao, 2000: Studies on the initialization and simulation of a mature hurricane using a vari-ational bogus data assimilation scheme. J. Atmos. Sci., 57, 836-860. |
| Zou, X., and Y. H. Wu, 2005: On the relationship between Total Ozone Mapping Spectrometer (TOMS) ozone and hurricanes. J. Geophys. Res., 110, D06109, doi: 10.1029/ 2004JD005019. |