 2015, Vol. 28
The Chinese Meteorological Society
Article Information
- MA Xinye, ZHANG Yaocun. 2015.
- Numerical Study of the Impacts of Urban Expansion on Meiyu Precipitation over Eastern China
- J. Meteor. Res., 28(2): 237-256
- http://dx.doi.org/10.1007/s13351-015-4063-5
Article History
- Received May 21, 2014
- in final form October 13, 2014


Urbanization, as an extreme case in terms of l and use/l and cover(LULC)change, modifies albedo, emissivity, and thermal conductivity of the l and surface.Urban regions have a larger heat-storage capacity, Bowen ratio, and an increased surface roughness incomparison with rural regions(Oke, 1982). These differenceslead to changes in the exchange of energy, momentum, and moisture, ultimately affecting the regionalclimate(Charney et al., 1977; Chase et al., 1996; Stohlgren et al., 1998; Eastman et al., 2001;Foley et al., 2005; Lin et al., 2007; Feng et al., 2012).Therefore, urbanization and climate change are becomingincreasingly interconnected(Seto and Shepherd, 2009).
The variation in precipitation is an important indicatorfor climate change, so proper assessments ofthe urban environmental impacts on precipitation arebecoming increasingly important(Shepherd, 2005). Inrecent years, some researchers have used observationaldata and numerical models to study the local impactsof urbanization on precipitation. For instance, Shepherd et al.(2002)found that the monthly meanrainfall could increase by 28% over the region 30–60km downwind of a metropolis. Similarly, Mote et al.(2007)pointed out that areas to western Atlanta receive30% less rainfall than eastern Atlanta as a resultof urbanization effects. Also, Chen et al.(2007)foundthat urbanization in Taipei could be a contributor tothe 67% increase in the frequency of afternoon thunderstorms and the 77% increase in rainfall. Zhang et al.(2009)suggested that the rapid urban expansionthat has taken place in Beijing since 1981 is statisticallycorrelated to a summer rainfall reduction in thenortheastern areas of the city from 1981 to 2005. Byanalyzing model results, Shepherd et al.(2010)foundthat simulations that included a representation of urbanareas, in comparison to those without, producedmore cumulative rainfall over the region to the westnorthwestof Houston. Based on the results from 10-summer and 1-km resolution WRF(Weather Research and Forecasting)nested model simulations for the period2000–2009, Yang et al.(2012)found a largerprecipitation frequency over urban areas in Nanjing(eastern China) and a significant enhancement of precipitationin the downwind region of the city in theafternoon.
However, all of the above-mentioned studies focusedon the urbanization effects on local precipitation, while the impacts of urbanization on precipitationon regional or larger scales have received far lessattention. In fact, the urbanization effects on precipitationdepend on the climate regime and geographicallocations of cities(Zhang et al., 2009). Some studieshave suggested that urbanization has significant effectson atmospheric circulation, convection, and regionalprecipitation amounts and patterns. For example, Kishtawal et al.(2010)found that the frequency ofheavy rainfall has been increasing in urban regions ofIndia during the monsoon season. Meanwhile, by employingnested high-resolution WRF modeling, Wanget al.(2012)found that urbanization reduces the rainfallamount over urban areas, mainly in summer, and changes the regional precipitation pattern to a certainextent. Also, by simulating a summertime rainstormprocess with/without the presence of urban areas inthe Yangtze River Delta(YRD), Wan et al.(2013)found that the increases in precipitation mainly occurdownwind of the city belt, and that the increases and decreases in precipitation are represented as adjacentbelts to the main precipitation belt.
The YRD economic belt is one of the most urbanized and developed areas in China. Several studieshave found that urbanization over the YRD has ledto increases in local and regional surface air temperature temperature(Du et al., 2007; Yang et al., 2011; Wu and Yang, 2013) and modifications to regional-scale precipitation(Zhang et al., 2010; Sang et al., 2013). In recent years, the YRD has maintained its rapid urban expansion(Zhang et al., 2010). However, few studies have beencarried out looking at the impacts of the urban expansionof this region on regional-scale precipitation.
Meiyu is a unique rainy season over East Asiathat takes place during the northward progression ofthe East Asian summer monsoon(EASM)from latespring to mid summer(Si et al., 2009). In China, Meiyu is a dominant climate phenomenon over theYangtze-Huaihe River basin between mid June and mid July, and has been intensively studied(Gong and Ho, 2002; Wei and Xie, 2005; Zong et al., 2006; Ding et al., 2007; Bueh et al., 2008; Huang et al., 2011; Wu and Zhang, 2012). Recent studies show an increasingtrend of Meiyu precipitation over the Huaihe Riverbasin and a relative decreasing trend over the YangtzeRiver basin since the late 1990s. For instance, severefloods occurred over the Huaihe River basin in 2003, 2005, and 2007(Zhao et al., 2007; Zhang et al., 2008), suggesting that the great east-west thermal gradientassociated with vegetation biophysical processes maycontribute to the abrupt northward jump of the Meiyubelt(Xue et al., 2004). Also, Si et al.(2009)foundthat the Meiyu belt of China experienced a decadalnorthward shift in the late 1990s, as a result of a distinctivetropospheric warming and stratospheric coolingtrend in the midlatitudes over East Asia. In addition, Liu et al.(2012)suggested that a strengtheningof the EASM since the 1990s, linked to the interdecadalchange of l and -sea thermal contrast, has led tothe northward-moving rainb and s and excessive rainfallover the Huaihe River basin.
Against this background of climate change, urbanexpansion in the YRD, which is located in theYangtze-Huaihe River basin, may also contribute tochanges in precipitation during the Meiyu season.Therefore, the primary goal of the present reportedresearch was to identify and quantify the impacts ofurban expansion in the YRD on precipitation and atmosphericcirculation during the Meiyu period, and investigatethe possible underlying physical mechanisms.
The remainder of the paper is organized as follows.A description of the data and methods used inthe study is given in Section 2. In Section 3, the model and numerical experiment designs are described. Avalidation of the model results and analyses of the impactsof urban expansion on Meiyu precipitation, surfaceenergy balance, and circulation are presented inSection 4. Concluding remarks are provided in Section 5.
2. Data and methods 2.1 DataThere are five kinds of datasets used in thisstudy(Table 1):(1)observed precipitation data;(2)MODIS(Moderate-resolution Imaging Spectroradiometer)LULC category data;(3)DMSP-OLS(the U.S. Air Force Defense Meteorological SatelliteProgram’s Operational Linescan System)nighttimelight image;(4)NCEP operational global final(FNL)analysis data; and (5)NCEP RTG−SST(real-time, global, sea surface temperature)data. A more detaileddescription of these data is provided as follows.
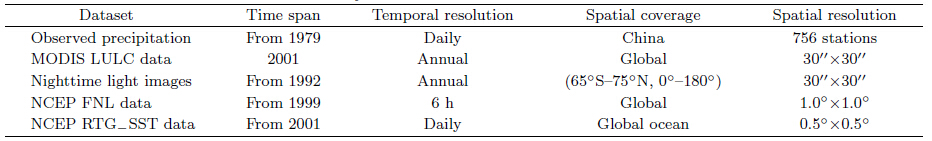
(1)The observed precipitation data used for validationof the simulated Meiyu precipitation and EOF(empirical orthogonal function)analysis in this studyare the daily rainfall amounts from 756 stations inChina. The measurement method for these precipitationdata remained unchanged from 1979 to 2010.The data are of good quality and evenly distributedspatially(Ren et al., 2008).
(2)The MODIS LULC category data(http://duckwater.bu.edu/lc/mod12q1.html)are created usinginformation collected by the Earth ObservationSystem(EOS)for 2001(hereafter MODIS-2001) and on a 30 arc-seconds resolution grid, covering the globalsurface. It should be noted that the MODIS-2001 datacontain the urban extents in 2001. In this study, the MODIS-2001 data serve as the LULC category datafor the WRF model.
(3)The nighttime light images(http://ngdc.noaa.gov/eog/dmsp/downloadV4composites.html)are agroup of urban remote sensing products derived fromDMSP-OLS with specialized low-light imaging capabilities.The DMSP nighttime light images have provideda continuous time series of urban remote sensingproducts every year since 1992 and are mapped onto30 arc-seconds resolution grid, spanning from 65°S to75°N and 0 to 180°. In this work, the nighttime lightimages for 2010 are used to derive the urban extentsover the YRD in 2010.
(4)The NCEP FNL analysis data(http://rda.ucar.edu/datasets/ds083.2/)are created by the GlobalData Assimilation System(GDAS), which continuouslycollects observational data and other analysisdata. The FNL data are on a 1.0°×1.0° resolutiongrid, and available at the surface and 26 pressure levelsfrom 1000 to 10 hPa every 6 h from July 1999.The FNL data provide the initial and lateral boundaryconditions for the large-scale atmospheric fields and initial soil parameters(i.e., soil water, moisture, and temperature)in the WRF simulations.
(5)The NCEP RTG−SST data(http://polar.ncep.noaa.gov/sst/rtg−low−res/), provided by the NCEP/MMAB(Marine Modeling and Analysis Branch), arecreated using the most recent 24-h buoy and ship data, satellite-retrieved SST data, and satellite-observedsea-ice coverage SST data. The RTG−SST data areon a 0.5°×0.5° resolution grid, and are prepared dailyfrom January 2001. In this research, the RTG−SSTdata provide the sea surface temperature for the WRFmodel.
2.2 EOF analysis
To investigate the actual precipitation variation during the Meiyu period, an EOF analysis for observedprecipitation over eastern China was performed. Inthe current research, a total of 173 out of 756 stationsover eastern China(23.5°–38.5°N, 113°–123°E)wereused. The observed daily precipitation data were conductedto the pentad anomaly data before the EOFanalysis was carried out. In order to compare theMeiyu precipitation variation during 2001–2010 withthe year before 2001, and also considering the notabledecadal transition of the EASM and correspondingprecipitation change over eastern China at the end ofthe 1970s(Wang, 2001; Yu et al., 2004; Jiang and Wang, 2005; Chen and Xue, 2013), the period for theEOF analysis was selected as 1979 to 2010.
2.3 Mapping the MODIS-2010 dataIn order to investigate the impacts of urban expansionon precipitation during the Meiyu season, MODIS LULC category data providing a realisticimpression of urban expansion are required. TheMODIS-2001 data, which contain the urban extents in2001, serve as the underlying surface LULC categorydata in the WRF model. However, MODIS LULCdata that include the urban extents for 2010 are absent.Therefore, we had to derive the urban distributionfor 2010 from another data source. Nighttimelight images have been widely used as a proxy for variablesthat are difficult to measure directly(Elvidge et al., 2013), such as population(Doll, 2008), economicactivity(Ghosh et al., 2010), and urban extent(Small et al., 2005; He et al., 2006; Yang et al., 2011). Generallyspeaking, regions with large nighttime light valuesare most likely representative of an urban area. He etal.(2006)developed a technique for efficiently and quickly deriving urban l and information from DMSPOLSnighttime light images. One of the most importantfoundations of the approach is that the area of urbanextents(i.e., the regions where the nighttime lightvalue is larger than the urban nighttime light threshold)derived from the nighttime light image should becloser or equal to the “true” urban area from statisticaldata, such as the China L and and Resources StatisticalYearbook(He et al., 2006). Therefore, this methodcan largely reflect the quantitative characteristics ofurban areas. Table 2 shows the urban nighttime light thresholds for deriving the urban extents in 2010 overShanghai, Jiangsu, and Zhejiang.

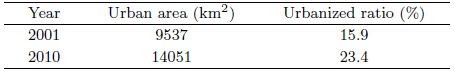
The urban l and information was firstly removedover the YRD within the MODIS-2001 LULC data, and then the urban distribution for 2010 derived fromthe nighttime light image was mapped to the same regionof MODIS-2001, ultimately deriving the MODISLULC category for 2010(hereafter MODIS-2010).Figure 1 shows the distribution of the MODIS-2001 and MODIS-2010 LULC categories over the YRD. Table 3 indicates that the urban area in the YRD in 2001was 9537 km2 and accounted for 15.9% of the totall and area, while the urban area was 14051 km2 and accounted for 23.4% of the total l and area in 2010.The urban expansion over the YRD during 2001–2010is clear.
 |
| Fig. 1. Distribution of MODIS LULC categories in(a)2001 and (b)2010 for the YRD. |
 |
The regional meteorological model used in thisstudy is the WRF version 3.3.1 with the AdvancedResearch WRF(ARW)dynamics solver(Skamarock et al., 2008). WRF is a fully compressible and Eulernonhydrostatic model with multiple options for physicalparameterization, which can be applied for simulationsacross scales ranging from large-eddy to global(Zhang et al., 2011). Table 4 shows the parameterizationschemes selected for the model physical processesin the simulation. A more detailed presentation of thisinformation is provided as follows.
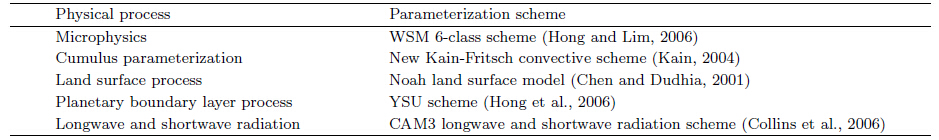
The WRF single-moment six-class(WSM6)microphysicsscheme(Hong and Lim, 2006) and new Kain-Fritsch convective parameterization scheme(Kain, 2004)were selected for simulating the precipitationprocess in current study. The WSM6 schemecontains six prognostic water substance variables, i.e., the mixing ratios of water vapor, rain, snow, graupel, cloud ice, and cloud water. The new Kain-Fritschscheme utilizes a cloud model which contains the effects of detrainment, entrainment, and relatively simplemicrophysics.
The unified Noah l and surface model(LSM)(Chen and Dudhia, 2001)was selected for the l and surface process. The Noah LSM consists of one canopylayer and four soil layers with depths of 10, 30, 60, and 100 cm. It can predict skin temperature and moisture, which is important in regional climate simulation, asmoisture feedback plays an important role in air-l and surface interaction(Bukovsky and Karoly, 2009).
The Yonsei University(YSU)planetary boundarylayer(PBL)scheme(Hong et al., 2006)was usedto represent the boundary layer and sub-grid scale processes.The YSU scheme uses countergradient terms to represent fluxes due to both local and nonlocal gradients.It consists of an enhanced stable boundarylayer diffusion algorithm that allows deeper mixing inwindier conditions.
In addition, the atmospheric long- and shortwaveradiation was calculated every 30 minutes usingthe NCAR Community Atmosphere Model(CAM3.0)spectral b and longwave and shortwave radiationscheme(Collins et al., 2006).
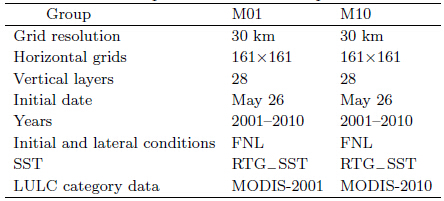
3.2 Numerical experiment designTwo groups of long-term simulations usingMODIS-2001 and MODIS-2010 LULC category datawere performed(hereafter referred to as experimentM01 and M10, respectively). Each group covered 10summers from 2001 to 2010, and each summer was initializedon 26 May. The first 6 days(26–31 May)ofeach simulation were used as the model spin-up periodto minimize the initialization effects of soil moisture and soil temperature. As shown in Table 5, both groups used the 30-km horizontal grid resolution and 28 terrain-following vertical layers. The model domainconsisted of 161(west–east)×161(south–north)gridpoints and was centered at 30.5°N, 115°E, coveringEast Asia and its adjacent oceans. The FNL dataprovided initial and lateral boundary conditions forthe simulation and RTG−SST data served as the seasurface temperature because updating SST is importantfor improving precipitation simulations as a resultof more realistic depiction of wind and moisture flux(Bukovsky and Karoly, 2009).
The capability of the WRF model in simulating the climate over eastern China in the Meiyu seasonis first evaluated by comparing the precipitation, airtemperature, and pseudo-equivalent temperature producedby experiment M10 with the observed and analysisdata. The observed precipitation and 2-m airtemperature are obtained from 756 meteorological stationsin China, and the isobaric surface temperature and pseudo-equivalent temperature are provided bythe NCEP FNL data. In the current study, the Meiyuseason is from the third pentad in June to the fourthpentad in July.
Figure 2 presents the observed and WRFsimulated10-yr climatic precipitation during theMeiyu period. As shown in Fig. 2a, the observed precipitationexhibits a spatial distribution pattern withmore precipitation in the southeast of eastern China(> 8 mm day−1) and less precipitation over regions tothe north of 36°N(< 3.5 mm day−1). We find that theWRF model captures well both the magnitude and geographicaldistribution of observed precipitation overmost parts of eastern China(Fig. 2b). A major differencebetween the WRF-simulated and observed precipitation(Fig. 2c)is that the WRF model tends tosimulate more(less)rainfall than is actually the case over the southeast(northwest)parts of eastern China.In addition, we also find that this difference betweenthe WRF-simulated and observed precipitation is notsignificant over most parts of eastern China, exceptover western Sh and ong and regions to the south ofJiangxi, Fujian, and Zhejiang provinces.  |
| Fig. 2.(a)Observed and (b)WRF-simulated climatological precipitation during the 2001–2010 Meiyu seasons, and (c)the difference between the two. Black grids denote regions where the difference is statistically significant at the 99%confidence level. |
Figure 3 presents the st and ard deviation of observed and WRF-simulated precipitation during the2001–2010 Meiyu seasons. We can see that the spatialpattern of the st and ard deviation of observed precipitation(Fig. 3a)is similar to the pattern of climaticprecipitation(Fig. 2a). A major difference in thepattern between the st and ard deviation and climaticprecipitation is that there are two large-value centerslocated over the Yangtze-Huaihe River basin and regionsbetween Jiangxi and Fujian. As shown in Fig. 3b, the WRF model is able to reproduce the dominantfeatures of the st and ard deviation of precipitation duringthe Meiyu period. However, the st and ard deviationof the simulated precipitation is smaller than thatof the observation over southern Sh and ong, northernJiangsu, and southern Jiangxi, but larger over otherregions of eastern China(Fig. 3c). It is also notedthat the difference in the st and ard deviation between the WRF-simulated and observed precipitation is notsignificant over eastern China.
 |
| Fig. 3. Distributions of st and ard deviation of(a)observed and (b)WRF-simulated precipitation during the 2001–2010Meiyu seasons, and (c)the difference between the two. |
Figure 4a shows the time series of the observed and WRF-simulated 10-yr(2001–2010)climatologicalpentad precipitation regionally averaged over theYangtze-Huaihe River basin(28°–35°N, 110°–120°E;Huang et al., 2011). We can see that the observedprecipitation increases from June to July and thereare two precipitation peaks in the second(8.4 mmday−1) and fifth(7.4 mm day−1)pentads in July, afterwhich the precipitation decreases. It is clear that theWRF model is able to simulate well the dominant featuresof the temporal variation of precipitation in theMeiyu season. The correlation coefficient between theobserved and simulated precipitation is 0.85, which isstatistically significant at the 99% confidence level.
 |
| Fig. 4. Time series of(a)observed and WRF-simulated10-yr(2001–2010)climatological pentad precipitation and (b)2-m air temperature regionally averaged over theYangtze-Huaihe River basin(28°–35°N, 110°–120°E)(std:st and ard deviation; r: correlation coefficient; α: correlationcoefficient at the 99% confidence level). |
Figure 4b shows the time series of the observed and WRF-simulated 10-yr climatological pentad 2-mair temperature regionally averaged over the Yangtze-Huaihe River basin. We can see that the observed 2-mair temperature increases rapidly from the first pentadin June to the first pentad in July, after which itincreases slowly to the sixth pentad in July. We canalso see that the 2-m temperature possesses a decreas-ing trend in the second and fifth pentads in July, asa result of more precipitation in these two pentads.The WRF model reproduces well the characteristicsof the temporal variation of the 2-m air temperature in the Meiyu season. The correlation coefficient betweenthe observed and simulated 2-m temperature is0.96, which is statistically significant at the 99% confidencelevel.
Since the gradient of the pseudo-equivalent temperaturecan indicate the position of the Meiyu front and heavy precipitation belt, it is important to evaluatethe capability of the WRF model in simulating thedistribution and magnitude of the pseudo-equivalenttemperature. Figure 5 shows the height-latitude crosssectionof the FNL analysis and WRF-simulated airtemperature and pseudo-equivalent temperature averagedalong 105°–125°E. As shown in Fig. 5a, the largepseudo-equivalent temperature gradient belt extendsfrom the surface to 700 hPa over the regions between28° and 36°N and a warm air column is located tothe south of the large pseudo-equivalent temperaturegradient belt. It is clearly shown in Fig. 5b that theWRF model simulates well the air temperature and pseudo-equivalent temperature distribution with closemagnitudes. Moreover, theWRF model can reproducethe large pseudo-equivalent temperature gradient belt and the warm air column.
 |
| Fig. 5. Height-latitude cross-sections of the 10-yr(2001–2010)climatological air temperature(℃; thin line) and pseudoequivalenttemperature(K; thick line)averaged along 105°–125°E in the Meiyu season from(a)FNL analysis data and (b)WRF-simulated data. The black shading indicates the terrain. |
Overall, the WRF model exhibits good ability inreproducing the major features of the climate overeastern China during the Meiyu period. This gives us confidence to use the model’s output to study theimpacts of urban expansion on the precipitation in theMeiyu season.
4.2 Impacts of urban expansion on Meiyu precipitationA previous study indicated that the enhancedconvergence due to increased surface roughness and destabilization due to the urban heat isl and (UHI)perturbation of the planetary boundary layer in urbanareas lead to regional precipitation change(Wang et al., 2012). It is therefore reasonable to hypothesizethat urban expansion modifies the roughness and thermal conductivity of the original l and surface, and may also cause regional precipitation change. Figure 6 shows the changes in total, cumulus, and grid-scaleprecipitation(difference between M10 and M01)duringthe Meiyu period induced by urban expansion inthe YRD averaged over 2001–2010. It is clear that theurban expansion results in a decrease(increase)of totalprecipitation over the regions to the north of 35°N and the Yangtze River basin(Huaihe River basin and the south of 28°N)with an intensity of 0.2–1.2 mmday−1(Fig. 6a). As shown in Fig. 6b, the patternof cumulus precipitation change induced by urban expansionis similar to that of total precipitation changeover most parts of eastern China except the YRD and western Sh and ong, which indicates that the change ofcumulus precipitation contributes to the total precipitationchange. In addition, it is found that the gridscaleprecipitation change also contributes to the totalprecipitation change(Fig. 6c).
 |
| Fig. 6. Changes in(a)total, (b)cumulus, and (c)grid-scale precipitation(difference between M10 and M01)inducedby urban expansion in the YRD and averaged during the 2001–2010 Meiyu periods. Black grids denote those regionswhere the change of precipitation is statistically significant at the 90% confidence level. |
To investigate the relationship between the impactsof urban expansion and the actual precipitationchange during the Meiyu period, an EOF analysis forobserved precipitation over eastern China was performed.Figure 7 shows the first three leading EOFmodes and the corresponding time series of the principalcomponents(PCs)of the observed pentad precipitationover eastern China during the 1979–2010Meiyu seasons. The first three leading EOF modes explain19.06%, 17.79%, and 8.17% of the total variance, respectively. Figure 7a shows that the spatial distributionof EOF-1 is characterized by a “+, –” pattern, with the latitude of 30°N as the division. Meanwhile, PC-1(Fig. 7d)indicates that the Meiyu precipitationincreases(decreases)over the regions to the north of30°N but decreases(increases)over the regions to thesouth of 30°N from the end of the 1970s to the early1990s and from the early 1990s to the early 2000s.The spatial distribution of EOF-2(Fig. 7b)is characterizedby a “–, +, –” pattern over eastern China, and PC-2(Fig. 7e)implies that the Meiyu precipitationover the regions between 26° and 34°N(regionsto the north of 34°N and to the south of 26°N)increases(decreases)from the end of the 1970s tothe end of the 1990s but decreases(increases)in the2000s. Different from the first two leading modes, theEOF-3(Fig. 7c) and PC-3(Fig. 7f)indicate thatthe Meiyu precipitation increases(decreases)over theHuaihe River basin(30°–34°N) and the south of 27°N(Yangtze River basin(27°–30°N) and north of 34°N)since the mid 1990s. It can be seen that the Meiyubelt has a decadal northward-moving trend after theearly 2000s. Previous studies have suggested that thepossible mechanisms underlying the Meiyu belt northwardmovement are:(1)a tropospheric warming and stratospheric cooling trend in the midlatitudes of EastAsia(Si et al., 2009), and (2)the interdecadal changeof l and -sea thermal contrast in East Asia(Liu et al., 2012).
 |
| Fig. 7.(a, b, c)The first three leading EOF modes and (d, e, f)corresponding time series of the anomaly principalcomponents(PCs)of the observed pentad precipitation at 173 stations over eastern China during the 1979–2010 Meiyuseasons. |
In addition, it is noted that both the spatial distribution and magnitude of EOF-3(Fig. 7c)are consistentwith the total precipitation change(Fig. 6a). Tofurther investigate the relationship between the EOF-3 and simulated precipitation change induced by urbanexpansion, the simulated pentad total, cumulus, and grid-scale precipitation changes(M10 minus M01)during the 2001–2010 Meiyu seasons are projectedonto the spatial pattern of the EOF-3, deriving threegroups of time series(Figs. 8a–c). We can see thatthe time series of the projection of the simulatedpentad total, cumulus, and grid-scale precipitationchanges are consistent with the PC-3 since 2005, becausethe actual urban expansion over the YRD revealedby MODIS-2001 and MODIS-2010 occurs after2005. Moreover, the simulated pentad total, cumulus, and grid-scale precipitation changes during the2001–2010 Meiyu seasons are projected onto the spatialpatterns of the first six leading EOF modes, and the correlation coefficients between the time series ofthe projection and observed PCs during 2005–2010 arecalculated for each mode(Figs. 8d–f). We find thatthe correlation coefficient between the projection series of total precipitation change and the PC-3 is positive and the magnitude(0.33; statistically significant at the95% confidence level)is the largest(Fig. 8d). Similarresults are found for the cumulus and grid-scale precipitationchanges(Figs. 8e and 8f). Overall, it canbe concluded that the spatiotemporal pattern of theEOF-3 mode of observed precipitation is related to theurban expansion in the YRD.
 |
| Fig. 8. Time series of the observed PC-3 and projection of the pentad-simulated(a)total, (b)cumulus, and (c)grid-scale precipitation changes(M10 minus M01)onto the EOF-3. The correlation coefficients calculated between theprojection time series of the pentad-simulated(d)total, (e)cumulus, and (f)grid-scale precipitation changes onto theEOFs and observed PCs during 2005–2010 for the first six leading EOF modes are also presented. The black column in(d)denotes correlation statistically significant at the 95% confidence level. |
To investigate the reason for the Meiyu precipitationchange, the impacts of urban expansion on airhumidity, surface evaporation, and atmospheric circulationare examined. Figure 9a shows that the 10-yr(2001–2010)climatological tropospheric(950–400hPa)air humidity increases from north to south overeastern China. This pattern leads to more precipitationin the southeast of eastern China and less precipitationover regions to the north of 36°N(Fig. 2).Further analysis indicates that the spatial pattern ofthe tropospheric air humidity change induced by urbanexpansion(Fig. 9b)with the intensity increased(decreased)over the regions of 31°–36°N and to the southof 27°N(north of 36°N and (27°–31°N, 114°–119°E)), corresponds well to that of cumulus(Fig. 6b) and gridscale(Fig. 6c)precipitation changes during the Meiyuperiod over most parts of eastern China. Therefore, the implication, is that the changed tropospheric airhumidity is a major reason for the Meiyu precipitationchange, which is induced by urban expansion. However, we also find that the tropospheric air humidityincreases over the YRD while the grid-scale precipitationdecreases over the same region, which indicatesthat the grid-scale precipitation over the YRD is affectedby other factors.
 |
| Fig. 9. Distributions of the 10-yr(2001–2010)(a)climatological(M01)tropospheric(950–400 hPa)specific humidity and (b)change of tropospheric specific humidity induced by urban expansion(M10 minus M01)over eastern Chinaduring the Meiyu season. |
Urban expansion can change the level of evaporationby modifying surface physical properties. Figure 10 shows the 10-yr climatological surface evaporation and its change induced by urban expansion. As shownin Fig. 10a, surface evaporation also increases fromnorth to south over eastern China and a high-valuecenter is located at 27°N over l and . We find that urbanexpansion over the YRD results in an increase(decrease)of surface evaporation over the regions between32° and 36°N, as well as in Zhejiang and Fujianprovinces(regions between 30° and 32°N, as well asJiangxi and Sh and ong provinces)over eastern China(Fig. 10b). Moreover, it is noted that surface evaporationover the YRD is significantly reduced at the 90%confidence level, which leads to decreased grid-scaleprecipitation during the Meiyu period over the YRD(Fig. 6c), ultimately causing the decreasing trend oftotal precipitation(Fig. 6a).
 |
| Fig. 10. As in Fig. 9, but for surface evaporation. Black grids denote those regions where the change is statisticallysignificant at the 90% confidence level. |
Because vertical motion is one of the most importantfactors affecting precipitation, the impact of urban expansion on atmospheric vertical velocity isalso analyzed. Figure 11 shows the spatial distributionof climatological tropospheric vertical velocity and thechange of tropospheric vertical velocity induced by urbanexpansion. We find that the climatological upwardmotion(Fig. 11a; negative values)over the regionsto the south of 35°N causes more precipitationduring the Meiyu period(Fig. 2). As shown in Fig. 11b, the change in tropospheric vertical velocity inducedby urban expansion reveals a pattern with an increased(decreased)trend over the Yangtze River basin and the region north of 35°N(Huaihe River basin and the region south of 28°N), indicating that anomalousdownward(upward)motion occurs over correspondingregions and leads to decreased(increased)simulatedprecipitation change over the Yangtze River basin and the region north of 35°N(Huaihe River basin and theregion south of 28°N).
 |
| Fig. 11. As in Fig. 9, but for tropospheric(950–400 hPa)vertical velocity. Negative values denote upward motion and positive values downward motion. |
To study the reason for the changes in troposphericair humidity and vertical motion, the impacts of urban expansion on atmospheric circulation and moisture transport should also be analyzed. Figure 12shows distributions of climatological moisture transport and its divergence, and their changes induced byurban expansion. As shown in Fig. 12a, southwest(northwest)wind and moisture transport can be foundover eastern China and its adjacent sea to the south(north)of 32°N. The implication is that the convergence(divergence)of circulation and moisture transportlocated between 28° and 33°N(regions to thenorth of 34°N)lead to more(less)air humidity(Fig. 9a) and upward(downward)vertical motion(Fig. 11a)over the corresponding regions. Moreover, the urbanexpansion over the YRD causes the horizontal circulation and moisture transport to change, as shown inFig. 12b. It is noted that an anomalous anticyclonelocates over the East China Sea, while an anomalouscyclone locates to the east of Taiwan. This anomalouscirculation pattern leads to the convergence(divergence)of horizontal circulation and moisture transport over the regions to the north of 32°N and to thesouth of 28°N(regions between 28° and 32°N), ultimatelycausing the changes of vertical motion(Fig. 11b) and air humidity(Fig. 9b).
 |
| Fig. 12. As in Fig. 9, but for tropospheric(950–400 hPa)moisture transport(vectors) and divergence of moisture(shading). Negative values denote convergence of moisture and positive values divergence of moisture. |
To further investigate the reason for the change ofatmospheric circulation, the changes of surface energybalance and temperature are studied. As described bySu(2002), the surface energy balance can be writtenas
where Rn and G0 are surface net radiation and soilheat flux, respectively, defined as positive in the downwardsdirection; H and λE are the surface sensible and latent heat fluxes, respectively; λ is the latent heat ofvaporization and E is the actual evapotranspiration.H and λE are defined as positive in the upwards direction.The equation to calculate the surface net radiationiswhere α is the surface albedo, Rswd is the downwardsolar radiation, Rlwd is the downward longwave radiation, ε is the emissivity of the surface, σ is theStenfan-Bolzmann constant, and Tskin is the surfaceskin temperature. Rswd and Rlwd are both defined aspositive in the downwards direction. It can be derivedfrom Eqs.(1) and (2)bywhere Ein denotes the surface net incoming energy and Rup denotes the surface upward longwave radiation.In long-term simulations, the surface net incoming energyEin should equal the surface upward longwaveradiation Rup.


As shown in Fig. 13a, the urban expansion overthe YRD results in increased surface incoming energyover most parts of eastern China, especially in theYRD and western Sh and ong where the increased surfaceincoming energy has an intensity of greater than2 W m−2. As a result of the increased surface incomingnet energy, the skin temperature also increases over most parts of eastern China, and the increase in intensityis greater than 0.4 in the YRD and western Sh and ong(Fig. 13c). Because the surface upward longwaveradiation is positively correlated with skin temperature(Eq.(4)), the spatial pattern of the changed surfaceupward longwave radiation(Fig. 13b)induced byurban expansion is closer to that of skin temperature, and this leads to the surface energy reaching a new balancedstatus. Affected by the skin temperature, the2-m air temperature also increases over most parts ofeastern China(Fig. 13d). Therefore, the implicationis that the urban expansion in the YRD strengthensthe l and -sea thermal contrast over eastern China and the adjacent sea, which further causes changes in atmosphericcirculation and moisture transport.
 |
| Fig. 13. Changes in(a)surface net incoming energy, (b)upward longwave radiation, (c)skin temperature, and (d)2-mair temperature induced by urban expansion in the YRD during the 2001–2010 Meiyu seasons. Black grids denote thoseareas in which the change is statistically significant at the 90% confidence level. |
Further analysis indicates that the urban expansionin the YRD can result in increased air temperaturefrom the surface to 250 hPa over the north of30°N, and the warm air column can even extend upwardto the 150-hPa level over the south of 27°N(Fig. 14). It is also noted that there are three high-valuecenters of increased air temperature. One center is locatedbetween 30° and 35°N, extending upward from650 to 300 hPa with an intensity above 0.16, while theother two are located between 30° and 33°N and tothe north of 36°N, extending from the surface to 850 and 700 hPa with an intensity above 0.24 and 0.2, respectively.However, the urban expansion in the YRDleads to decreased air temperature above 200 hPa(150hPa)over the north of 34°N(the south of 27°N), and the cool air column can extend downward to 300 hPabetween 28° and 30°N. The implication is that urbanexpansion in the YRD could be a cause of the troposphericwarming and stratospheric cooling trend overeastern China.
 |
| Fig. 14. Height-latitude cross-section of air temperaturechange induced by urban expansion averaged along 115°–122°E during the 2001–2010 Meiyu seasons. The blackshading on the bottom indicates the YRD. |
The precipitation during the Meiyu period hasexperienced an increasing trend in the Huaihe Riverbasin and a decreasing trend in the Yangtze Riverbasin in recent years, while at the same time, the YRDhas experienced remarkably rapid urban expansion. Inthis study, two WRF simulation scenarios(M01 and M10)were employed to investigate the relationship betweenthe Meiyu precipitation change and urban expansionin the YRD. The following conclusions aredrawn.
(1)The WRF model can simulate well the me and istribution, st and ard deviation of precipitation, and latitudinal-vertical cross-sections of air temperature and pseudo-equivalent temperature during the Meiyuseason. The stage characteristics of Meiyu precipitation and the increasing trend of 2-m air temperaturecan also be well reproduced.
(2)As a result of urban expansion in theYRD, simulated precipitation during the Meiyu periodpresents an increasing trend(0.2–1.2 mm day−1)in the Huaihe River basin and over the l and to thesouth of 28°N, whereas a decreasing trend(0.2–1.2mm day−1)is presented in the Yangtze River basin and over the l and to the north of 35°N. Moreover, wefind that the spatiotemporal pattern of impact of urbanexpansion on Meiyu precipitation resembles thatof the third EOF mode of the observed precipitation, and this phenomenon suggests a non-negligible relationshipbetween the urban expansion in the YRD and the Meiyu precipitation change in recent years.
(3)Further analyses demonstrate that urban expansionin the YRD changes the surface energy balanceover eastern China, which leads to a warmingof the 2-m air temperature and tropospheric air temperature, but a cooling of stratospheric air temperature.Furthermore, the increased air temperatureleads to a strengthening of the l and -sea thermal contrastover eastern China and causes anomalous upward(downward)vertical motion and moisture convergence(divergence)over the Huaihe River(Yangtze River)basin, ultimately leading to the increasing(decreasing)precipitation trend in the Huaihe River(YangtzeRiver)basin. Therefore, it can be concluded thatthe warming of tropospheric air temperature and coolingof stratospheric air temperature, which cause thenorthward shift of the Meiyu belt, can be furtherstrengthened by urban expansion in the YRD. However, it is noted that urban expansion in the YRDcauses decreases in surface evaporation, which leadsto decreased Meiyu precipitation over the YRD.
However, the reasons why urban expansion affectstropospheric and stratospheric air temperature and leads to their different change patterns have notbeen investigated. We intend to address this issuein future work. Additionally, the influence of urbanexpansion in the YRD on regional Meiyu precipitationis extremely complex, because many effects areinvolved in the process(Zhang et al., 2010). In thispaper, we only focus on the physical impacts of urbanexpansion, including the changes in the surfaceenergy balance, evaporation, air temperature, and regionalatmospheric circulation. Previous researchershave found that air pollution(Qian et al., 2009) and the release of waste heat(Feng et al., 2012)can alsomodify the urban surface energy balance, regional atmosphericcirculation, and precipitation. These factorsmay also need to be considered in future studiesto examine the comprehensive impacts of urban expansionon Meiyu precipitation.
Acknowledgments. The authors are verygrateful for insightful comments and suggestions bythe two anonymous reviewers. We also thank Profs.Huang Anning, Tang Jianping, and Sun Xuguang, as well as Drs. Yang Ben and Xiao Chuliang for their technical support and valuable comments.
| Bueh, C., Shi Ning, Ji Liren, et al., 2008: Features of the EAP events on the medium-range evolution process and the mid-and high-latitude Rossby wave activi-ties during the Meiyu period. Chin. Sci. Bull., 53, 610-623. |
| Bukovsky, M. S., and D. J. Karoly, 2009: Precipitation simulations using WRF as a nested regional climate model. J. Appl. Meteor. Climate, 48, 2152-2159. |
| Charney, J., W. J. Quirk, S. -H. Chow, et al., 1977: A comparative study of the effects of albedo change on drought in semi-arid regions. J. Atmos. Sci., 34, 1366-1385. |
| Chase, T. N., R. A. Pielke, T. G. Kittel, et al., 1996: Sensitivity of a general circulation model to global changes in leaf area index. J. Geophys. Res., 101, 7393-7408. |
| Chen, F., and J. Dudhia, 2001: Coupling an advanced land surface-hydrology model with the Penn State-NCAR MM5 modeling system. Part I: Model imple-mentation and sensitivity. Mon. Wea. Rev., 129, 569-585. |
| Chen Hong and Xue Feng, 2013: Numerical simulation of decadal variations in the East Asian summer mon-soon and summer rainfall in eastern China. Chinese J. Atmos. Sci., 37, 1143-1153. (in Chinese) |
| Chen Tsingchang, Wang Shihyu, and Yen Mingcheng, 2007: Enhancement of afternoon thunderstorm ac-tivity by urbanization in a valley: Taipei. J. Appl. Meteor. Climate, 46, 1324-1340. |
| Collins, W. D., P. J. Rasch, B. A. Boville, et al., 2006: The formulation and atmospheric simulation of the Community Atmosphere Model version 3 (CAM3). J. Climate, 19, 2144-2161. |
| Ding Yihui, Liu Junjie, Sun Ying, et al., 2007: A study of the synoptic-climatology of the Meiyu system in East Asia. Chinese J. Atmos. Sci., 31, 1082-1101. (in Chinese) |
| Doll, C. N., 2008: CIESIN Thematic Guide to Night-time Light Remote Sensing and Its Applications. Center for International Earth Science Information Network of Columbia University, Palisades, NY, 19-21. |
| Du Yin, Xie Zhiqing, Zeng Yan, et al., 2007: Impact of urban expansion on regional temperature change in the Yangtze River Delta. J. Geogr. Sci., 17, 387- 398. |
| Eastman, J. L., M. B. Coughenour, and R. A. Pielke Sr, 2001: Does grazing affect regional climate? J. Hydrometeor., 2, 243-253. |
| Elvidge, C. D., F. -C. Hsu, K. E. Baugh, et al., 2013: National trends in satellite observed lighting: 1992- 2012. Global Urban Monitoring and Assessment through Earth Observation, Q. Weng, Ed., CRC Press, 2-3. |
| Feng Jinming, Wang Yongli, Ma Zhuguo, et al., 2012: Simulating the regional impacts of urbanization and anthropogenic heat release on climate across China. J. Climate, 25, 7187-7203. |
| Foley, J. A., R. DeFries, G. P. Asner, et al., 2005: Global consequences of land use. Science, 309, 570-574. |
| Ghosh, T., R. L. Powell, C. D. Elvidge, et al., 2010: Shedding light on the global distribution of eco-nomic activity. The Open Geography Journal, 3, 148-161. |
| Gong Daoyi and Ho Changhoi, 2002: Shift in the sum-mer rainfall over the Yangtze River valley in the late 1970s. Geophys. Res. Lett., 29, 78-1-78-4. |
| He Chunyang, Shi Peijun, Li Jinggang, et al., 2006: Restoring urbanization process in China in the 1990s by using non-radiance-calibrated DMSP/OLS night-time light imagery and statistical data. Chin. Sci. Bull., 51, 1614-1620. |
| Hong, S. -Y., and J. -O. J. Lim, 2006: The WRF single-moment 6-class microphysics scheme (WSM6). J. Korean Meteor. Soc., 42, 129-151. |
| Hong, S. -Y., Y. Noh, and J. Dudhia, 2006: A new ver-tical diffusion package with an explicit treatment of entrainment processes. Mon. Wea. Rev., 134, 2318-2341. |
| Huang Danqing, M. Takahashi, and Zhang Yaocun, 2011: Analysis of the Baiu precipitation and associated cir-culations simulated by the MIROC Coupled Climate System Model. J. Meteor. Soc. Japan, 89, 625-636. |
| Jiang Dabang and Wang Huijun, 2005: The natural properties of interdecadal weakening of East Asian summer monsoon in the late of 20th century. Chin. Sci. Bull., 50, 2256-2262. (in Chinese) |
| Kain, J. S., 2004: The Kain-Fritsch convective parameter-ization: An update. J. Appl. Meteor., 43, 170-181. |
| Kishtawal, C. M., D. Niyogi, M. Tewari, et al., 2010: Urbanization signature in the observed heavy rain-fall climatology over India. Int. J. Climatol., 30, 1908-1916. |
| Lin, W. S., C.-H. Sui, L. M. Yang, et al., 2007: A nu-merical study of the influence of urban expansion on monthly climate in dry autumn over the Pearl River Delta, China. Theor. Appl. Climatol., 89, 63-72. |
| Liu Haiwen, Zhou Tianjun, Zhu Yuxiang, et al., 2012: The strengthening East Asian summer monsoon since the early 1990s. Chin. Sci. Bull., 57, 1553- 1558. |
| Mote, T. L., M. C. Lacke, and J. M. Shepherd, 2007: Radar signatures of the urban effect on precip-itation distribution: A case study for Atlanta, Georgia. Geophys. Res. Lett., 34, L20710, doi: 10.1029/2007GL031903. |
| Oke, T. R., 1982: The energetic basis of the urban heat island. Quart. J. Roy. Meteor. Soc., 108, 1-24. |
| Qian Yun, Gong Daoyi, Fan Jiwen, et al., 2009: Heavy pollution suppresses light rain in China: Observa-tions and modeling. J. Geophys. Res., 114, doi: 10.1029/2008JD011575. |
| Ren Guoyu, Zhou Yaqing, Chu Ziying, et al., 2008: Ur-banization effects on observed surface air tempera-ture trends in North China. J. Climate, 21, 1333- 1348. |
| Sang, Y. F., Z. Wang, Z. Li, et al., 2013: Investiga-tion into the daily precipitation variability in the Yangtze River Delta, China. Hydrological Processes, 27, 175-185. |
| Seto, K. C., and J. M. Shepherd, 2009: Global urban land-use trends and climate impacts. Curr. Opin. Env. Sust., 1, 89-95. |
| Shepherd, J. M., 2005: A review of current investigations of urban-induced rainfall and recommendations for the future. Earth Interactions, 9, 1-27. |
| Shepherd, J. M., H. Pierce, and A. J. Negri, 2002: Rain-fall modification by major urban areas: Observa-tions from spaceborne rain radar on the TRMM satellite. J. Appl. Meteor., 41, 689-701. |
| Shepherd, J. M., M. Carter, M. Manyin, et al., 2010: The impact of urbanization on current and future coastal precipitation: A case study for Houston. Environ-ment and Planning B: Planning and Design, 37, 284-304. |
| Si Dong, Ding Yihui, and Liu Yanju, 2009: Decadal northward shift of the Meiyu belt and the possible cause. Chin. Sci. Bull., 54, 4742-4748. |
| Skamarock, W., J. Klemp, J. Dudhia, et al., 2008: A De-scription of the Advanced Research WRF Version 3, Mesoscale and Microscale Meteorology Division, National Center For Atmospheric Research, Boul-der, Colorado, 1-2. |
| Small, C., F. Pozzi, and C. D. Elvidge, 2005: Spatial analysis of global urban extent from DMSP-OLS night lights. Remote Sens. Environ., 96, 277-291. |
| Stohlgren, T. J., T. N. Chase, R. A. Pielke, et al., 1998: Evidence that local land use practices influence re-gional climate, vegetation, and stream flow patterns in adjacent natural areas. Global Change Biology, 4, 495-504. |
| Su, Z., 2002: The Surface Energy Balance System (SEBS) for estimation of turbulent heat fluxes. Hydrology and Earth System Sciences, 6, 85-99. |
| Wan Hongchao, Zhong Zhong, Yang Xiuqun, et al., 2013: Impact of city belt in Yangtze River Delta in China on a precipitation process in summer: A case study. Atmos. Res., 125-126, 63-75. |
| Wang Huijun, 2001: The weakening of the Asian mon-soon circulation after the end of 1970's. Adv. Atmos. Sci., 18, 376-386. |
| Wang Jun, Feng Jinming, Yan Zhongwei, et al., 2012: Nested high-resolution modeling of the impact of urbanization on regional climate in three vast urban agglomerations in China. J. Geophys. Res., 117, doi: 10.1029/2012JD018226. |
| Wei Fengying and Xie Yu, 2005: Interannual and inter-decadal oscillations of Meiyu over the middle lower reaches of the Chang-Jiang River for 1885-2000. J. Appl. Meteor. Sci., 16, 492-499. (in Chinese) |
| Wu Kai and Yang Xiuqun, 2013: Urbanization and het-erogeneous surface warming in eastern China. Chin. Sci. Bull., 58, 1363-1373, doi: 10.1007/s11434-012-5627-8. |
| Wu Rong and Zhang Yaocun, 2012: Performance of RegCM3 in simulating the rainfall and associated circulation in Meiyu period of Yangtze and Huaihe River valleys. J. Meteor. Sci., 32, 119-126. (in Chinese) |
| Xue, Y. K., H. M. H. Juang, W. P. Li, et al., 2004: Role of land surface processes in monsoon development: East Asia and West Africa. J. Geophys. Res., 109, D03105, doi: 10.1029/2003JD003556. |
| Yang Ben, Zhang Yaocun, and Qian Yun, 2012: Simu-lation of urban climate with high-resolution WRF model: A case study in Nanjing, China. Asia-Pacific J. Atmos. Sci., 48, 227-241, doi: 10.1007/s13143-012-0023-5. |
| Yang Xuchao, Hou Yiling, and Chen Baode, 2011: Observed surface warming induced by urbaniza-tion in East China. J. Geophys. Res., 116, doi: 10.1029/2010JD015452. |
| Yu Rucong, Wang Bin, and Zhou Tianjun, 2004: Tro-pospheric cooling and summer monsoon weakening trend over East Asia. Geophys. Res. Lett., 31, doi: 10.1029/2004GL021270. |
| Zhang Chaolin, Chen Fei, Miao Shiguang, et al., 2009: Impacts of urban expansion and future green planting on summer precipitation in the Beijing metropolitan area. J. Geophys. Res., 114, doi: 10.1029/2008JD010328. |
| Zhang Jiao, Wang Dongyong, Tian Hong, et al., 2008: Comparative analysis of atmospheric circulation characteristic over Huaihe River during the severe precipitation between 2003 and 2005. Scientia Me-teor. Sinica, 28, 402-408. (in Chinese) |
| Zhang Jingyong, Wu Lingyun, and Dong Wenjie, 2011: Land-atmosphere coupling and summer climate vari-ability over East Asia. J. Geophys. Res., 116, doi: 10.1029/2010JD014714. |
| Zhang Ning, Gao Zhiqiu, Wang Xuemei, et al., 2010: Modeling the impact of urbanization on the local and regional climate in Yangtze River Delta, China. Theor. Appl. Climatol., 102, 331-342. |
| Zhao Linna, Yang Xiaodan, Qi Dan, et al., 2007: The analysis of precipitation and flooding features in the Huaihe River basin during the summer of 2007. Cli-matic Environ. Res., 12, 728-737. (in Chinese) |
| Zong Haifeng, Zhang Qingyun, and Chen Lieting, 2006: Temporal and spatial variations of precipitation in eastern China during the Meiyu period and their re-lationships with circulation and sea surface temper-ature. Chinese J. Atmos. Sci., 30, 1189-1197. (in Chinese) |