 2015, Vol. 29
The Chinese Meteorological Society
Article Information
- YE Tianshu, SHEN Qian, WANG Kuo, ZHANG Zhisen, ZHAO Junhu. 2015.
- Interdecadal Change of the Northward Jump Time of the Western Pacific Subtropical High in Association with the Pacific Decadal Oscillation
- J. Meteor. Res., 29(1): 59-71
- http://dx.doi.org/10.1007/s13351-014-4040-4
-
Article History
- Received 2014-3-25
- in final form 2014-8-26


2 Laboratory for Climate Studies, National Climate Center, China Meteorological Administration, Beijing 100081
The western Pacific subtropical high(WPSH),animportant weather and climate system extending fromthe western Pacific to eastern China in the middle and low troposphere in summer,is a principal componentof the East Asian summer monsoon system(Tao and Wei, 2006). The WPSH has variable intensity and swing as it advances and retreats from north to south and from east to west,making its subtropical circulationadjustments(Zhao,1999). The WPSH’s most remarkableattribute is its two obvious northward jumpsduring its northward movement(Huang,1978). Onaverage,the first northward jump occurs during midJune when the East Asian summer monsoon advancesto the Yangtze River valley and the Jiang-Huai valleyMeiyu season begins. The second northward jumpoccurs during mid July,when the East Asian summermonsoon advances to North China,starts the rainyseason there, and the Jiang-Huai valley Meiyu season takes a break(Zhu and Yu, 1997; Zhang and Tao, 1999). Therefore,the WPSH’s two northward jumpsare intimately related to the progress of precipitationin eastern China. So far,there has been insufficientresearch on the WPSH’s northward jumps in considerationof global warming. A study on the interdecadalchanges in the time of the WPSH’s northward jumpsis necessary.
Previous research such as Zhang et al.(1997)hasshown that the Pacific decadal oscillation(PDO)isa strong signal of climatic variability on interdecadaltimescales(Mantua and Hare, 2002). The PDO notonly disturbs variations of long-term climatic trend,but also directly leads to interdecadal climate changesin the Pacific and surrounding areas(including China)(Zhu and Yang, 2003; Ma and Shao, 2006). The PDOprovides an important background for interdecadalvariability of the East Asian weather and climate system(Lü et al., 2005), and significantly regulates thesystem activity(Yang et al., 2004; Yang,2007). Manystudies(Namias et al., 1988; Trenberth,1990; Nakamura et al., 1997)have shown that toward the end ofthe 1970s(1976/1977),a significant interdecadal shift(or step change)occurred in the northern Pacific. Theeffect of the shift on the ocean and atmosphere was investigatedby a number of researchers(Nitta and Yamada, 1989; Miller et al., 1994; Trenberth and Hurrell, 1994; Hare and Mantua, 2000). Meanwhile,an abnormalinterdecadal warming of the sea surface temperature(SST)occurred in central and eastern tropicalPacific(Ding et al., 2013),an abnormal interdecadalcooling of SST occurred in central and western NorthPacific, and the SST rose in the gulf of Alaska and the western coast of North America(Zhu and Yang, 2003). Corresponding to the anomalous SST variationsin North Pacific,the sea level pressure(SLP) and the 500-hPa geopotential height over the NorthPacific area were clearly reduced, and the Aleutianlow was abnormally intensified and moved eastward and slightly southward(Zhu et al., 2008).
There have been many studies on the changes inthe PDO at the end of the 1970s. Zhu and Yang(2003)analyzed differences in precipitation,temperature,geopotential height, and wind fields in China under different phases of the PDO. They pointed outthat the effects of the El Niño–Southern Oscillation(ENSO)events on China’s summer climate anomalieshave definitely been modulated by the PDO. Zhu etal.(2000)proved that the large-scale reduction of SSTin the midlatitude North Pacific resulted in more precipitationover Northeast China and less precipitationin South China(south of 40°N). Yu and Lin(1997)studied the interdecadal step change of SST in NorthPacific and observed that before the SST step changein 1976/1977,there was typically high precipitationin the flood season in North China,low precipitationin the Yangtze valley, and high precipitation in SouthChina. However,after the step change,this situationreversed.
Based on the above results of previous research,we found close relationships between the WPSH and precipitation levels in China, and between the PacificSST and China precipitation, and their interdecadalchange characteristics. We then investigated the possibilityof a relationship between the time of the twonorthward jumps of the WPSH and the SST of the Pacific,especially that of PDO. Targeted at addressingthis topic on the interdecadal perspective,this paperdiscusses the possible relationship between theWPSH,the time of its two northward jumps, and the PDO,soas to establish meaningful clues for short-term climateprediction in China.
2. Data and methodsThis paper involves analysis of wind,geopotentialheight, and specific humidity on a daily basis aswell as monthly wind and SST,on a horizontal resolutionof 2.5° × 2.5° from the NCEP/NCAR reanalysis(Kalnay et al., 1996). The monthly average precipitation and Meiyu monitoring data from 160 stationsin China are provided by the National Climate Center(NCC)of the China Meteorological Administration.The PDO index is calculated according to Mantua and Hare(2002)by using the monthly PDO data availableat http://jisao.washington.edu/pdo/PDO.latest. ThePDO index is defined as the st and ardized value of thefirst principal component of an anomalous SST field north of 20°N in the Pacific. The time span of all the above data is from 1 January 1951 to 31 December 2012.
The time sequences of theWPSH’s two northwardjumps are obtained by using the computation methodproposed in Ye et al.(2014). The time of these twonorthward jumps is defined as follows: following thepentad for the first northward jump of the subtropicalhigh ridge over 20°N(26°N),if the ridge is also locatednorth of 20°N(26°N)during the next two pentads,thepentad for the first northward jump over 20°N(26°N)is defined as the time of the first(second)northwardjump; or in the case where the ridge is located north of20°N(26°N)during the second pentad,if the ridge isnot located north of 20°N(26°N)but is located northof 19°N(25°N)during the third pentad,the time ofthe first northward jump over 20°N(26°N)is definedas the time of the first(second)northward jump. Accordingto this definition,we calculated the time of thetwo northward jumps of subtropical high from 1951 to2012. Details of the calculation can be found in Ye etal.(2014).
3. Interdecadal characteristics of the WPSH’s northward jumpsBased on statistical analysis of the time sequencesof the two WPSH northward jumps,it is found thatthe average time of the first northward jump is duringthe 3rd pentad of June,with the earliest duringthe 2nd pentad of May(1961) and the latest duringthe 2nd pentad of July(1982,1992, and 2010); theaverage time of the second northward jump is duringthe 4th pentad of July,with the earliest duringthe 5th pentad of June(1955,1961, and 1984) and the latest during the 3rd pentad of September(1998).This represents the overall situation over the 62-yrperiod of 1951–2012. We then investigated how thetime sequences change during each decade of the 62-yr period. In Fig. 1,the staircase line shows the averagetime of the WPSH northward jump from 1951to 2012 for every decade. The average time for eachdecade shows the general interdecadal characteristicsof the two time sequences: the time of the first northwardjump(Fig. 1a)is later than the 62-yr averagevalue from the 1980s,which is a noticeable retardation.Before the early 1980s,the first northward jumptypically occurred during the 31st–32nd pentads(1st–2nd pentads of June),but after that,typically duringthe 33rd–34th pentads(3rd–4th pentads of June).The decade 2000–2012 witnessed the latest time of alldecades since 1951 for the first northward jump. Thevariation trend of the second northward jump(Fig. 1b)is similar to that of the first northward jump. Itoccurred generally during the 40th–41st pentads(4th–5th pentads of July)before the early 1980s and generallyduring the 41st–42nd pentads(5th–6th pentadsof July)after that. The decade 2000–2012 sees thesecond latest time during all the decades since 1951for the second northward jump.
 |
| Fig. 1. Northward jump time(bar),averaged northward jump time every decade(staircase dashed line), and departureaccumulation(curve; values indicated on the right y-axis).(a)Time of the first northward jump and (b)time of thesecond northward jump. |
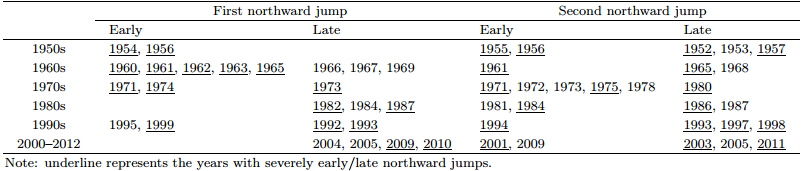
In order to analyze the distribution of the anomalousyears for the two northward jumps and the timeintervals specifically,we consider that a 0.8 timeslarger(smaller)deviation than the st and ard deviationof a positive(negative)anomaly of a northward jumptime indicates a slightly late(early)northward jumpyear. A 1.0 times larger(smaller)deviation than thest and ard deviation of a positive(negative)anomaly ofa northward jump time indicates a severely late(early)northward jump year.
According to this definition,we obtained a tableof anomalous years of the two northward jumps,as shown in Table 1. It is clear that from 1951 to2012,among the anomalous first northward jumps,11northward jumps occurred slightly early,9 of which occurredbefore the 1980s; 13 northward jumps occurredslightly late,9 of which occurred after the 1980s.Among the anomalous second northward jumps,13northward jumps occurred slightly early,8 of whichoccurred before the 1980s; 14 northward jumps occurredslightly late,8 of which occurred after the1980s. It is also obvious that decadal evolution existsin the severely abnormal years. Among the severelyabnormal years for the first northward jump,10 occurredseverely early, and 9 of which occurred beforethe 1980s; 7 occurred severely late, and 6 of whichoccurred after the 1980s. Severely abnormal years accountedfor 70.1% of all abnormal years for the first jump. Among the severely abnormal years for the secondnorthward jump,8 occurred severely early,5 ofwhich occurred before the 1980s; 10 occurred severelylate, and 6 of which occurred after the 1980s. Severelyabnormal years accounted for 66.7% of all abnormalyears for the second jump.
The above analysis gives a general idea of the interdecadalchange characteristics of the WPSH’s twonorthward jumps. To determine the exact time ofthe interdecadal change in the time of the two northwardjumps,we analyzed the anomalies of the timeof two northward jumps. In Fig. 1,the curves indicatethe departure accumulation of the two northwardjumps. The departure accumulation is obtainedby summing up all previous anomaly values, and it is scaled by the y-axis on the right in Fig. 1. When the time is “continuously early”(negativeanomaly),the curve trends downward, and when the time is “continuously late”(positive anomaly),thecurve trends upward. Figures 1a and 1b clearly showthe interdecadal change characteristics of the timeof the two northward jumps. The time of the firstnorthward jump shows an interdecadal change from“continuously early” to “continuously late”(Fig. 1a), and the changing point occurred in 1980. Prior to1980,the average time of the first northward jumpwas in the 31.3rd pentad(the 1st pentad in June).From 1981 to 2012,the average time of the first northwardjump was in the 33.8th pentad(the 4th pentad inJune). The t-test value of the original time sequenceof the first northward jump around 1980 is 3.93,whichhas passed the α = 0.01 significance level. The turningpoint in 1980 is consistent with the result of theM-K test(figure omitted). The interdecadal changeof the time of the WPSH’s second northward jump isalso clear(Fig. 1b),showing an interdecadal evolution from “continuously early” to “continuously late.” Before1955,the average time of the second northwardjump was in the 43.3rd pentad(the 1st pentad in August);from 1955 to 1978,the average time was in the39.5th pentad(the 3rd pentad in July); from 1979 to2012,the average time was in the 41.9th pentad(the6th pentad in July). The t-test values of the originaltime sequence of the above two turning points are 4.19 and 3.01,respectively,both of which have passed theα = 0.05 significance level. The results of the M-Ktest are the same(figure omitted).
The above analysis shows that before 1980,the interdecadaltime of the first northward jump was early;from 1981 to 2012,it was late; and from 2000 to 2012,it was later than any other decade. The interdecadaltime of the second northward jump was early from1955 to 1978; from 1979 to 2012,it was late; and 2000–2012 was the second latest decade for the secondnorthward jump over the entire 62-yr period.
4. Relation between WPSH northward jump time and precipitation anomaly in eastern ChinaIt is well known that the anomaly of the northwardjump of the WPSH ridge is closely related to theprecipitation anomaly in eastern China. In order tofurther investigate the effects of interdecadal changein the time of the WPSH northward jump on precipitation,we next compiled a composite of the anomalousprecipitation percentages for early and late WPSHjump cases(Fig. 2). According to the departure accumulationcurves in Figs. 1a and 1b,where bothcurves exhibit “continuously early” during 1955–1978 and “continuously late” during 1981–2012,the period1955–1978 is chosen as the early WPSH jump period and 1981–2012 as the late WPSH jump period. Correspondingly,the anomalous precipitation percentage iscomposited for these early and late periods. It shouldbe noted that since the average time of the first northwardjump is in June and the second northward jumpis in July,composites of the anomalous precipitationpercentages for both June and July of the early and late jump periods are necessary. Since the composite results are consistent with the correlation analysisresults,only the composite results are presented here.Figure 2 shows the distributions of the anomalous precipitationpercentage in the early and late jump periods, and the difference between these two cases(subtractingthe value of the early case from that of the latecase)for June,July, and the whole summer(June–August). As this study focuses on the interdecadaltimescale,it is reasonable to choose 1955–1978 and 1981–2012 as roughly the early and late WPSH jumpperiods.
 |
| Fig. 2. Composites of anomalous percentage of precipitation(%)in eastern China in the(a,d,g)early(1955–1978) and (b,e,h)late(1981–2012)WPSH northward jump periods, and (c,f,i)the difference between the two cases.(a–c)June,(d–f)July, and (g–i)summer. |
Figures 2a–c show composite distributions in Juneof the anomalous precipitation percentage in the early and late WPSH jump periods, and the difference betweenthem. It is clear that in the early first northwardjump period(June of 1955–1978),positive anomalousprecipitation percentage is distributed mainly southof 25°N and north of 35°N in China. The precipitationanomaly is less noticeable in East China,NortheastChina, and central Inner Mongolia(Fig. 2a).The reverse is true in the late northward jump period(June of 1981–2012)(Fig. 2b). This difference is moreclearly demonstrated in Fig. 2c,which presents a “+ –+ –” distribution of anomalous precipitation percentagefrom north to south. Figures 2d–f show a compositeof the anomalous precipitation percentage in Julyfor different jump periods. It is clear from Fig. 2d thatduring the early second northward jump period(Julyof 1955–1978),taking 35°N as the boundary,most areassouth of 35°N have a small amount of precipitation,while precipitation increases north of 35°N. Inthe late second jump period(July of 1981–2012)(Fig. 2e),the reverse is true, and this is better demonstratedin Fig. 2f where the 35°N boundary is clear. Figures2g–i show a composite of the anomalous precipitationpercentage in summer for different jump cases. Thisdistribution is similar to that in Figs. 2d–f,but thescope of the positive and negative anomalies shrinks.In the early case,35°N is generally the demarcationof positive and negative precipitation anomalies,whichcan be characterized as “north-abundant-south-belowaverage.”It is just the opposite in the late northwardjump case,where the precipitation is distributed as“south-abundant-north-below-average.” This result is consistent with the previously recognized patterns.
Therefore,the interdecadal change in the timeof the northward jump of WPSH may be one ofthe reasons behind the change in the anomalous precipitationpercentage,which alters the “floods north and droughts south” into “floods south and droughtsnorth.”
5. Relation between WPSH northward jump time and PDO5.1 Correspondence between PDO and the time of WPSH northward jumpThe PDO is a strong signal of climatic variabilityon interdecadal timescales. It is a disturbance superposedover a long-term climatic trend and can directlylead to the interdecadal climate change in the Pacific and surrounding areas(including China). The WPSHis a stable high pressure system over the Pacific. In order to reveal the relationship between the PDO and the interdecadal change in the time of WPSH’s twonorthward jumps,8-yr filtering is needed first,i.e.,removingthe interannual(under 8-yr)signal and retainingthe interdecadal(above 8-yr)signal.
After the 8-yr filtering,we calculated the correlationcoefficients between the time of WPSH’s twonorthward jumps in June and July and the PDO index(PDOI)in the prior period(March and April). The resultsshow that the correlation coefficient between thetime of the first northward jump and the PDOI is thehighest(0.50)in March, and the correlation betweenthe time of the second northward jump and the PDOIis the highest(0.57)in April,all of which have passedthe α = 0.001 significance level(i.e.,0.408). Figure 3 shows the 9-yr moving average anomaly after the8-yr filtering of the time of the two northward jumps and the PDOI in March and April. It is clear that inthe analysis period(1951–2012),there are significant interdecadal change characteristics in the anomaly ofthe northward jump time and the PDOI. From Fig. 3a,we can see that before the end of the 1970s,the anomaliesin the time of the first northward jump are all negativein years other than 1968–1971,i.e.,the early firstnorthward jump occurred. From the early 1980s,theanomalies turned positive and most late WPSH northwardjumps occurred. Similarly,in March,there wasa clear cold(negative index)to warm(positive index)phase change at the end of the 1970s. After 2008,thePDO again changed into a cold phase(Fig. 3b). Figures3c and 3d show the 9-yr moving average anomalyof the second northward jump time and the PDOI after8-yr filtering in April. It is clear that the anomalyof the time of the second northward jump shifts fromearly to late in the early 1980s. In April,the PDOIshifts from a cold phase to a warm phase and again toa cold phase(Fig. 3d).
 |
| Fig. 3. Nine-year moving average of the anomaly of the two northward jump times and the PDOI after 8-yr filtering.(a)First northward jump time,(b)PDOI in March,(c)second northward jump time, and (d)PDOI in April. |
We now take a complete PDO period as the timewindow,namely,the cold phase(from 1951 to 1976) and the warm phase(from 1977 to 2007). The aboveanalysis indicates that the cold phase of the PDOI correspondsto the early northward jump and the warmphase corresponds to the late northward jump. Therefore,it seems that there is a close relationship betweenthe interdecadal change of the PDO and the interdecadalearly–late swing of the time of the WPSH’snorthward jump.
5.2 Modulation between SST in North Pacific and northward jump time of WPSHPacific SSTs in various areas have different effectson the time of the WPSH northward jump. To explorethis SST influence,we conducted a correlation analysis.Figure 4 shows the correlation coefficient betweenthe time of the two northward jumps and the NorthPacific SST in March and April,respectively. The timeof the northward jump and the North Pacific SST areall 8-yr filtered in advance.
 |
| Fig. 4. Correlation coefficient between WPSH northward jump time and preceding North Pacific SST.(a)Firstnorthward jump time and North Pacific SST in March, and (b)second northward jump time and North Pacific SST inApril. Dotted areas indicate values passing the significance level of α= 0.001. |
From Figs. 4a and 4b,we can see that the correlationcoefficients are negative in the north and positivein the south on the interdecadal timescale. In Fig. 4a,the time of the first northward jump has a significantnegative correlation with Pacific SST north of20°N. This means that cold Pacific SSTs in midlatitude,corresponding to warm phase of the PDO,arefavorable to a late northward jump. In contrast,warmPacific SSTs in midlatitude,corresponding to the coldphase of the PDO,are favorable to an early northwardjump. These results are consistent with the analysesin Section 5.1. However,we also notice that there is asignificant positive correlation in the central and easternequatorial Pacific,indicating that when the SSTsthere are warm(El Niño),it favors a late jump; while the cold SSTs of La Niña are favorable to an earlynorthward jump. These results are consistent withthose previously reported(Zhu and Yu, 1997; Ye et al., 2014). Compared with Fig. 4a,distribution of thecorrelation coefficient between the time of the secondnorthward jump and the North Pacific SSTs(Fig. 4b)is basically the same,except that the significantly correlatedarea has become smaller.
The above analyses indicate that the time ofWPSH’s northward jump has a significant positive correlationnot only with the PDOI but also with theENSO. Ye et al.(2014)found that the correlationcoefficients during April–May are the highest(at thesignificance level of α = 0.001)between the time ofthe two northward jumps and SSTs in the central and eastern equatorial Pacific. In this paper,the correlationcoefficients between the time of the two northwardjumps and the PDOI in March–April are thehighest,which means that the PDO’s effect mighthave occurred earlier than the ENSO’s by about 1–2months. This shows a modulation between the PDO,the ENSO, and the time of the WPSH northward jump.
6. A possible mechanismIt is clear that the PDO and the ENSO bothhave an effect on the time of the WPSH’s northwardjump. In order to identify the differences of the atmosphericcirculation in the cold(1951–1976) and warm(1977–2007)phase of the PDO(refer to Figs. 3b and 3d),we used the composite method after eliminatingthe interference from El Niño/La Niña. Wefirst removed the El Niño years of 1951,1953,1957,1958,1963,1965,1969,1972,1982,1987,1991,1997,2002, and 2004. Then,we removed the La Niña yearsof 1954,1955,1956,1964,1970,1971,1973,1974,1975,1985,1988,1998,1999, and 2000. The criteriaare taken from http://origin.cpc.ncep.noaa.gov/products/analysis−monitoring/ensostuff/ensoyears.shtml. After these removals,the total number of PDOcold phase years is 9, and the number of PDO warmphase years is 20.
Figure 5 shows a composite of the summer wind and geopotential height fields at 200 hPa in thecold/warm phase of the PDO. Here,the cold(warm)phase of PDO refers to the remaining years in theperiod 1951–1976(1977–2007)after excluding the ElNi˜no and La Ni˜na years. During the cold phase(Fig. 5a),the location of the South Asian high(SAH; wherethe geopotential height is higher than 1252 dagpm)is to the north and west,the 1252-dagpm isogramcovers a smaller range, and the westerly(u ≥ 25 ms−1)is weak. This circulation pattern favors a north and eastward WPSH at 500 hPa. According to Liuet al.(2006),when the westerly is weak and to thenorth,it is conducive to a northward jump of theWPSH at 500 hPa. Compared with Fig. 5a,the atmosphericcirculation in the PDO warm phase(Fig. 5b)is reversed. The SAH is to the south and east,the 1252-dagpm isogram covers a larger range, and the westerly is strong,which restrains the northward development of the WPSH.
 |
| Fig. 5. Composite of geopotential height(isogram; dagpm) and zonal wind(m s−1)fields at 200 hPa in different phasesof PDO.(a)Cold phase and (b)warm phase. Shaded areas illustrate the regions where u ≥ 25 m s−1. |
Figure 6 shows a composite of the summer verticallyintegrated water vapor flux and 500-hPa heightfield in the cold/warm phase of the PDO. From Fig. 6a,we can see that in the PDO cold phase,the WPSHis to the north and east, and the 588-dagpm isogramcovers a smaller range. The shaded area and vectorrepresent the moisture flux integrated from the surfaceto 300 hPa. The vertically integrated moisture fluxshows an obvious northward extension reaching NorthChina. While this configuration can cause abundantsummer rainfall in the north,the heating from cumulusconvective condensation is the strongest contributorto the development of the south wind located onthe west side of the WPSH; strong south wind canthen provide opportunities for a northward jump of theWPSH(Liu and Yao, 2000). With the positive feedbackof the northward jump,precipitation in NorthChina becomes stronger. These results are consistentwith our earlier analysis in Section 4. In contrast,duringthe warm phase of PDO(Fig. 6b),the WPSH is tothe south and west,the 588-dagpm isogram covers alager range, and the vertical integrated moisture fluxonly reaches South China. This can cause abundantsummer rainfall in the south, and the heating fromcumulus convective condensation works against developmentof the south wind,hence,the WPSH is givenlittle opportunity to move northward.
 |
| Fig. 6. Composite of geopotential height(isogram; dagpm)at 500 hPa and vertically integrated moisture flux(shaded and vector; kg m−1 s−1)in different phases of PDO.(a)Cold phase and (b)warm phase. |
Figure 7 shows a composite of the flow field and meridional wind field at 850 hPa in the cold/warmphase of the PDO. A comparison of Figs. 7a and 7b reveals that during the cold phase,the WPSH is tothe east,the meridional wind speed of v ≥ 2 m s−1 iswest of the WPSH and could reach North China, and there is strong south wind. This circulation patterncompels an early northward jump of the WPSH. Inthe warm phase,the stronger meridional wind(v ≥ 2m s−1)could only reach as far as South China, and thesouth wind is weak. In this situation,the northwardjump of WPSH tends to be late.
 |
| Fig. 7. Composite of flow field(streamline) and meridional wind filed(shaded)at 850 hPa(shading represents v ≥ m s−1)in different phases of PDO.(a)Cold phase and (b)warm phase. |
The above analyses could explain the influence ofthe cold/warm phase of the PDO on the early/latetime of the WPSH’s northward jump,as well as thelocation of summer rainfall. In summary,during thecold phase of PDO,the SAH is to the west and north,the westerly wind is weak, and a comparatively weaker500-hPa WPSH is to the east and north. As a result,moisture flux toward the north strengthens and could reach North China,the condensational heatingin the northwest of the WPSH is intense due to cumulusconvection, and the 850-hPa south wind westof the WPSH strengthens. This circulation configurationfacilitates the early northward jump of WPSH.In contrast,the circulation configuration in the warmphase of the PDO accommodates the late northwardjump of the WPSH.
7. Conclusions and discussionIn this paper,we acquired the time sequences ofthe WPSH’s two northward jumps,analyzed the interdecadalevolution characteristics, and discussed therelationship between the time of theWPSH northwardjump and the PDO. The results are as follows.
(1)Before the 1980s,the WPSH’s first northwardjump was early. From 1981 to 2012,the WPSH’s firstnorthward jump was late. From 2000 to 2012,theWPSH’s first northward jump occurred later than anyother decadal period. With respect to the WPSH’ssecond northward jump,the time was early from 1955to 1978,late from 1979 to 2012, and the time of thesecond northward jump occurred later than any otherdecade from 2000 to 2012.
(2)The anomalous summer precipitation percentagesin eastern China exhibit an interdecadalchange from “north-abundant-south-below-average”to “south-abundant-north-below-average” after the interdecadalchange in the time of the WPSH’s northward jump.
(3)An interdecadal change of PDO from coldto warm phase occurred in both March and April of1976/1977. The cold phase of the PDO correspondsto an early northward jump of WPSH and the warmphase corresponds to a late northward jump.
(4)The time of the WPSH’s northward jump hasa significant positive correlation with both the PDO and the ENSO. After removing El Ni˜no/La Ni˜na years,composite results indicate that during the cold(warm)phase of the PDO,the SAH is to the west(east) and north(south),the 200-hPa westerly is weak(strong);the 500-hPa WPSH is weak(strong), and lies to theeast(west) and north(south),the latent heat of condensationin the northwest of the WPSH is intense(mild); and the 850-hPa south wind located in thewest of the WPSH is strong(weak). These circulationconfigurations facilitate the interdecadal early(late)northward jump of the WPSH.
Through our analyses,it is clear that the differentphases of the PDO correspond well to the interdecadalanomalies in the time of the WPSH northward jump,which may significantly affect the summer precipitationin eastern China. It is important to note thatalthough we have revealed a correspondence and correlationbetween the time of the WPSH’s northwardjump and the PDO,the WPSH’s northward jump processis very complex due to uncertainties and nonlinearitiesin the atmospheric circulation system(Feng et al., 2006,2009; Wang et al., 2012,2013). It is difficultto establish a change rule or to make relatively accuratepredictions about the jump time of WPSH,basedsolely on its correlation with the PDO. As a result,the precipitation predictions are also complex. However,in recent years,some researchers(Chou et al., 2010; Zheng et al., 2010; Wang et al., 2011; Yang et al., 2012; Zheng et al., 2012,2013)have conducted aseries of investigations and have obtained encouragingpreliminary results. Further study is merited to discoverthe relationship between SST and the northwardjump of the WPSH to better predict summer precipitationin eastern China.
Acknowledgments. We thank two anonymousreviewers for their valuable comments and suggestions.
| [1] | Chou Jifan, Zheng Zhihai, and Sun Shupeng, 2010: The think about 10-30-day extended-range numerical weather prediction strategy facing the atmosphere chaos. Scientia Meteor. Sinica, 30, 569-573. (in Chinese) |
| [2] | Ding Yihui, Sun Ying, Liu Yunyun, et al., 2013: Interdecadal and interannual variabilities of the Asian summer monsoon and its projection of future change. Chinese J. Atmos. Sci., 37, 253-280. (in Chinese) |
| [3] | Feng Guolin, Hou Wei, and Dong Wenjie, 2006: A technique for distinguishing dynamical species in the temperature time series of Yangtze River delta. Acta Phys. Sinica, 55, 962-968. (in Chinese) |
| [4] | Feng Guolin, Wang Qiguang, Hou Wei, et al., 2009: Long-range correlation of extreme events in meteo-rological field. Acta Phys. Sinica, 58, 2853-2861. (in Chinese) |
| [5] | Hare, S. R., and N. J. Mantua, 2000: Empirical evidence for North Pacific regime shifts in 1977 and 1989. Prog. Oceanogr., 47, 103-145. |
| [6] | Hou Wei, Feng Guolin, Dong Wenjie, et al., 2006: A technique for distinguishing dynamical species in the temperature time series of North China. Acta Phys. Sinica, 55, 2663-2668. (in Chinese) |
| [7] | Huang Shisong, 1978: The research about the activities and prediction of western Pacific subtropic high. Chinese J. Atmos. Sci., 2, 159-168. (in Chinese) |
| [8] | Kalnay, E., M. Kanamitsu, R. Kistler, et al., 1996: The NCEP/NCAR 40-year reanalysis project. Bull. Amer. Meteor. Soc., 77, 437-471. |
| [9] | Liu Huanzhu and Yao Mingming, 2000: Numerical simulation on the precipitation and variation of the lo-cation and intensity of the subtropical high. Quart. J. Appl. Meteor., 11, 385-391. (in Chinese) |
| [10] | Liu Huanzhu, Zhao Shengrong, Zhao Cuiguang, et al., 2006: Weather abnormal and evolutions of western Pacific subtropical high and South Asian high in summer of 2003. Plateau Meteor., 25, 169-178. (in Chinese) |
| [11] | Lü Junmei, Jü Jianhua, Zhang Qingyun, et al., 2005: The characteristics of ENSO cycle in different phases of the Pacific decadal oscillation. Climatic Environ. Res., 10, 238-249. (in Chinese) |
| [12] | Ma Zhuguo and Shao Lijuan, 2006: Relationship between dry/wet variation and the Pacific decadal oscillation (PDO) in northern China during the last 100 years. Chinese J. Atmos. Sci., 30, 464-474. (in Chinese) |
| [13] | Mantua, N. J., and S. T. Hare, 2002: The Pacific decadal oscillation. J. Oceanogr. Soc., 58, 35-44. |
| [14] | Miller, A. J., D. R. Cayan, T. P. Barnett, et al., 1994: The 1976-1977 climate shift of the Pacific Ocean. Oceanography, 7, 21-26. |
| [15] | Nakamura, H., G. Lin, and T. Yamagata, 1997: Decadal climate variability in the North Pacific during the recent decades. Bull. Amer. Meteor. Soc., 78,2215-2225. |
| [16] | Namias, J., X. Yuan, and D. R. Cayan, 1988: Persistence of North Pacific sea surface temperature and atmo-spheric flow patterns. J. Climate, 1, 682-703. |
| [17] | Nitta, T., and S. Yamada, 1989: Recent warming of tropical sea surface temperature and its relationship to the Northern Hemisphere circulation. J. Meteor. Soc. Japan, 67, 375-383. |
| [18] | Tao Shiyan and Wei Jie, 2006: The westward, northward advance of the subtropical high over the west Pacific in summer. J. Appl. Meteor. Sci., 17, 513-525. (in Chinese) |
| [19] | Trenberth, K. E., 1990: Recent observed interdecadal climate changes in the Northern Hemisphere. Bull. Amer. Meteor. Soc., 71, 988-993. |
| [20] | Trenberth, K. E., and J. W. Hurrell, 1994: Decadal atmosphere-ocean variations in the Pacific. Climate Dyn., 9, 303-319. |
| [21] | Wang Kuo, Feng Guolin, Wang Qiguang, et al., 2012: Change of climatological background field information in the winter 2010. Adv. Devel. Appl. Math-ema., 3, 22-30. |
| [22] | Wang Kuo, Feng Guolin, Zeng Yuxing, et al., 2013: Analysis of stable components in the extended-range forecast for the coming 10-30 days in winter 2010 and 2011. Chin. Phys. B, 22, 129202. |
| [23] | Wang Qiguang, Feng Guolin, Zheng Zhihai, et al., 2011: A study of the objective and quantifiable forecasting based on optimal factors combinations in prediction of precipitation in the middle and lower reaches of the Yangtze River in summer. Chinese J. Atmos. Sci., 35, 287-297. (in Chinese) |
| [24] | Yang Jie, Zhao Junhu, Zheng Zhihai, et al., 2012: Estimating prediction errors of the dynamical climate model on the basis of prophase key factors in North China. Chinese J. Atmos. Sci., 36, 11-22. (in Chi-nese) |
| [25] | Yang Qiuming, 2007: Effect of PDO on the interannual relationships between summer rainfall in the Yangtze River and the Huaihe River valley and SST in the Pacific Ocean. Marine. Sci., 31, 43-50. (in Chinese) |
| [26] | Yang Xiuqun, Zhu Yimin, Xie Qian, et al., 2004: Ad-vances in studies of the Pacific decadal oscillation. Chinese J. Atmos. Sci., 28, 979-992. (in Chinese) |
| [27] | Ye Tianshu, Zhi Rong, Zhao Junhu, et al., 2014: Twice northward jumps of WPSH and its relationship with summer rainfall in eastern China under global warm-ing. Chin. Phys. B, 23, 069203. |
| [28] | Yu Shuqiu and Lin Xuechun, 1997: Climatic jump of North Pacific SST and its effect on precipitation of flood season in China. J. Trop. Meteor., 13, 265-275. (in Chinese) |
| [29] | Zhang Qingyun and Tao Shiyan, 1999: Study of the sud-den northward jump of the subtropical high over the western Pacific. Acta Meteor. Sinica, 57, 539-548. (in Chinese) |
| [30] | Zhang, Y., J. M. Wallance, and D. S. Battisti, 1997: ENSO-like interdecadal variability: 1900-93. J. Cli-mate, 10, 1004-1020. |
| [31] | Zhao Zhenguo, 1999: The Summer Drought and Flood and Environmental Field in China. China Meteoro-logical Press, Beijing, 45-55. (in Chinese) |
| [32] | Zheng Zhihai, Feng Guolin, Chou Jifan, et al., 2010: Compression for freedom degree in numerical weather prediction and the error analogy. J. Appl. Meteor. Sci., 21, 139-148. (in Chinese) |
| [33] | Zheng Zhihai, Feng Guolin, Huang Jianping, et al., 2012: Predictability-based extended-range ensemble pre-diction method and numerical experiments. Acta Phys. Sinica, 61, 199-203. (in Chinese) |
| [34] | Zheng Zhihai, Huang Jianping, Feng Guolin, et al., 2013: Forecast scheme and strategy for extended-range predictable components. Science China (Earth Sci-ences), 56, 878-889. |
| [35] | Zhu Pingsheng, Zhang Suping, and Hu Guifang, 2000: Simulation of the effect of North Pacific SST anomaly in the middle latitute on precipitation in China. Meteor. Mon., 26, 3-8. (in Chinese) |
| [36] | Zhu Yimin and Yang Xiuqun, 2003: Relationships be-tween Pacific decadal oscillation (PDO) and climate variabilities in China. Acta Meteor. Sinica, 61,641-654. (in Chinese) |
| [37] | Zhu Yimin, Yang Xiuqun, Yu Yongqiang, et al., 2008: Decadal variability in the North Pacific as simulated by FGOALS-g fast coupled climate model. Chinese J. Geophys., 51, 58-69. (in Chinese) |
| [38] | Zhu Yuxian and Yu Shihua, 1997: A diagnostic research of the seasonal northward beating of the subtropical high. J. Trop. Meteor., 13, 246-257. (in Chinese) |