 2015, Vol. 29
The Chinese Meteorological Society
Article Information
- WANG Hui, LUO Yali, ZHANG Renhe. 2015.
- Synoptic Pattern and Severe Weather Associated with the Wide Convection over Southeast China During the Summer Monsoon Period
- J. Meteor. Res., 29(1): 41-58
- http://dx.doi.org/10.1007/s13351-014-4069-4
-
Article History
- Received 2014-5-23
- in final form 2014-7-29


2 Key Laboratory for Cloud Physics and Weather Modification of China Meteorological Administration, Chinese Academy of Meteorological Sciences, Beijing 100081;
3 Collaborative Innovation Center on Forecast and Evaluation of Meteorological Disasters, Nanjing University of Information Science & Technology, Nanjing 210044
Nearly all WC occurrences in this region are associated with thunderstorms, due to large convective available potential energy and abundant moisture. Among the three synoptic patterns, the DTr pattern features the driest and coldest air in the region, leading to the least occurrences of short-duration heavy rainfall. Strong winds occur the most often under the DTr pattern, probably owing to the largest difference in air humidity between the mid and low troposphere. Hail at the surface is rare for all occurrences of WC, which is probably related to the humid environmental air under all weather patterns and the high (> 5 km) freezing level under the STH pattern.
Precipitation over China is closely related to thesummer monsoon activities(Ding and Chan, 2005).Occurrence frequency and intensity of heavy rainfallover East China increase significantly after the onsetof the South China Sea(SCS)monsoon in May, whilethe first rainy season over the mainl and of China startsin April(Wang et al., 2004; Ding and Wang, 2008). Influenceof the summer monsoon on precipitation overChina generally lasts until the end of August(Ding, 1994). During the summer monsoon period, floods occurfrequently and cause serious economic losses and quantities of casualties in East China(Huang et al., 2004). More than 90% of the monsoon rainfall in EastChina is contributed by precipitation systems that present convective features(Luo et al., 2013).
Convective intensity of storms is of importancebecause of its close association with the rainfall intensity, wind speed, and hail amount at the surface, and thus societal and economic impacts. Vertical velocityof air mass in a storm is probably the most accurate and direct parameter to measure the convectiveintensity of storms; but observation of air verticalvelocity is lacking around the world. While thelaunch of the Tropical Rainfall Measuring Mission(TRMM; Kummerow et al., 2001)aims at detectingthree-dimensional(3D)structures of precipitation systems, many studies have applied the TRMM data as ameasurement or estimation of convective intensity ofprecipitating systems. The commonly used parametersbased on the TRMM observations include the verticalprofile of maximum reflectivity, minimum polarizationcorrected temperatures at 85 and 37 GHz, and flash rate(Cecil et al., 2002, 2005; Zipser et al., 2006).The 3D echo structures viewed by TRMM precipitationradar(PR; Kawanishi et al., 2000)have also beenused to classify precipitation systems, especially thosein association with extreme echo structures. For example, Houze et al.(2007) and Romatschke et al.(2010)identified three extreme echo structures: deep convectivecores, wide convective cores, and broad stratiformregions(Fig. 3 in Romatschke et al., 2010, showingexamples of the extreme echo structures), and investigatedthe temporal and spatial variations of the extremeconvection in South Asia.
As the precipitation of East China is highly convective, knowledge of the convective structure and processesover this region is helpful for underst and ing climatologicalpatterns of rain in the region. Wide convection(WC), defined as contiguous convective echoesover 40 dBZ with nonzero near surface rainfall ratefrom PR(Iguchi et al., 2000)over a horizontal areaexceeding 1000 km2, is often located within maturemesoscale convective systems(MCSs)with a large convectivearea and probably in association with severeconvective weather. However, study on the statisticsof WC in China has not been done so far. This studyinvestigates theWC viewed by TRMM PR over SoutheastChina and its vicinity(l and region of 15°–35°N, 105°–125°E; Fig. 1b)where the largest amount of precipitationoccurs during the Asian summer monsoonperiod.
 |
| Fig. 1.(a)Topography map overlaid by the average θe = 345 K isolines at 850 hPa in East China and its vicinityfrom the onset of SCS summer monsoon(SCSSM)to 31 May, and each half month of 1–15 June, 16–30 June, 1–15 July, 16–31 July, 1–15 August, and 16–31 August. These isolines are the mean for 1998–2010. The cities of Beijing, Shanghai, and Hong Kong(pink circles)are labeled.(b)Geographical distribution of occurrence frequency of the WC in SoutheastChina and its vicinity(shadings), which is calculated as number of pixels of WC divided by the total number of TRMMpixels for each 0.5°× 0.5°grid. The horizontal winds at 850 hPa averaged form the onset of SCSSM to the end ofAugust of 1998–2010(black arrows)are based on the ERA-interim data. The Yangtze and Huai rivers are marked withblue lines. The black rectangle in each panel represents location of the central plain of East China. |
There are a total of 697 WC occurrences overSoutheast China and its vicinity during the periodfrom the SCS monsoon onset to the end of Augustduring 1998–2010. The WC occurrences are extremein the sense that they account for only 0.19% of theTRMM PR observed rainy storm population. Theirdistribution(Fig. 1b)clearly suggests that the WCtends to occur the most often over the flat l and regionof central East China(i.e., 31°–35°N, 114°–121°E), herein referred to as the central plain of East Chinaor the control region. This region is highly populated, contributing a significant share of economy of China.Classification of synoptic weather patterns for the WC and underst and ing of the associated severe weatherphenomena are helpful for severe weather forecastingin this region and therefore of practical importance.
The WC over the central plain of East Chinais the focus of this study. The main objectivesare:(1)to identify major synoptic weather patternsfor the WC occurrences and their subseasonal variations;(2)to investigate occurrences of severe convectiveweather phenomena in association with theWC; and (3)to quantify the corresponding environmentalatmospheric conditions that are relevant to developmentof distinctive convective weather phenomena.This paper is organized as follows. Section 2describes the data and methodology. Section 3 describesclassification of synoptic patterns, and Section4 presents subseasonal variations of the WC. Section5 provides the statistics of severe convective weatherphenomena corresponding to each of the identifiedsynoptic patterns. The corresponding environmentalatmospheric conditions are introduced in Section 6.Section 7 gives the summary and discussion of thisarticle.
2. Data and methodology2.1 TRMM dataIn this study, the University of Utah TRMMLevel-1 database is used to identify WC and to analyze the geographical distribution of WC occurrences.The dataset is developed by Liu et al.(2008), producedby collocation of measurements from four differentinstruments aboard the TRMM satellite: PR, TRMM Microwave Imager, Visible and Infrared Scanner, and Lightning Imaging Sensor(Liu, 2007). Informationof 3D distribution of radar reflectivity of cloud and precipitation at the coordinates of PR pixels isused in the present study.
2.2 ERA-interim dataThe ERA-interim(Simmons et al., 2007; Dee et al., 2011)reanalysis data from the ECMWF provideatmospheric variables four times per day(at 0000, 0600, 1200, and 1800 UTC). They are analyzed hereinto reveal the synoptic weather patterns and the environmentalthermodynamic conditions related to developmentof the WC.
2.3 Surface observationsQuality-controlled surface observations at globalmeteorological stations from 1998 to 2010 are obtainedfrom the National Meteorological InformationCenter(NMIC)of China Meteorological Administration(CMA)(http://mdss.cma.gov.cn:8080/shuju/index3.jsp?tpcat=SURF&dsid=SURF−WEA−GLB−MUL−FTM−QC&type=file). The observationsare available four times(0000, 0600, 1200, and 1800UTC)per day. There are 56 surface observation stationsquite evenly distributed in the central plain ofEast China. The elements extracted from this datasetinclude observation date/time, longitude and latitudeof station, wind speed, 6-h accumulated rainfall, and weather phenomenon.
Four kinds of severe convective weather phenomenaare analyzed in this study, including thunderstorm, gale, hail, and short-duration heavy rainfall. Thunderstorm and hail are determined by directlyreferring to the observation of weather phenomenonin the surface observation dataset; gale is defined asthe wind speed at the station turns greater than 17m s−1; short-duration heavy rainfall is considered asthe accumulated rainfall during the past 6 h(R6h)islarger than 20, 30, or 50 mm, respectively. Occurrenceof a severe convective weather phenomenon ata certain time in the central plain of East China isdefined as this severe convective weather phenomenonwas observed over at least 1 of the 56 surface stationsin the region during 1998–2010.
2.4 Definition of WCThe definition of WC is similar to the definitionof “wide convective cores” by Houze et al.(2007) and Romatschke et al.(2010), who defined wide convectivecores as contiguous convective echoes of ≥ 40 dBZover a horizontal area of ≥ 1000 km2. With such extensiveintense convective cores, the WC often occurswithin extremely broad MCSs with large convectiveareas. Compared to precipitation systems that arethe most intense as measured by proxies at the PRpixel-level(e.g., maximum reflectivity at 6-km altitude, maximum height of the 40-dBZ echo), this typeof precipitation system generally has larger horizontalspan and larger near surface volumetric rainfall.As examples, Fig. 2 shows properties of three WCsobserved by TRMM on 17 May 2008, 29 June 2006, and 20 July 2003, respectively. Clearly, the convectivecores were embedded inside a large rainy areawhere the radar echo was weak and generally smoothlydistributed. The convective area was 11233, 16463, and 6838 km2, respectively, accounting for about 28%, 35%, and 21% of each MCS’s total area. The volumetricrainfall of the MCS was 179827, 258677, and 74080mm h-1 km2, respectively, with 68%, 70%, and 54%contribution from convective rain. A majority of theconvective cores had tops located between 6- and 9-km altitudes, although they could occasionally reachup to 12 km.
 |
| Fig. 2. Three examples of TRMM PR fields that exhibited the wide convection at(a–d)1232 UTC 17 May 2008, (e–h)0208 UTC 29 June 2006, and (i–l)1805 UTC 20 July 2003. The first row shows rain types from the TRMM2A23 algorithm(Awaka et al., 1998)where yellow and green indicate convective and stratiform rainfall, respectively;the second and third rows respectively show the horizontal cross-sections of near surface rain rate derived from theTRMM PR(Iguchi et al., 2000) and radar reflectivity at 3-km altitude; the last row shows vertical cross-sections of radarreflectivity through the black solid lines in the third row. The black dashed lines in the upper three rows represent theboundaries of the TRMM PR scan. |
The onset date of the SCS summer monsoon is defined following the criterion of CMA NationalClimate Center(http://cmd.ncc.cma.gov.cn/Monitoring/monsoon.htm), which is the day when horizontalzonal wind at 850 hPa stably changes from easterlyto westerly and the pseudo-equivalent potential temperature(θe)at 850 hPa becomes larger than 340 Kover 10°–20°N, 110°–120°E. The onset dates of theSCS summer monsoon during 1998–2010 are given inTable 1.

There are 212 WC occurrences detected byTRMM over the central plain of East China fromthe onset of the SCS summer monsoon to the end ofAugust during 1998–2010. According to the 500-hPageopotential height pattern over East Asia(15°–45°N, 100°–130°E)during the period whenWC was detectedby TRMM, three synoptic weather patterns of theWC were identified by using a two-step method as follows.
(1)Possible impact of a typhoon was consideredfirstly. If the center of a typhoon was located lessthan 1500 km from the boundary of the control region, the typhoon may have some effect on the WC.The corresponding synoptic pattern was categorizedas the typhoon-effect(Typh)type.
(2)KMEANS clustering(Anderberg, 1973)was applied to classification of synoptic weather patternsfor the other WC cases. A predefined number of clusters, being 2 and 3, respectively, was tested, and distributionsof the clustering centers are shown in Fig. 3.The key results of the analysis are the mean patternwithin each cluster and the number of cases withineach cluster. With the number of clusters being 2, twodistinctive synoptic weather patterns were obtained: adeep trough controls the central plain of East China(C21; Fig. 3a), and a northwestern Pacific subtropicalhigh maintains around the south of the controlregion interacting with a trough to the north(C22;Fig. 3b). When the clustering number was increasedto 3(Figs. 3c–e), the first pattern(C31)was verysimilar to C21 and the other two patterns(C32 and C33)resemble C22, i.e., they were both characterizedwith the northwestern Pacific subtropical high interactingwith a trough to the north, but the northwesternPacific subtropical high was located more southwardin C32 and more northward in C33 comparedto C22. In order to ensure uniqueness of the classifiedsynoptic weather patterns, the results with thenumber of clusters being 2 are adopted. The classifiedsynoptic weather patterns(C21 and C22)arenamed the deep-trough-control(DTr)pattern and thesubtropical-high-maintenance(STH)pattern, respectively.
 |
| Fig. 3. The clustering centers based on KMEANS clustering for 500-hPa geopotential height over East Asia(15°–45° N, 100°–130° E)with the clustering number of(a, b)2 and (c–e)3, respectively. |
Therefore, the synoptic weather patterns of theWC are categorized into three types, namely, DTr, STH, and Typh. Some examples are given in Figs.4–6. The major characteristics of the three synopticweather patterns are described below and summarizedin Table 2.
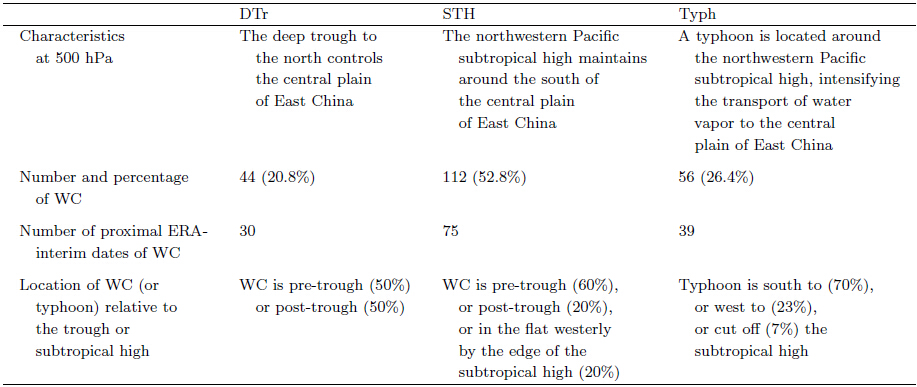 |
The DTr pattern is characterized with a quasisouth-north oriented deep trough extending southwardto about 30°N, controlling the central plain of EastChina. More than half(68%)of the deep troughs extendedfrom a cold vortex, i.e., a cold core cycloniccenter at 500 hPa(e.g., Fig. 4c). There were 44 WCcases detected under this synoptic weather pattern, accountingfor 20.8% of the total WC cases. Among theWC cases under the DTr pattern, 50% occurred pre(i.e., east of)the deep trough(Figs. 4a and 4c), and the other 50% occurred post(i.e., west of)the deeptrough(Fig. 4b). Under the DTr pattern, the centralplain of East China was usually influenced by cold airinvading as suggested by the cold thermal advectionat 500 hPa(e.g., Figs. 4a–c).
 |
| Fig. 4. Examples of environmental fields for the WC under the DTr pattern at(a)0000 UTC 1 July 1998, (b)1800UTC 20 June 2005, and (c)1200 UTC 17 May 2008. Plotted are geopotential height(blue line, with 20-geopotentialmeter intervals; 10 gpm), temperature(red dashed line, with 4-K intervals; K) and temperature advection(shadings ingreen)at 500 hPa, horizontal wind(arrow; only wind speed > 12 m s−1 are shown), θe of 345 K(purple contour)at 850 hPa, water vapor flux(gray shadings)at 925 hPa, and column-integrated precipitable water larger than 55 mm(green line, with 5-mm intervals). Locations of the WC and the central plain of East China are marked by the blue circle and the red rectangle, respectively. |
The STH pattern is featured with the northwesternPacific subtropical high maintaining around thesouth of the central plain of East China, mostly interactingwith a trough to the north. The convergence ofwesterly from the trough and southwest low-level jetfrom the northwest edge of the subtropical high apparentlyplayed an important role in the formation of theWC. This synoptic weather pattern was the most popularamong the three patterns, accounting for 52.8%(112)of the total WC cases under study. Among allWC cases under this synoptic pattern, 60% were locatedpre-trough(e.g., Fig. 5a), 20% post-trough(e.g., Fig. 5b), and 20% in the flat westerly over the northernside of the northwestern Pacific subtropical high(e.g., Fig. 5c). Over the central plain of East China, moisture was abundant(precipitable water > 55 mm), mostly transported by low-level jets that were locatednear the northwest of the northwestern Pacific subtropicalhigh(Fig. 5).
 |
| Fig. 5. As in Fig. 4, but for the WC under the STH pattern at(a)1800 UTC 28 June 2001, (b)0000 UTC 29 June2006, and (c)0000 UTC 12 July 2003, representing the situations of WC being located pre-trough, post-trough, and inflat westerly, respectively. |
For the Typh pattern, the occurrence and developmentof the WC had some relation with typhoonsover Southeast China or adjacent oceans, which probablyintensified the transport of warm and moist airto the region. There are 56 WC cases over the centralplain detected by TRMM under the Typh pattern, accountingfor 26.4% of the total WC occurrences, which was comparable to that under the DTr pattern. Thetyphoons were located south to, west to, or cut acrossthe northwestern Pacific subtropical high. The firstcategory(e.g., Fig. 6a)was the most often(70%), thethird was the least(7%), and the second in between(23%). Under the Typh weather pattern, air over thecentral plain of East China was warm and moist withlarge amount of precipitable water and high θe(Fig. 6), similar to the STH pattern.
 |
| Fig. 6. As in Fig. 4, but for the WC under the Typh pattern at(a)1800 UTC 20 July 2003, (b)0000 UTC 26 August2003, and (c)0000 UTC 28 July 2000, representing the situations of typhoon being located south to, west to, and acrossoff the subtropical high, respectively. |
The number of the WC occurrences over the centralplain of East China during each half-month from16 May to 31 August during 1998–2010 is shown inFig. 7a. On the whole, a small fraction(8 cases; 4%)of the WC occurred in mid-to-end May( and early-tomidJune). The occurrence increased substantially inmid-to-end June(39 cases; 18%)probably owing tonorthward march of the East Asian summer monsoon, which is represented by the high-θe(≥ 340 K)air at850 hPa(Ding and He, 2006)as shown in Fig. 1a.About half(101 cases; 48%)of the WC occurrencesappeared in July with a peak during 1–15 July(53cases), and 26% in August(56 cases), i.e., the WCin the central plain of East China occurred most often from mid June to end of August with the peak inJuly. These results suggest that the WC in this regionwas mostly influenced by the summer monsoon, as the monsoonal air arrived at and moved over atleast part of the region from mid June to end of August(Fig. 1a).
 |
| Fig. 7. Numbers of the WC cases in the central plain ofEast China during each half-month period from 16 May to31 August during 1998–2010:(a)all WC cases and (b)theWC cases under DTr, STH, and Typh synoptic patterns. |
The WC occurrences under the three synopticweather patterns exhibit distinctive subseasonal variations(Fig. 7b). The WC cases of the DTr patternemerged the earliest(8 cases during 16–31 May, 18%of this pattern)among the three weather patterns, and they occurred the most often in the second half of June(16 cases, about 36% of this pattern). For this type ofWC during mid May to July, the subtropical high ridgeline was located at 25°N or further to the south(Figs.8a, 8d, 8g, and 8j), indicating that the monsoonalflows could not significantly impact the central plainof East China; on the other h and , the deep trough inthe north always dominated this region. Moreover, forthe DTr type WC, the western edge point of the subtropicalhigh was mostly located east of 110°E(Figs.8a, 8d, 8g, and 8j), suggesting eastward retreat of thesubtropical high accompanying southward extensionof the deep trough.
 |
| Fig. 8. Joint scatter distributions of the latitude of ridge line over 110°–130°E and the longitude of western ridge pointof the northwestern Pacific subtropical high during the dates when the WC occurred under the DTr, STH, and Typhpatterns, respectively, during(a–c)16 May–15 June, (d–f)16–30 June, (g–i)1–15 July, (j–l)16–31 July, and (m–o)1–31August of 1998–2010. |
Subseasonal variations of the WC occurrence underthe STH pattern(Fig. 7b)present a major peak in the first half of July(35 cases) and a third peakin the second half of June(21 cases). The two peakstogether contributed 50% to the total WC occurrencesunder the STH pattern, i.e., mid June to mid July wasthe main period of the WC occurrence under this pattern.This period corresponds to the Meiyu period ofEast China(Luo et al., 2013), when the northern edgeof the southwesterly low-level jet was located over thecentral plain of East China(Fig. 1a). During thisperiod, the ridge line of the northwestern Pacific subtropicalhigh over 110°–130°E was located over 25°–30°N and the western ridge point of the subtropicalhigh was mostly around or to the east of 110°E(Figs.8e and 8h), favoring transport of moisture to the regionalong the western and northwestern sides of thesubtropical high(Fig. 5). For the STH-type WC casesin mid July to August, the western ridge points of the subtropical high were mostly located more westward(Figs. 8k and 8n)than in mid June to mid July underthe STH pattern(Figs. 8e and 8h) and also than theother two patterns in mid July to August(Figs. 8j, 8l, 8m, and 8o). Its location to the west of 110°E indicatesthat the subtropical high was strong enough to controlall of Southeast China including the central plainof East China. Under this condition in mid July toAugust, transport of water vapor to the central plainof East China was generally weaker than that duringmid June to mid July under the STH pattern.
Most WC cases under the Typh pattern occurredin July and August(Fig. 7b), as the typhoons influencingrainfall over China usually occurred from July(Ren et al., 2002), with 23 cases(41% of this pattern)in July and 28 cases(50% of this pattern)in August.Only 3 WC cases(9%)under this pattern occurred before July. All of the 3 cases belong to the situationof typhoon across off the subtropical high. For somecases under the Typh pattern in mid July to August, the subtropical high ridge line tended to locate to thenorth of 35°N(Figs. 8l and 8o), suggesting that theWCs could form over the central plain of East Chinaunder the effect of typhoon when the subtropical highridge line was located to the north of the region.
5. Occurrences of severe convective weatherWhether the WC is accompanied with severe convectiveweather is worth studying, as severe convectiveweather can cause serious disaster to humanity. Table 3 gives the statistics of severe convective weatherevents, including thunderstorm, gale, hail, and shortdurationheavy rainfall, in the central plain of East China when the WC occurrences were detected byTRMM in the region. Comparisons of occurrences ofthe four kinds of severe convective weather events underthe three synoptic weather patterns are describedbelow in the order of their occurrences from the mostto the least.
Table 3 reveals the following facts:
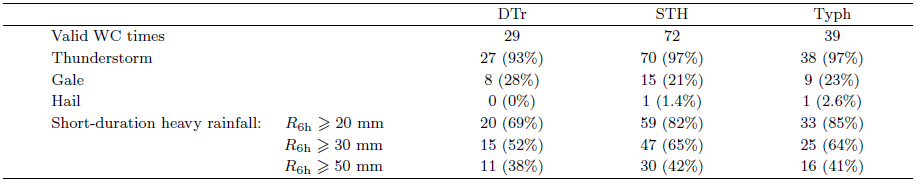 |
1)Thunderstorms occurred during nearly alldates(93%–97%)of the WC under the DTr, STH, and Typh patterns, suggesting that the WC cases were alwaysassociated with thunderstorms even for differentsynoptic weather situations.
2)A majority(69%–85%)of the WC cases inthe central plain of East China occurred with shortdurationheavy rainfall(R6h ≥ 20 mm)over the region.The percentages decreased to 52%–64% for R6h ≥30 mm and further to 38%–42% R6h ≥ 50 mm. Among the three synoptic patterns, the short-duration heavyrainfalls occurred the least often under the DTr pattern.The occurrence frequencies of the short-durationheavy rainfalls with R6h ≥ 20 mm were the largest underthe Typh pattern(85%); that with R6h ≥ 30 mm and R6h ≥ 50 mm was the largest under the STH pattern(65% and 42%, respectively); they were all theleast under the DTr pattern.
3)About a quarter of theWC cases occurred with gale(i.e., surface wind speed > 17 m s−1). Gale occurredthe most often(28%)for the WC under theDTr pattern, the least(21%)under the STH pattern, and in between(23%)under the Typh.
4)Under the three synoptic weather patterns oftheWC, hail occurred very rarely, with only 0%(DTr), 1.4%(STH), and 2.6%(Typh)of the cases.
6. Relation of environmental atmospheric conditions to the convective weatherThis section gives detailed quantitative comparisonsof environmental atmospheric thermodynamicconditions of the WC cases among the three synopticweather patterns(Figs. 9–12), hoping to betterunderst and the similarities and differences in the occurrencesof severe convective weather in associationwith the WC over the central plain of East China underthe three synoptic patterns. Differences and similaritiesin the thermodynamic conditions among thethree synoptic patterns are discussed below in the contextof their possible relation to the various convectiveweather phenomena.
 |
| Fig. 9. Vertical profiles of(a)CAPE and (b)CIN derivedfrom parcel ascents from different vertical levels inthe central plain of East China during the days when theWC was detected by TRMM under the DTr(green), STH(blue), and Typh(red)patterns, respectively. The dashed, solid, and dotted lines represent the 10th, 50th, and 90thpercentile, respectively. The results are based on the ERAinterimdata. |
 |
| Fig. 10.(a)Box- and -whisker plots of precipitable water(mm)in the central plain of East China when the WC wasdetected by TRMM over the region under the DTr, STH, and Typh synoptic weather patterns, as well as for the 39hail events provided by Wu(2010), showing the median(short line in the box), interquartile range(rectangle), and outliers(i.e., the 10th and 90th percentile as whiskers)withthe median values labeled on the right.(b)Vertical profileof θe in the central plain of East China under the threesynoptic weather patterns: DTr(green), STH(blue), and Typh(red), with the dashed, solid, and dotted lines representingthe 10th, 50th, and 90th percentile, respectively.The results are based on the ERA-interim data. |
 |
| Fig. 11.(a)Vertical profiles plotted on the skew T-logpdiagram of the composite temperature(thick solid colorlines) and dew point temperature(thick dashed color lines)in the central plain of East China during the days when theWC was detected by TRMM under the synoptic weatherpatterns of DTr(green lines), STH(blue lines), and Typh(red lines)during 1998–2010.(b)Box- and -whisker plotsof the difference in dew-point depression between 500 and 925 hPa over the central plain of East China under thethree synoptic weather patterns of the WC, showing themedian(short line in the box), interquartile range(rectangle), and outliers(i.e., the 10th and 90th percentile aswhiskers)with the median values labeled on the right. Theresults are based on the ERA-interim data. |
 |
| Fig. 12.(a–c)Joint scatter distributions of freezing level height(Hfz; km) and vertical wind shear between 500 hPa and 10 m above the ground(Vshr; 10-3 s-1)in the condition of CAPE ≥ 1000 J kg-1 over the central plain of EastChina under three synoptic weather patterns:(a)DTr, (b)STH, and (c)Typh. The numbers and percentages at thebottom of the panels are the total numbers and fractions of grid points in the central plain of East China with CAPE≥ 1000 J kg-1 under the corresponding synoptic weather pattern. The four pairs of number and percentage in each ofthe panels represent the number and fraction of grid points located in the four portions of the Vshr–Hfz plane.(d–f)Averaged profiles of temperature(solid lines) and dew point(dashed lines)representing the environmental conditions ofstorms. The lines in gray represent those for the 39 hail-producing storms collected by Wu2010, while the lines in blackare averaged over grid points in the central plain of East China with CAPE ≥ 1000 J kg-1, Hfz ≥ 5 km, and Vshr ≥1 × 10⁻³ s-1 for the WC under the(d)DTr, (e)STH, and (f)Typh synoptic pattern. The results are based on theERA-interim data 0–6 h before the WC occurrence detected by TRMM in the region. |
Development of thunderstorms always needs largeinstable energy and abundant moisture(Doswell, 1987; Johns and Doswell, 1992). The cumulative distributionsof vertical profile of convective available potentialenergy(CAPE)in the central plain of EastChina during the dates when theWC occurrences weredetected over the region by TRMM show that thelargest CAPE existed for the air parcel being lifted from the surface, i.e., the most unstable air was nearthe surface for all the synoptic patterns(Fig. 9a).The median values of CAPE at the surface were about1000 J kg−1, i.e., nearly half of the CAPE values werelarger than 1000 J kg−1, satisfying the instability conditionfor the development of convective storms proposedby Weisman and Klemp(1982). Meanwhile, themedian values of precipitable water under DTr, STH, and Typh were 50.4, 59.9, and 59.3 mm(Fig. 10a), respectively, comparable to the averaged precipitablewater(56 mm)in the environment of squall lines inEast China(Meng et al., 2013), reflecting abundantmoisture supply for the formation of the WC. Therefore, the large instability energy and plentiful moisturein the WC’s environment under all synoptic patternsformed favorable conditions for convection development, supporting the conclusion that the WC caseswere always companied with thunderstorms(Section5).
6.2 Conditions related to short-duration heavy rainfallThe generally abundant moisture(Fig. 10a), combinedwith large CAPE(Fig. 9a), over the central plain of East China for the WC under study was probablythe most important reason for the relatively frequentoccurrence of short-duration heavy rainfall underthe three synoptic patterns(Table 3). This isconsistent with the result of Zheng(2013): the shortdurationheavy rainfall over central East China tendsto be associated with moist environment, i.e., the precipitablewater greater than 50 mm.
However, differences in the vertical distributionsof air temperature and moisture among the three synopticpatterns are noticeable(Figs. 10b and 11), whichprobably contribute to the previously discussed differencein the occurrence of short-duration heavy rainfall.The averaged air temperature and dew point temperatureat each level of the troposphere(1000–200 hPa)under the DTr pattern were lower than those underthe STH and Typh patterns(Fig. 11a), suggestingthat there existed driest and coldest air over the centralplain of East China under the DTr pattern. Theaveraged profiles of air temperature and dew pointtemperature differed little between the STH and Typhpatterns, reflecting their similar temperature and humidityconditions. Comparisons of cumulative distributionsof precipitable water and θe among the three weather patterns(Fig. 10)further confirm the driest and coldest air under the DTr pattern: the median valluesof precipitable water under the DTr pattern was50.4 mm, substantially smaller than the STH(59.9mm) and Typh(59.3 mm)patterns(Fig. 10a); the10th, 50th, and 90th percentiles of the profiles of θeunder the DTr pattern were all lower than those underthe other two patterns(Fig. 10b), probably due tostronger transport of warm and moist air into the centralplain of East China by the low-level flows in associationwith the subtropical high and typhoons underthe latter two patterns. In addition, the largest precipitablewater(59.9 mm) and the highest values of θein the central plain of East China were both found underthe STH pattern, suggesting the highest moistureunder this pattern. Therefore, the driest and coldestair over the central plain of East China under theDTr pattern induced the least occurrences of shortdurationheavy rainfall under this pattern(Table 3), while the most abundant moisture under the STH patternsupported the most occurrences of short-durationheavy rainfall(R6h ≥ 30 mm and R6h ≥ 50 mm; seeTable 3).
6.3 Conditions related to gale formationOccurrence of gale is also related to vertical distributionof air humidity(e.g., Zheng, 2013). The maximumvalues of depression of dew point(T − Td)underthe three synoptic weather patterns were all inthe mid troposphere with the largest under the DTrpattern(Fig. 11a), likely reflecting the largest impactsof dry air invasion in the mid troposphere inthis case. For example, the depression of dew point at500 hPa under the DTr pattern is 9.1 K, which was 2.5 and 3.4 K larger than those under the STH and Typhpattern, respectively. Moreover, the DTr pattern hadlarger differences in depression of dew-point betweenmid and low levels(Fig. 11b), indicating larger differencesof air humidity between the low and mid troposphereunder the DTr pattern than under the othertwo patterns. These features of vertical distribution ofair humidity under the DTr pattern were more favorablefor gale formation, because when the drier air inthe mid troposphere falling down encounters moisterair at the low level, evaporation of the moist air and the resultant latent cooling will increase, and thus thedowndraft will strengthen. This is consistent with the larger occurrences(28%)of gale in association withthe WC under the DTr pattern than under the STH(21%) and Typh(23%)pattern. On the other h and , although the Typh pattern was associated with theleast moisture difference between mid and low levels(Fig. 11b), the occurrence of gale was not the leastunder the Typh pattern, due likely to the accelerationof wind by the effect of typhoon.
6.4 Conditions related to hail occurrenceThree important environmental conditions forpresence of hail at the surface are concluded in previousstudies(Das, 1962; John and Doswell, 1992;Groenemeijer and Delden, 2007):(1)large thermalbuoyancy(represented by CAPE), (2)strong verticalwind shear, and (3)moderate freezing level(Hfz).These have been applied to studies of dynamic and thermodynamic environment for hail in, e.g., northernGreece(Sioutas and Flocas, 2003) and China(Xie et al., 2008). To obtain quantitative environmental conditionsfavoring occurrence of hail in central plain ofEast China, we derived the statistics of three parameters(CAPE, vertical wind shear between 500 hPa and near surface, and Hfz)0–12 h before 39 hail events(Wu, 2010; herein Wu2010)that occurred in the l and region of 30°–40°N and east of 110°E during May–August of 2002–2009 based on sounding data. It isfound that 85% of these hail-producing storms occurredwhen the three conditions were satisfied simultaneously:1)CAPE ≥ 1000 J kg-1, 2)vertical windshear Vshr ≥ 1×10⁻³ s-1, and 3)Hfz ≥ 5.0 km. Thethree parameters were also calculated for theWC casesunder study, by using the 6-h ERA-interim data 3–9h before the WC occurrence detected by TRMM. Figures12a–c show the joint distributions of Hfz and Vshrunder the condition of CAPE ≥ 1000 J kg-1. It isfound that Hfz was mostly above 5 km under the STHpattern(Fig. 12b), which was probably one of themajor reasons for the lack of hail presence at the surfaceunder the STH pattern. However, for the DTr, STH, and Typh pattern, respectively, 55%, 12%, and 19% of the samples satisfied the above three favorableenvironmental conditions(Figs. 12a–c), but withouthail on the ground.
To further explore possible reasons for the lack of hail in these WC samples, averaged profiles of temperature and dew point of these cases were comparedto those of the 39 hail events in Wu2010(Figs. 12d–f). This analysis was conducted because hail in Chinais speculated to be sensitive to air humidity based onthe spatial and seasonal distributions of hail in China(i.e., hail is rare in very wet areas and relatively rareduring rainy seasons; Zhang et al., 2008). The resultsshow that the entire troposphere was much moister forthe WC under the three synoptic patterns(Figs. 12d–f)than that of the 39 hail events of Wu2010. Thisis consistent with the substantially larger precipitablewater for the WC cases(median values of 50.4–59.9mm)than for the 39 hail events(37.5 mm)(Fig. 10a).Therefore, the environmental air seemed to be too humidto form hail when the WC was present over thecentral plain of East China.
7. Concluding remarksIn this study, wide convection(WC)is definedas contiguous convective echoes over 40 dBZ withnonzero near surface rainfall rate from the TRMM PR(Iguchi et al., 2000)over a horizontal area exceeding1000 km2. The flat l and region over the central EastChina(31°–35°N, 114°–121°E; referred to as centralplain of East China for simplicity)sees the maximumfrequency of WC occurrence from the onset of the SCSsummer monsoon to the end of August during 1998–2010. For the WC occurrences over this region, threerepresentative synoptic weather patterns are identified, and occurrences of severe convective weather phenomenain association with the WC are then examined, followed by quantifying the corresponding atmosphericthermodynamic conditions. The major conclusionsare as follows.
(1)Based on the atmospheric circulation at 500hPa when the WC was present in the central plainof East China, the environmental fields of WC areclassified into three weather patterns by using anobjective classification method: deep-trough-in-thenorth(DTr), subtropical-high-maintenance(STH), and typhoon-effect(Typh), accounting for 20.8%, 52.8%, and 26.4%, respectively, of the total WC occurrences.Among the three patterns, the WC under the DTr pattern started to emerge the earliest(16–31May) and occurred the most often in the second halfof June; the WC under the STH pattern had a significantpeak in the first half of July; those under theTyph pattern mainly occurred in July and August.On the whole, the WC in the central plain of EastChina mostly formed under the influence of the Asiansummer monsoon during 16 June–31 August, with amain peak of occurrence in July.
(2)The WC occurrences in the central plain ofEast China were mostly companied with thunderstorms, i.e., for 93%, 97%, and 97% of the times underthe DTr, STH, and Typh pattern. But WC occurredvery rarely(< 3%)with hail on the ground. Underthe various weather patterns, a majority(69%–85%)of the WC cases occurred with short-duration heavyrainfall(R6h ≥ 20 mm), with the DTr pattern seeingthe smallest occurrence. Gales occurred the most often(28%)under the DTr pattern and the least(21%)under the STH pattern.
(3)The large CAPE and abundant moisture inthe environment of the WC made thunderstormsalways accompany. Among the three weather patterns, the DTr pattern featured the least occurrencesof short-duration heavy rainfall, the lowest rainfallamount, and the smallest rainy coverage, probablydue to the driest and coldest air in the region underthis weather pattern; the STH pattern saw themost occurrences of short-time heavy rainfall(R6h≥ 30 mm and R6h ≥ 50 mm)over the region, supportedby the most abundant moisture and warmestair. Gales occurred more often under the DTr patternthan the other two patterns, probably contributed bythe stronger dry air invading in the mid troposphere and the larger difference in depression of dew-pointbetween mid and low troposphere under the DTr pattern.The rare occurrences of hail during theWC caseswere possibly owing to the humid environmental airover the region under the various weather patterns.Under the STH pattern, lack of hail on the groundcould also be contributed by the high freezing levels(mostly above 5 km), which made it hard for hailstones, if any, formed aloft in the storms, to surviveon their way falling toward the ground.
This study provides some statistical characteristicsof synoptic patterns, surface weather phenomenon, and thermodynamic conditions for the WCoccurrences in the flat l and region of central EastChina. Mechanisms that govern the occurrence and development of theWC, as well as the relation betweenthe environmental conditions and severe weather phenomenaare not very clear yet. These will be furtherexplored in future studies using high-resolution observations and numerical simulations.
Acknowledgments. We acknowledge the NationalMeteorological Information Center of China MeteorologicalAdministration for providing the griddedhourly precipitation data and surface meteorologicalobservations, and University of Utah for providing theTRMM data. Many thanks go to Dr. Tao LUO fordownloading the ERA-interim data from the ResearchData Archive maintained by the Computational and Information Systems Laboratory at NCAR, USA. Finally, we thank the anonymous reviewers for helpfulcomments.
| [1] | Anderberg, M. R., 1973: Cluster Analysis for Applica-tions. Academic Press, New York, 359 pp. |
| [2] | Awaka, J., T. Iguchi, and K. Okamoto, 1998: Early results on rain type classification by the Tropical Rainfall Measuring Mission (TRMM) precipitation radar. Proc. 8th URSI Commision F Triennial Open Symposium on Wave Propagation and Re-mote Sensing, Aveiro, Portugal, September 22-25, Universidade de Aveiro, 143-146. |
| [3] | Cecil, D. J., E. J. Zipser, and S. W. Nesbitt, 2002: Reflec-tivity, ice scattering, and lightning characteristics of hurricane eyewalls and rainbands. Part I: Quantita-tive description. Mon. Wea. Rev., 130, 769-784. |
| [4] | Cecil, D. J., S. J. Goodman, D. J. Boccippio, et al., 2005: Three years of TRMM precipitation features. Part I: Radar, radiometric, and lightning characteristics. Mon. Wea. Rev., 133, 543-566. |
| [5] | Das, P., 1962: Influence of wind shear on the growth of hail. J. Atmos. Sci., 19, 407-414. |
| [6] | Dee, D. P., S. M. Uppala, A. J. Simmons, et al., 2011: The ERA-interim reanalysis: Configuration and per-formance of the data assimilation system. Quart. J.Roy. Meteor. Soc., 137, 553-597. |
| [7] | Ding, Y. H., 1994: Monsoons over China. Kluwer Aca-demic, 419 pp. |
| [8] | Ding, Y. H., and J. C. L. Chan, 2005: The East Asian summer monsoon: An overview. Meteor. Atmos. Phys., 89, 117-142. |
| [9] | Ding Yihui and He Chun, 2006: The summer monsoon onset over the tropical eastern Indian Ocean: The earliest onset process of the Asian summer monsoon. Adv. Atmos. Sci., 23, 940-950. |
| [10] | Ding, Y. H., and Z. Wang, 2008: A study of rainy seasons in China. Meteor. Atmos. Phys., 100, 121-138. Doswell, C., 1987: The distinction between large-scale and mesoscale contribution to severe convection: A case study example. Wea. Forecasting, 2, 3-16. |
| [11] | Groenemeijer, P., and A. Delden, 2007: Sounding-derived parameters associated with large hail and tornadoes in the Netherlands. Atmos. Res., 83, 473-487. |
| [12] | Houze, R. A. Jr., D. C. Wilton, and B. F. Smull, 2007: Monsoon convection in the Himalayan region as seen by the TRMM precipitation radar. Quart. J. Roy. Meteor. Soc., 133, 1389-1411. |
| [13] | Huang, R., G. Huang, and Z. Wei, 2004: Climate variations of the summer monsoon over China. East Asian Monsoon. C. P. Chang, Ed, World Scientific,213 pp. |
| [14] | Iguchi, T., T. Kozu, R. Meneghini, et al., 2000: Rain-profiling algorithm for the TRMM precipitation radar. J. Appl. Meteor., 39, 2038-2052. |
| [15] | Johns, R., and C. Doswell, 1992: Severe local storms forecasting. Wea. Forecasting, 7, 588-612. |
| [16] | Kawanishi, T., H. Kuroiwa, M. Kojima, et al., 2000: TRMM precipitation radar. Adv. Space Res., 25,969-972. |
| [17] | Kummerow, C., Y. Hong, W. S. Olson, et al., 2001: The evolution of the Goddard profiling algorithm (GPROF) for rainfall estimation from passive mi-crowave sensors. J. Appl. Meteor., 40, 1801-1820. |
| [18] | Liu, C., 2007: University of Utah TRMM precipitation and cloud feature database: Description version1. 0. University of Utah, 22 pp. [Available online at http://trmm.chpc.utah.edu/docs/trmm-database-description-v1.0.pdf.] |
| [19] | Liu, C., E. Zipser, D. J. Cecil, et al., 2008: A cloud and precipitation feature database from 9 years of TRMM observations. J. Appl. Meteor. Climatol.,47, 2712-2728. |
| [20] | Luo, Y., H. Wang, R. Zhang, et al., 2013: Comparison of rainfall characteristics and convective properties of monsoon precipitation systems over South China and the Yangtze and Huai River basin. J. Climate,26, 110-132. |
| [21] | Meng, Z., D. Yan, and Y. Zhang, 2013: General features of squall lines in East China. Mon. Wea. Rev., 141,1629-1647. |
| [22] | Ren Fumin, G. Byron, and E. David, 2002: Typhoon impacts on China's precipitation during 1957-1996. Adv. Atmos. Sci., 19, 943-952. |
| [23] | Romatschke, U., S. Medina, and R. A. Houze, 2010: Regional, seasonal, and diurnal variations of extreme convection in the South Asian Region. J. Climate,23, 419-439. |
| [24] | Simmons, A. J., S. M. Uppala, D. Dee, et al., 2007: ERA-Interim: New ECMWF Reanalysis Products from 1989 Onwards. Newsletter 110-Winter 2006/07, ECMWF, 11 pp. |
| [25] | Sioutas, M., and H. Flocas, 2003: Hailstorms in northern Greece: Synoptic patterns and thermodynamic en-vironment. Theor. Appl. Climatol., 75, 189-202. |
| [26] | Wang, B., Lin Ho, Y. S. Zhang, et al., 2004: Definition of the South China Sea monsoon onset and com-mencement of the East Asian summer monsoon. J. Climate, 17, 699-710. |
| [27] | Weisman, M. L., and J. B. Klemp, 1982: The dependence of numerically simulated convective storms on ver-tical wind shear and buoyancy. Mon. Wea. Rev.,110, 504-520. |
| [28] | Wu Jiankun, 2010: Preliminary analysis of environmental conditions and radar echo features of hail in China. Master dissertation, Chinese Academy of Meteoro-logical Sciences, Beijing, 105 pp. (in Chinese) |
| [29] | Xie, B. G., Q. H. Zhang, and Y. Q. Wang, 2008: Trends in hail in China during 1960-2005. Geophys. Res. Lett., 35, L13801, doi: 10.1029/2008GL0304067. |
| [30] | Zhang, C., Q. Zhang, and Y. Wang, 2008: Climatology of hail in China: 1961-2005. J. Appl. Meteor., 47,795-804. |
| [31] | Zheng Linlin, 2013: The characteristics of mesoscale con-vective systems over Yellow River and Huai River basins. Ph. D. dissertation, Institute of Atmospher-ic Physics, Chinese Academy of Sciences, 152 pp. (in Chinese) |
| [32] | Zheng, L., J. Sun, X. Zhang, et al., 2013: Organizational modes of mesoscale convective systems over central East China. Wea. Forecasting, 28, 1081-1098. |
| [33] | Zipser, E., D. J. Cecil, C. Liu, et al., 2006: Where are the most intense thunderstorms on earth. Bull. Amer. Meteor. Soc., 87, 1057-1071. |