 2014, Vol. 28
The Chinese Meteorological Society
Article Information
- CHEN Bin, ZHANG Peng, ZHANG Beidou, JIA Rui, ZHANG Zhijuan, WANG Tianhe, ZHOU Tian. 2014.
- An Overview of Passive and Active Dust Detection Methods Using Satellite Measurements
- J. Meteor. Res., 28(6): 1029-1040
- http://dx.doi.org/10.1007/s13351-014-4023-5
Article History
- Received February 26, 2014;
- in final form July 24, 2014


2 National Satellite Meteorological Center, China Meteorological Administration, Beijing 100081
Arid and semi-arid regions are the main sourcesof dust aerosols(one of the principal troposphericaerosols), and such areas are mainly distributed inNorth Africa, Central Asia, East Asia, and Australia(Huang et al., 2010; Li et al., 2010; Shao et al., 2011;Myhre et al., 2013). It is estimated that dust aerosolsof 1000-3000 Tg are emitted into the atmosphere annually, which is about half of the total quantity oftropospheric aerosols(Zhang et al., 1997, 2003b; Zender et al., 2004; Wang et al., 2012).
Dust aerosols directly affect the earth's atmospheric radiation balance by absorbing and scattering solar radiation, and by absorbing and re-emittingoutgoing longwave radiation(Tegen, 2003; Fu et al., 2009; Huang et al., 2009; Zhang et al., 2010; Hansell et al., 2012; Zhao et al., 2013). They can also indirectlyaffect the climatic system by acting as cloud condensation nuclei and altering the microphysical properties, albedo, and lifetime of clouds(Albrecht, 1989; Yin et al., 2002; Huang et al., 2006a, b; Su et al., 2008; Wang W. C. et al., 2010). Dust aerosols are light-absorbingaerosols that can absorb solar radiation and change theradiative heating structure of the atmosphere, accelerate cloud droplet evaporation, reduce cloud water content, and semi-directly affect earth's climate systems(Huang et al., 2006c). Dust aerosols also have negativeimpacts on urban air quality and human health, and they have important effects on marine ecosystems and biogeochemical cycles when transported by weathersystems(Gong et al., 2003; Zhang et al., 2003a; Yin and Chen, 2007; Huang et al., 2008a; Liu Z. Y. et al., 2008; Wang and Huang, 2009).
Radiative forcing due to dust aerosols is one of thelargest sources of uncertainties in global and regionalclimate change; thus, identifying dust aerosols is thefirst step in underst and ing and estimating the direct, indirect, and semi-direct effects of dust aerosols in climate change research(Mao et al., 2002; Zhang and Christopher, 2003; Wang et al., 2006, 2007; Zhang, 2007; Zhang Hua et al., 2007; Shi et al., 2008; Wang H. et al., 2010). Satellite remote sensing technologyis much more effective in monitoring, tracking, and analyzing dust weather than traditional ground-basedobservations that are restricted by many factors, e. g., the inhomogeneous location of ground-based observingsystem, harsh environments, and insu±cient numberof observing stations(Lu and Wu, 2000; Hu Xiuqing et al., 2003, 2007; Lu et al., 2012). For example, using space-borne lidar, Huang et al. (2007a)recordedabout 50 dust plumes from June to September 2006, an increase of almost five times of the events recognized by the traditional ground-based methods.
There are principally two different methods fordust detection using satellite measurements: active and passive. Shenk and Curran(1974)developed a visible and infrared method using satellite data for monitoring dust storms over water. Using brightness temperature differences(BTDs)between the 8- and 11-µmchannels and the 11- and 12-µm channels as well, dustcan be detected under clear sky over both ocean and l and . The infrared(IR)BTD method is very effective for the detection of dust storms(Legrand et al., 1985; Roskovensky and Liou, 2003, 2005; Zhang et al., 2006). Huang et al. (2007b)developed a new microwave method using the Advanced Microwave Scanning Radiometer(AMSR-E)onboard the Aqua satellite. The microwave method is capable of identifying dust storms under cloud, which could not be detected by using the visible or IR methods. The Cloud-Aerosol Lidar and Infrared Pathfinder Satellite Observations(CALIPSO)platform was launched successfully by NASA in 2006(Winker et al., 2006; Hu et al., 2007a, b), and it provides a wealth of information ondust aerosols(Liu D. et al., 2008; Chen et al., 2013). The primary payload on the CALIPSO satellite is atwo-wavelength, polarization-sensitive backscatter lidar known as the Cloud-Aerosol Lidar with Orthogonal Polarization(CALIOP). CALIOP is unique inits ability to measure vertical profiles of both clouds and aerosols globally on high resolutions(Winker et al., 2004; Hu et al., 2009, 2010; Zhang et al., 2011). The active lidar-based method using CALIOP dataadopts the five-dimensional(5D)probability distribution functions(PDFs)of attenuated backscatter, layer-integrated color ratio, mid-layer altitude, volumedepolarization ratio, and mid-layer temperature(Liu et al., 2004, 2009). Chen et al. (2010)developed acombined lidar(active) and infrared(passive)measurement(CLIM)method to detect dust aerosols.
In this paper, an overview of the passive and active methods using satellite measurements for dust detection is presented. Section 2 discusses the passiveremote sensing methods for dust detection, includingthe visible and infrared(VIR), thermal infrared(TIR), and microwave polarized index(MPI)methods. Theactive lidar-based method is described in Section 3, and the CLIM method is outlined in Section 4. Finally, the conclusions and discussion are presented inSection 5. 2. Passive remote sensing methods for dust detection2. 1 Visible and infrared(VIR)method
Tanre and Legr and (1991) presented two approaches using satellite-derived IR imagery and contrast reduction in visible imagery to retrieve desertaerosol optical thickness over l and . Using Meteosatvisible data, Dulac et al. (1992)developed a methodto calculate aerosol optical depth over the sea, basedon a desert aerosol model and an earth-atmosphereradiative transfer model. Kaufman et al. (2000)useda combination of visible and mid-IR solar channels todetect dust over the desert. Luo et al. (2003)presented a structure for a new index of comparable duststorm intensities; the structure helped resolve manyunmatched problems by exploiting the near-infrared1. 6-µm wavelength. Miller(2003)developed a newmethod for identifying dust over water and l and backgrounds using the multiple visible and reflective IRchannels available from Moderate Resolution ImagingSpectrometer(MODIS). Hutchison et al. (2008)presented a new approach for differentiating clouds and heavy aerosols using automated cloud classification algorithms, which relied greatly on the data collected inthe 0. 41-µm b and width. Hu et al. (2008)described anoperational retrieval algorithm for dust storms fromthe FY-2C stretched-visible and infrared spin-scan radiometer developed at the National Satellite Meteorological Center of China. Zhao(2012)applied a dustdetection system based on the analysis of reflectance(or radiance)in the visible channels or of brightnesstemperature(BT)in the IR channels, by inferring thesignature of dust particles from the magnitude of thedifference in reflectance and /or BTs in the selectedchannels.
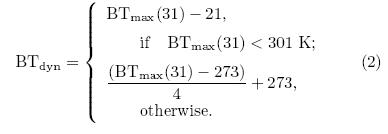
Miller(2003)developed a passive VIR techniqueto enhance the detection of airborne dust over water and l and during daytime. The dust enhancement overl and can be expressed as Dlnd as follows:
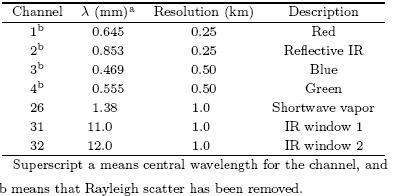
where L1, L2, L3, and L4 are specified in Table 1. The calculation of L1 relies on the following empiricalrelation, All BTs are given in Kelvin and BTmax is the maxi-mum pixel temperature in the current scene. The re-flectivity(R)values listed in Table 1 are normalized. Table 2 lists the MODIS channels used in Table 1 and Eq. (2)(Miller, 2003).

Tao et al. (2005)also proposed a new method toautomatically detect dust storms by means of a decision tree classifier based on the data from MODIS visible b and s. Firstly, the training datasets of the decisiontree classifier were extracted through visual identification from the MODIS data and hierarchical classifiers were then established according to the spectralcharacteristics of the major reflecting objects. Secondly, the spectral characteristics of the MODIS training datasets were analyzed. The difference betweenthe reflectance at 0. 47 and 2. 1 µm was used to generate the preliminary level split of the decision tree. Then, b and 7(2. 1 µm)was used to separate the duststorm from the other l and -cover classes. The weaknesses of this method were in the accumulated snowarea and the weaker floating dust regions, which couldnot be easily differentiated from the surface. 2. 2 Thermal infrared(TIR)method
Ackerman(1997)investigated the method in detection of volcanic and soil-derived aerosols using infrared observations only at the approximate wavelengths of 8. 5, 11. 0, and 12. 0 µm, taking advantageof the better dust identification over bright surfaces and during night in comparison with the visible technique. Wald et al. (1998)presented a technique ofmonitoring mineral dust over desert based on particle size dependence using TIR b and s. The bi-spectralIR method, which is based on the particle size dependence of the TIR emissivity spectrum of silicateminerals, is sensitive to dust loading, but not verysensitive to dust height. Chomette et al. (1999)investigated an alternative technique using satellite observations. The infrared difference dust index, derived from images obtained from the Meteosat 10. 5- and 12. 5-µm channels, describes the dust loading overthe Saharan-Sahelian region. Luo et al. (2003)presented a new approach to identify and extract duststorm information using multi-source remote sensingin the 11- and 12-µm spectrum. The proposed approach demonstrated meaningful results in identifying and extracting dust storm information; however, it could not indicate dust storm intensity. Yan et al. (2005)developed a possible method for detecting dustoutbreaks by investigating the TIR temperature difference. However, the TIR method is affected greatlyby water vapor content, and thus can only be usedto detect significant dust events when the water vapor content is large. Roskovensky and Liou(2005)presented a remote sensing method for detecting and differentiating dust from cirrus through successive employment of the newly developed D-parameter in combination with the P-parameter, which is defined in aprevious paper(Roskovensky and Liou, 2003). Use ofthe P-parameter allows cirrus clouds to be differentiated from lower clouds, clear sky, and aerosol-filledpixels. Evan et al. (2006)improved on the separationof clouds and airborne dust by developing a new algorithm for over-water dust detection based on the evaluation of the aerosol detection technique that was applied to the AVHRR imager utilizing the 0. 63-, 0. 86-, 11. 00-, and 12. 00-µm channels. Liu Y. et al. (2013)developed a dynamic reference BT difference(DRBTD)algorithm to detect dust by removing the influence ofthe observed temperature on the BTD.
Simply, the dust index(DI)by the TIR method(DITIR)can be defined as follows:
where BTD11-12 is the brightness temperature difference between the 10. 60- and 12. 05-µm channels, BTD8-11 is the brightness temperature difference between the 8. 65- and 11. 60-µm channels, and A0, A1, and A2 are coe±cients(Chen et al., 2010).
Zhang et al. (2006, 2007)also used three MODISthermal channels, i. e., 8. 5(channel 29), 11. 0, (channel 31), and 12. 0 µm(channel 32)to identify duststorms. From the analysis of observation data, a duststorm mask algorithm used for the identification ofdust storm outbreaks and their spatial extent was developed. The mask algorithm was based on the thresh-old BTD11-12 and BTD8-11. It could be used in bothdaytime and nighttime conditions for automatic identification of the dust storm. BT11 and BTD11-12 arecontrolled significantly by the underlying surface temperature(Ts), effective top temperature of the dustlayer(Tc), dust aerosol loading, particle size distribution of the dust aerosol, and the refractive index of thedust aerosol. When Ts, Tc, and the refractive indexare fixed, BT11 exhibits an almost linear relationshipwith dust optical thickness and BTD11-12 presents analmost linear relationship with dust particle size. 2. 3 Microwave polarized index(MPI)method
Both the VIR and TIR methods are very effectivein detecting dust storms over water and l and surfaces;however, they are unable to penetrate ice clouds and thus, cannot identify dust covered by such clouds(orthe cloud over dust(COD)region). To address thisdi±culty, Huang et al. (2007b)developed a methodusing the observations of AMSR-E onboard the Aquasatellite. The AMSR-E is a passive microwave radiometer sensing in six frequencies ranging from 6. 9to 89. 0 GHz and each frequency has radiation thatis polarized both horizontally and vertically, so thismethod is called the microwave polarized index(MPI)method. The MPI method is very successful in thedetection of dust storms under cloud.
The MPI method is based on horizontally and vertically polarized microwave BTDs(ΔTb = Tbv-Tbh)in the 89. 0- and 23. 8-GHz channels. The parameterΔTb for the six frequencies from desert and grassl and surfaces in the dust-free cloud(CLD) and COD regions were compared. The results showed that theaveraged ΔTb value of the COD and CLD regions issignificantly different for all frequency b and s, and thatthe ΔTb values of the CLD regions are much smallerthan those of the COD for desert regions. The ΔTbvalue of the COD region is also quite different fromthat of clear sky conditions. The ΔTb value of theCOD region is lower for clear sky conditions and forgrassl and surfaces. The relationship between ΔTb inthe COD region and in clear sky conditions is complicated, but such a relationship at 89 GHz is similarto that over the desert surface. An analysis of theCOD region revealed that the mean ΔTb89(20. 75 K)is about 8. 07 K less than the average ΔTb23:8 value(28. 82 K) and much larger than that in the CLD region, for which their st and ard deviations are 6. 63 and 6. 92 K, respectively. Huang et al. (2007b)indicatedthat the differences between ΔTb89 and ΔTb23:8 couldbe used to detect dust storms. They defined the MPIfor identifying dust storms, which can be written asfollows:
where Tb89v and Tb89h, and Tb23:8v and Tb23:8hare the vertically and horizontally polarized BTDs at 89 and 23. 8 GHz, respectively. A threshold of MPI of-7. 0 K means that it is able to identify about 85%of the COD and pure dust pixels. The MPI methodcould be easily adapted for detecting dust stormsby other microwave sensors, e. g., the Advanced Microwave Sounding Unit.
Ge et al. (2008)also analyzed eight cases ofAMSR-E BTs of dust storms over the TaklimakanDesert between 2003 and 2006, and investigated theimpact of dust on microwave radiation using a radiative transfer model. They found that the BTs at highmicrowave frequencies are depressed because of dustscattering, based on both the observed and the simulated results. 3. Active lidar remote sensing method
The active CALIPSO lidar-based method can bedivided into two parts: the selective iterated boundarylocator(SIBYL)algorithm and the scene classificationalgorithm(SCA). The SIBYL is adapted to detect afeature using a dynamic threshold scheme(Vaughan et al., 2004). The SCA identifies a feature as eithercloud or aerosol based on two-wavelength backscatterlidar profiles(Liu et al., 2005).
Liu et al. (2004)derived an operation algorithm, which is based either on a single testor on multiple tests that use a confidence function(f-function)constructed from one-dimensionalor multiple-dimensional PDFs to distinguish betweencloud and aerosol. Version 2 of the CALIPSO lidarbased method uses three-dimensional PDFs: the layeraveraged attenuated backscatter coe±cient, layer-integrated 1064- to 532-nm volume color ratio, and mid-layer altitude.
The three-dimensional PDFs(f)can be describedby the following equation:
where β is the layer-mean attenuated backscatter at532 nm, χ is the layer-integrated 1064- to 532-nm volume color ratio, z is the layer center altitude, Pcloud and Paerosol are the noise-affected PDF for cloud and aerosol, respectively, and Ks is a scale factor thatquantifies the relative occurrence frequency of thecloud and aerosol classes. The noise-free PDFs areretrieved from a previously developed database. Thenoise-affected PDF is the convolution of the noise-freePDF and the noise distribution. Further details canbe found in Liu et al. (2004). The current lidar-basedmethod(version 3. 30)uses five-dimensional PDFs, adding the volume depolarization ratio and mid-layertemperature(Liu et al., 2009).
Negative values of f in Eq. (5)indicate aerosol and positive values represent cloud. The magnitude offassigns a confidence classification, where a value ofzero indicates no classification. Generally, the layer isvery likely to be detected as aerosol, which has smallervalues of both mean attenuated backscatter and meanattenuated volume color ratio; otherwise, the layer isclassified as cloud.
The volume depolarization ratio is a useful indicator for identifying irregular particles. The larger thevalue, the more obviously non-spherical the particle is, and thus, it can be used to differentiate between ice and water clouds, and between dust layers and spherical aerosols.
To simplify the lidar-based methods, a dust index(DILidarM)can be defined as:
where β and χ are the same as in Eq. (5), δ isthe layer-mean depolarization ratio(layer-integratedperpendicular-to-parallel attenuated backscatter at532 nm), ε is the feature layer-top altitude, ζ is thefeature layer-base altitude above mean sea level, and B0 to B5 are coe±cients(Chen et al., 2010).
In addition, other researchers have attempted toidentify dust aerosols using CALIPSO lidar data. Ma and Gong(2012)used the Support Vector Machine(SVM)classifier to improve the accuracy of thick dust and cloud classification. They validated the feasibility of this method and made a thorough study of theclassification results using different feature vectors and samples. Through the accuracy testing, they foundthat by increasing the number of samples, the SVMmethod produces better results, and the feature spacethat includes the depolarization ratio is more stable. Zhou et al. (2013)also developed a simple method fordetecting dust plumes using CALIPSO measurementsbased on the relationship between the layer-integratedattenuated backscatter coe±cient and layer-integrateddepolarization ratio of dust plumes and cloud. The relationship indicated dust with a low layer-integratedattenuated backscatter coe±cient and a wide range oflayer-integrated depolarization ratio; otherwise, it indicated water cloud with a positive slope and ice cloudwith a negative slope(Hu et al., 2007b). The differencebetween the dust and cloud could be used to separatedust plumes from cloud. 4. Combined active and passive measurementmethod
As noted by Liu et al. (2004), the signals fromCALIOP of dense dust and thin cloud are very similar and the lidar-based method misidentifies most densedust over the source regions as cloud; however, it c and etect thin dust layers accurately. Conversely, the TIRmethod can detect dense dust accurately. To addressthese problems of the TIR and lidar-based methods, the new CLIM method using CALIPSO active lidar and passive Infrared Imaging Radiometer(IIR)measurements was developed(Chen et al., 2010). TheCLIM method exploits the advantages of both TIRmeasurements to discriminate between ice cloud and dense dust layers, and lidar measurement to detectthin dust and water cloud layers.
The dust index using the CLIM method(DICLIM)can be expressed as:
where BTD11-12 and BTD8-11 are the same as in Eq. (3); β, δ, χ, ζ, and ε are the same as in Eq. (6); and C0to C7 are coe±cients. The first part of Eq. (7)is fromthe passive TIR method and the last part from the active lidar-based method. Table 3 lists the coe±cientsin Eq. (7), as determined by Fisher discriminate analysis using data from the Taklimakan Desert in spring2007(Chen et al., 2010).
The results of the CLIM method were confirmedby other independent measurements from CloudSat and MODIS, as well as from surface stations. Then, they were validated by independent data over the Tak-limakan Desert in spring 2008. The results showedthat the misclassified dust ratio of CLIM was muchlower(6. 7%)than the lidar dust layer detection method, which, based solely on lidar measurement, misclassified about 43% of the dust layers(mainly densedust layers)over the Taklimakan Desert as cloud layers. The CLIM method detects not only dust aerosols, but also clouds over the Taklimakan Desert more accurately during the daytime of spring(Chen et al., 2010). 5. Conclusions and discussion
Dust aerosols emitted from deserts and surrounding areas(Fu et al., 2008, 2012; Huang et al., 2008b;Wang et al., 2008; Wang X. et al., 2010; Liu et al., 2011; Liu Y. Z., 2013)are one of the largest sourcesof uncertainties in global and regional climate change(Zhang et al., 2005a, b; Ma et al., 2007; Yin et al., 2009; Zhang et al., 2009; Wang W. C. et al., 2010). Detection of dust aerosol plays an important role inclimate change research. In this paper, we summarized the passive and active techniques using satellitemeasurements for dust detection, including the VIR, TIR, MPI, lidar-based, and CLIM methods.
The VIR method identifies dust depending on surface reflectance and the radiation background(Miller, 2003); thus, it is only applicable during daytime. TheTIR method uses thermal infrared observations in thewavelengths of 8. 5, 11. 0, and 12. 0 µm, which providescoverage over bright surfaces and during night. Theabsorption by atmospheric gases at 11 and 12 µm issmall, dust storms have higher emissivity at 12 µmthan at 11 µm, and BTD11-12 is typically negativefor dust storms and positive for ice clouds(Shenk and Curran, 1974; Ackerman, 1997). The TIR methodhas been used widely to differentiate dust from otheraerosols and cloud. Errors in using the TIR methodare due to surface temperature, surface emissivity uncertainty, and atmospheric temperature profiles, butthe impact of these factors on TIR quantitative remotesensing technology is relatively small in dust storms( Zhang Peng et al., 2007).
Both the VIR and TIR methods are unable topenetrate ice clouds and cannot detect dust beneathclouds. To overcome this problem, Huang et al. (2007b)developed an MPI method that used a threshold of MPI of -7. 0 K, which identified about 85% ofthe dust below cloud cases. The MPI method can beeasily adapted for other microwave sensors(e. g., theAdvanced Microwave Sounding Unit)to detect duststorms.
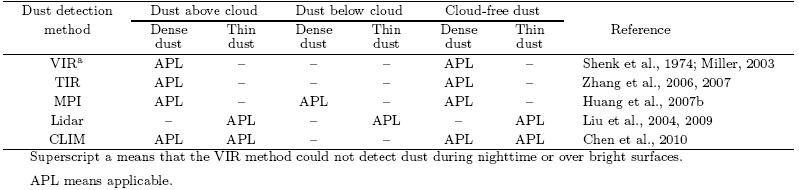
CALIOP is unique in measuring high-resolutionvertical profiles of both clouds and aerosols fromspace, and it provides a wealth of information ondust aerosols(Huang et al., 2008b; Liu et al., 2008a). The active lidar-based method using CALIOP datais based on three-dimensional PDFs of attenuatedbackscatter, layer-integrated color ratio, and mid-layeraltitude(Liu Z. et al., 2004). The current lidar-basedmethod(version 3. 30)uses five-dimensional PDFs, adding the volume depolarization ratio and mid-layertemperature(Liu et al., 2009). However, the signals of dense dust and thin cloud are very similarwith CALIOP, and the lidar-based method misidentifies dense dust and thin cloud, especially over thedust source regions(Liu Z. et al., 2004). To address this problem, Chen et al. (2010)developed theCLIM method to detect dust aerosols using simultaneous CALIOP and IIR measurements provided byCALIPSO. Thus, the CLIM method exploits the advantages of both the TIR measurements to differentiate between ice cloud and dense dust layers, and the lidar measurement to detect thin dust and watercloud layers. The results showed that the misclassifieddust ratio of CLIM was much lower(6. 7%)than thelidar-based method(43%; mainly dense dust layersas cloud layers)over the Taklimakan Desert duringspring 2008. The CLIM method can be equally wellapplied over the Sahara Desert(Liu J. et al., 2014). The advantages and disadvantages of these methodsfor detecting dust are summarized in Table 4.
The CLIM method combines active lidar and passive IIR measurements to identify dust. The resultsshowed that the misclassified dust ratio of the CLIMmethod was significantly reduced. Therefore, a concept module for an integrated multi-sensors dust detection system is proposed; the system includes datafrom CALIPSO, CloudSat, IIR, MISR(Multi-angleImaging SpectroRadiometer), MODIS, and AMSR-E. The system combines the advantages of each sensor and overcome some of the inherent weaknesses posedby single-detector methods, as shown in Figs. 1a and 1b. The system integrates visible, IR, microwave, and active lidar-based measurements, in combination withlidar and microwaves to detect dust below clouds, and with lidar and visible or IR measurements to identifydust that exists in cloud-free regions and above clouds.
 |
| Fig. 1. Concept module of dust detection system integrat-ing visible, IR, microwave, and active lidar measurements. |
| [1] | Ackerman, S. A., 1997: Remote sensing aerosols using satellite infrared observations. J. Geophys. Res.,102, 17069-17079. |
| [2] | Albrecht, B. A., 1989: Aerosols, cloud microphysics, and fractional cloudiness. Science, 245, 1227-1230. |
| [3] | Chen, B., J. Huang, P. Minnis, et al., 2010: Detection of dust aerosol by combining CALIPSO active li-dar and passive IIR measurements. Atmos. Chem. Phys., 10, 4241-4251, doi: 10.5194/acp-10-4241-2010. |
| [4] | Chen, S., J. P. Huang, C. Zhao, et al., 2013: Modeling the transport and radiative forcing of Taklimakan dust over the Tibetan Plateau: A case study in the summer of 2006. J. Geophys. Res., 118, 797-812, doi: 10.1002/jgrd.50122. |
| [5] | Chomette, O., M. Legrand, and B. Marticorena, 1999: Determination of the wind speed threshold for the emission of desert dust using satellite remote sensing in the thermal infrared. J. Geophys. Res., 104, 31207-31215. |
| [6] | Dulac, F., D. Tanre, G. Bergametti, et al., 1992: As-sessment of the African airborne dust mass over the western Mediterranean Sea using meteosat data. J. Geophys. Res., 97, 2489-2506. |
| [7] | Evan, A. T., A. K. Heidinger, and M. J. Pavolonis, 2006: Development of a new over-water advanced very high resolution radiometer dust detection algorithm. Int. J. Remote Sens., 27, 3903-3924. |
| [8] | Fu, P. J., J. Huang, C. Li, et al., 2008: The properties of dust aerosol and reducing tendency of the dust storms in Northwest China. Atmos. Environ., 42, 5896-5904, doi: 10.1016/j.atmosenv.2008.03.041. |
| [9] | —-, S. Y. Zhong, J. P. Huang, et al., 2012: An obser-vational study of aerosol and turbulence properties during dust storms in Northwest China. J. Geophys. Res., 117, D09202, doi: 10.1029/2011JD016696. |
| [10] | Fu, Q., T. Thorsen, J. Su, et al., 2009: Test of Mie-based single-scattering properties of non-spherical dust aerosols in radiative flux calculations. J. Quart. Spectrosc. Radiat. Transfer, 110, 1640-1653, doi: 10.1016/j.jqsrt.2009.03.010. |
| [11] | Ge, J., J. Huang, F. Weng, et al., 2008: Effects of dust storms on microwave radiation based on satellite observation and model simulation over the Takla-makan desert. Atmos. Chem. Phys., 8, 4903-4909. |
| [12] | Gong, S. L., X. Y. Zhang, T. L. Zhao, et al., 2003: Characterization of soil dust aerosol in China and its transport and distribution during 2001 ACE-Asia. 2: Model simulation and validation. J. Geophys. Res., 108, ACH4.1-ACH4.19, doi: 10.1029/2002JD002633. |
| [13] | Hansell, R. A., S. C. Tsay, N. C. Hsu, et al., 2012: An assessment of the surface longwave direct ra-diative effect of airborne dust in Zhangye, China, during the Asian monsoon years field experiment (2008). J. Geophys. Res., 117, D00K39, doi: 10.1029/20111JD017370. |
| [14] | Hu Xiuqing, Lu Naimeng, Qiu Hong, et al., 2003: Dust-storm monitoring using geostationary meteorological satellites. Climatic Environ. Res., 8, 101-106. (in Chinese) |
| [15] | —-, —-, and Zhang Peng, 2007: Remote sensing and detection of dust storm in China using the ther-mal bands of geostationary meteorological satellite. Quart. J. Appl. Meteor., 18, 266-275. (in Chinese) |
| [16] | —-, —-, T. Niu, et al., 2008: Operational retrieval of Asian sand and dust storm from FY-2C geostation-ary meteorological satellite and its application to real time forecast in Asia. Atmos. Chem. Phys., 8, 1649-1659. |
| [17] | Hu, Y., M. Vaughan, Z. Liu, et al., 2007a: The depolarization-attenuated backscatter relation: CALIPSO lidar measurements vs. theory. Opt. Express, 15, 5327-5332. |
| [18] | —-, —-, C. Mcclain, et al., 2007b: Global statistics of liquid water content and effective number con-centration of water clouds over ocean derived from combined CALIPSO and MODIS measurements. Atmos. Chem. Phys., 7, 3353-3359. |
| [19] | —-, D. Winker, M. Vaughan, et al., 2009: CALIPSO/CALIOP cloud phase discrimination al-gorithm. J. Atmos. Oceanic Technol., 26, 2293-2309. |
| [20] | Hu, Y. X., S. Rodier, K. M. Xu, et al., 2010: Occurrence, liquid water content, and fraction of supercooled water clouds from combined CALIOP/IIR/MODIS measurements. J. Geophys. Res., 115, D00H34, doi: 10.1029/2009JD012384. |
| [21] | Huang, J. P., Y. Wang, T. Wang, et al., 2006a: Dusty cloud radiative forcing derived from satellite data for middle latitude regions of East Asia. Prog. Nat. Sci., 16, 1084-1089. |
| [22] | —-, P. Minnis, B. Lin, et al., 2006b: Possible influ-ences of Asian dust aerosols on cloud properties and radiative forcing observed from MODIS and CERES. Geophys. Res. Lett., 33, L06824, doi: 10.1029/2005GL024724. |
| [23] | —-, B. Lin, P. Minnis, et al., 2006c: Satellite-based as-sessment of possible dust aerosols semi-direct effect on cloud water path over East Asia. Geophys. Res. Lett., 33, L19802, doi: 10.1029/2006GL026561. |
| [24] | —-, P. Minnis, Y. H. Yi, et al., 2007a: Summer dust aerosols detected from CALIPSO over the Tibetan Plateau. Geophys. Res. Lett., 34, L18805, doi: 10.1029/2007GL029938. |
| [25] | —-, J. Ge, and F. Weng, 2007b: Detection of Asia dust storms using multisensor satellite measurements. Remote Sens. Environ., 110, 186-191. |
| [26] | —-, P. Minnis, B. Chen, et al., 2008a: Long-range transport and vertical structure of Asian dust from CALIPSO and surface. J. Geophys. Res., 113, D23212, doi: 10.1029/2008JD010620. |
| [27] | —-, W. Zhang, J. Zuo, et al., 2008b: An overview of the semi-arid climate and environment research obser-vatory over the Loess Plateau. Adv. Atmos. Sci., 25, 906-921, doi: 10.1007/s00376-008-0906-7. |
| [28] | —-, Q. Fu, J. Su, et al., 2009: Taklamakan dust aerosol radiative heating derived from CALIPSO obser-vations using the Fu-Liou radiation model with CERES constraints. Atmos. Chem. Phys., 9, 4011-4021. |
| [29] | —-, P. Minnis, H. Yan, et al., 2010: Dust aerosol ef-fect on semi-arid climate over Northwest China de-tected from A-Train satellite measurements. Atmos. Chem. Phys., 10, 6863-6872. |
| [30] | Hutchison K., B. Iisager, T. Kopp, et al., 2008: Distin-guishing aerosols from clouds in global, multispectral satellite data with automated cloud classification al-gorithms. J. Atmos. Oceanic Technol., 25, 501-518. |
| [31] | Kaufman, Y., K. Arnon, and T. Didier, 2000: Detec-tion of dust over the desert by EOS-MODIS. IEEE Trans. Geos. Remote Sens., 38, 525-531. |
| [32] | Legrand, M., J. J. Bertrand, and M. Desbois, 1985: Dust clouds over West Africa: A characterization by satel-lite data. Ann. Geophys., 3, 777-783. |
| [33] | Li, C., S. C. Tsay, J. S. Fu, et al., 2010: Anthropogenic air pollution observed near dust source regions in north-western China during springtime 2008. J. Geophys. Res., 115, D00K22, doi: 10.1029/2009JD013659. |
| [34] | Liu, D., Z. Wang, Z. Y. Liu, et al., 2008: A height resolved global view of dust aerosols from the first year CALIPSO lidar measurements. J. Geophys. Res., 113, D16214, doi: 10.1029/2007JD009776. |
| [35] | Liu, J., B. Chen, and J. Huang, 2014: Discrimination and validation of clouds and dust aerosol layers over the Sahara desert with combined CALIOP and IIR measurements. J. Meteor. Res., 28, 185-198, doi: 10.1007/s13351-014-3051-5. |
| [36] | Liu, Y., A. Omar, Y. Hu, et al., 2005: CALIOP algo-rithm theoretical basis document—Part 3: Scene classification algorithms. Release 1.0, PC-SCI-202, NASA Langley Research Center, Hampton, VA, 56. |
| [37] | —-, M. Vaughan, D. Winker, et al., 2009: The CALIPSO lidar cloud and aerosol discrimination: version 2 al-gorithm and initial assessment of performance. J. Atmos. Ocean. Technol., 26, 1198-1213. |
| [38] | —-, J. Huang, G. Shi, et al., 2011: Aerosol optical properties and radiative effect determined from sky-radiometer over Loess Plateau of Northwest China. Atmos. Chem. Phys., 11, 11455-11463, doi: 10.5194/acp-11-11455-2011. |
| [39] | —-, R. G. Liu, and X. Cheng, 2013: Dust detection over desert surfaces with thermal infrared bands using dynamic reference brightness temperature dif-ferences. J. Geophys. Res. Atmos., 118, 8566-8584, doi: 10.1002/jgrd.50647. |
| [40] | Liu, Y. Z., G. Y. Shi, and Y. K. Xie, 2013: Impact of dust aerosol on glacial-interglacial climate. Adv. Atmos. Sci., 30, 1725-1731, doi: 10.1007/s00376-013-2289-7. |
| [41] | Liu, Z. Y., M. A. Vaughan, D. M. Winker, et al., 2004: Use of probability distribution functions for discrim-inating between cloud and aerosol in lidar backscat-ter data. J. Geophys. Res., 109, D15202, doi: 10.1029/2004JD004732. |
| [42] | —-, A. Omar, M. Vaughan, et al., 2008: CALIPSO lidar observations of the optical properties of Sa-haran dust: A case study of long-range trans-port. J. Geophys. Res., 113, D07207, doi: 10.1029/2007JD008878. |
| [43] | Lu Naimeng and Wu Rongzhang, 2000: A convective rainfall estimate technique developed by NSMC of China. Acta Meteor. Sinica, 14, 225-232. |
| [44] | —-, Dong Chaohua, Yang Zhongdong, et al., 2012: Ground segment of the new general of Fengyun popoar orbit meteorological satellite (FY3) and its data application. Engineering Science, 14, 10-19. (in Chinese) |
| [45] | Luo Jingning, Fan Yida, Shi Peijun, et al., 2003: Information-comparable method of monitoring the intensity of dust storm by multisource data of remote sensing. Journal of Natural Disasters, 12, 28-34. (in Chinese) |
| [46] | Ma Jinghui, Zhang Hua, Zheng Youfei, et al., 2007: The optical depth global distribution of dust aerosol and its possible reason analysis. Climatic Environ. Res., 12, 156-164. (in Chinese) |
| [47] | Ma, Y. Y., and W. Gong, 2012: Evaluating the perfor-mance of SVM in dust aerosol discrimination and testing its ability in an extended area. IEEE Selected Topics in Applied Earth Observations and Remote Sensing, 5, 1849-1858. |
| [48] | Mao Jietai, Zhang Junhua, and Wang Meihua, 2002: Summary comment on research of atmospheric aerosol in China. Acta Meteor. Sinica, 60, 625-634. (in Chinese) |
| [49] | Miller, S. D., 2003: A consolidated technique for enhanc-ing desert dust storms with MODIS. Geophys. Res. Lett., 30, 2071, doi: 10.1029/2003GL018279. |
| [50] | Myhre, G., D. Shindell, F.-M. Br´eon, et al., 2013: An-thropogenic and natural radiative forcing. Climate Change 2013: The Physical Science Basis. Contri-bution of Working Group I to the Fifth Assessment Report of the Intergovernmental Panel on Climate Change, Stocker, T. F., D. Qin, G.-K. Plattner, et al., Eds. Cambridge University Press, Cambridge, United Kingdom and New York, NY, USA. 659-740 pp. doi: 10.1017/CBO9781107415324.018. |
| [51] | Roskovensky, J. K., and K. N. Liou, 2003: Detection of thin cirrus from 1. 38 µm/0.65 µm reflectance ratio combined with 8.6-11 µm brightness temperature difference. Geophys. Res. Lett., 30, 1985, doi: 10.1029/2003GL018135. |
| [52] | —-, and —-, 2005: Differentiating airborne dust from cirrus clouds using MODIS data. Geophys. Res. Lett., 32, L12809, doi: 10.1029/2005GL022798. |
| [53] | Shao, Y., K. Wyrwoll, A. Chappell, et al., 2011: Dust cycle: An emerging core theme in earth system sci-ence. Aeolian Res., 2, 181-204. |
| [53] | Shenk, W. E., and R. J. Curran, 1974: The detection of dust storms over land and water with satellite visible and infrared measurements. Mon. Wea. Rev., 102, 830-837. |
| [54] | Shi Guangyu, Wang Biao, Zhang Hua, et al., 2008: The radiative and climatic effects of atmospheric aerosols. Chinese J. Atmos. Sci., 32, 826-840. (in Chinese) |
| [55] | Su, J., J. Huang, Q. Fu, et al., 2008: Estimation of Asian dust aerosol effect on cloud radiation forcing using Fu-Liou radiative model and CERES measurements. Atmos. Chem. Phys., 8, 2763-2771. |
| [56] | Tanre, D., and M. Legrand, 1991: On the satellite retrieval of Saharan dust optical thickness over land: Two different approaches. J. Geophys. Res., 96, 5221-5227. |
| [57] | Tao, H., Y. Li, H. Han, et al., 2005: Automatic detection of dust storm in Northwest China using decision tree classifier based on MODIS visible bands data. Proc. IGARSS 2005, Korea. |
| [57] | Tegen, I., 2003: Modeling the mineral dust aerosol cycle in the climate system. Quart. Sci. Rev., 22, 1821-1834. |
| [58] | Vaughan, M. A., S. A. Young, D. M. Winker, et al., 2004: Fully automated analysis of space-based lidar data: An overview of the CALIPSO retrieval algorithms and data products. Proc. SPIE Int. Soc. Opt. Eng., 5575, 16-30. |
| [59] | Wald, A., Y. Kaufman, D. Tanre, et al., 1998: Daytime and nighttime detection of mineral dust over desert using infrared spectral contrast. J. Geophys. Res., 103, 307-313. |
| [60] | Wang, H., G. Shi, W. Li., et al., 2006: The impacts of optical properties on radiative forcing due to dust aerosol. Adv. Atmos. Sci., 23, 431-441. |
| [61] | Wang Hong, Shi Guangyu, Wang Biao, et al., 2007: The impacts of dust aerosol from deserts of China on the radiative heating rate over desert sources and the North Pacific region. Chinese J. Atmos. Sci., 31, 515-526. (in Chinese) |
| [62] | Wang, H., X. Y. Zhang, S. L. Gong, et al., 2010: Ra-diative feedback of dust aerosols on the East Asian dust storms. J. Geophys. Res., 115, D23214, doi: 10.1029/2009JD013430. |
| [63] | Wang, J., X. G. Xu, D. K. Henze, et al., 2012: Top-down estimate of dust emissions through integration of MODIS and MISR aerosol retrievals with the GEOS-Chem adjoint model. Geophys. Res. Lett., 39, L08802, doi: 10.1029/2012GL051136. |
| [64] | Wang, T., and J. Huang, 2009: A method for estimating optical properties of dusty cloud. Chin. Opt. Lett., 7, 368-372. |
| [65] | Wang, W. C., J. P. Huang, P. Minnis, et al., 2010: Dusty cloud properties and radiative forcing over dust source and downwind regions derived from A-Train data during the Pacific Dust Experi-ment. J. Geophys. Res., 115, D00H35, doi: 10.1029/2010JD014109. |
| [66] | Wang, X., J. P. Huang, M. X. Ji, et al., 2008: Vari-ability of East Asian dust events and their long-term trend. Atmos. Environ., 42, 3156-3165, doi: 10.1016/j.atmosenv.2007.07.046. |
| [67] | —-, —-, R. D. Zhang, et al., 2010: Surface measure-ments of aerosol properties over Northwest China during ARM China 2008 deployment. J. Geophys. Res. Atmos., 115, doi: 10.1029/2009jd013467. |
| [68] | Winker, D. M., W. H. Hunt, and C. A. Hostetler, 2004: Status and performance of the CALIOP lidar. Proc. SPIE Int. Soc. Opt. Eng., 5575, 8-15. |
| [69] | —-, J. Pelon, and M. McCormick, 2006: Initial results from CALIPSO. 23rd International Laser Radar Conference, Nara, Japan. |
| [70] | Yan Hao, Jiao Meiyan, Wang Jianlin, et al., 2005: Dust detection using thermal infrared channel. J. Appl. Meteor. Sci., 16, 238-241. (in Chinese) |
| [71] | Yin, Y., S. Wurzler, Z. Levin, et al., 2002: Interactions of mineral dust particles and clouds: Effects on pre-cipitation and cloud optical properties. J. Geophys. Res., 107, 4724, doi: 10.1029/2001JD001544. |
| [72] | —-, and L. Chen, 2007: The effects of heating by trans-ported dust layers on cloud and precipitation: A numerical study. Atmos. Chem. Phys., 7, 3497-3505. |
| [73] | Yin Yan, Cui Zhenlei, Zhang Hua, et al., 2009: Numeri-cal simulations of mass distribution of aerosols over China in 2006. Trans. Atmos. Sci., 32, 595-603. (in Chinese) |
| [74] | Zender, C. S., R. L. R. L. Miller, and I. Tegen, 2004: Quantifying mineral dust mass budgets: Terminol-ogy, constraints, and current estimates. Eos Trans-actions American Geophysical Union, 85, 509-512. |
| [75] | Zhang Hua, Shi Guangyu, and Liu Yi, 2007: The effects of line-wing cutoff on radiative calculations. Acta Meteor. Sinica, 65, 968-975. (in Chinese) |
| [76] | —-, Ma Jinghui, and Zheng Youfei, 2009: A modeling study of global radiative forcing due to dust aerosol. Acta Meteor. Sinica, 67, 510-521. (in Chinese) |
| [77] | Zhang, J. L., and S. A. Christopher, 2003: Longwave radiative forcing of Saharan dust aerosols esti-mated from MODIS, MISR, and CERES obser-vations on Terra. Geophys. Res. Lett., 30, 2188, doi:10.1029/2003GL018479. |
| [78] | —-, —-, L. A. Remer, et al., 2005a: Shortwave aerosol radiative forcing over cloud-free oceans from Terra. I: Angular models for aerosols. J. Geophys. Res. Atmos., 110, D10S23, doi: 10.1029/2004JD005008. |
| [79] | —-, S. Christopher, L. Remer, et al., 2005b: Shortwave aerosol cloud-free radiative forcing from Terra. II: Global and seasonal distributions. J. Geophys. Res. Atmos., 110, D10S24, doi: 10.1029/2004JD005009. |
| [80] | —-, J. R. Campbell, J. S. Reid, et al., 2011: Evalu-ating the impact of assimilating CALIOP-derived aerosol extinction profiles on a global mass trans-port model. Geophys. Res. Lett., 38, L14801, doi: 10.1029/2011GL047737. |
| [81] | Zhang, L., X. Cao, J. Bao, et al., 2010: A case study of dust aerosol radiative properties over Lanzhou, China. Atmos. Chem. Phys., 10, 4283-4293. |
| [82] | Zhang, P., N. Lu, X. Hu, et al., 2006: Identification and physical retrieval of dust storm using three MODIS thermal IR channels. Global Planet. Change, 52, 197-206. |
| [83] | Zhang Peng, Zhang Xingying, Hu Xiuqing, et al., 2007: Satellite remote sensing and analysis of a dust event in 2006. Climatic Environ. Res., 12, 302-308. (in Chinese) |
| [84] | Zhang, X. Y., 2007: Aerosol over China and their climate effect. Adv. Earth Sci., 22, 12-16. (in Chinese) |
| [85] | —-, R. Arimoto, and Z. S. As, 1997: Dust emission from Chinese desert sources linked to variations in atmospheric circulation. J. Geophys. Res., 102, 28041-28047. |
| [86] | —-, S. L. Gong, Z. X. Shen, et al., 2003a: Characteriza-tion of soil dust aerosol in China and its transport and distribution during 2001 ACE-Asia. 1: Network observations. J. Geophys. Res., 108(D9), 4261, doi: 10.1029/2002JD002632. |
| [87] | —-, —-, T. L. Zhao, et al., 2003b: Sources of Asian dust and role of climate change versus desertification in Asian dust emission. Geophys. Res. Lett., 30, 2272, doi: 10.1029/2003GL018206. |
| [88] | Zhao, C., S. Chen, L. Leung, et al., 2013: Uncertainty in modeling dust mass balance and radiative forcing from size parameterization. Atmos. Chem. Phys., 13, 10733-10753. |
| [89] | Zhao, X. P., 2012: Asian dust detection from the satellite observations of moderate resolution imaging spec-troradiometer (MODIS). Aerosol Air Qual. Res., 12, 1073-1080. |
| [90] | Zhou, T., J. Huang, Z. Huang, et al., 2013: The depolarization-attenuated backscatter relationship for dust plumes. Opt. Express, 21, 15195-15204. doi: 10.1364/OE.21.015195. |