The Chinese Meteorological Society
Article Information
- WANG Yu, HAN Lei, WANG Hongqing. 2014.
- Statistical Characteristics of Convective Initiation in the Beijing-Tianjin Region Revealed by Six-Year Radar Data
- J. Meteor. Res., 28(6): 1127-1136
- http://dx.doi.org/10.1007/s13351-014-4043-1
Article History
- Received August 23, 2013;
- in final form July 10, 2014
2 College of Information Science and Engineering, Ocean University of China, Qingdao 266100;
3 State Key Laboratory of Severe Weather, Chinese Academy of Meteorological Sciences, Beijing 100081
As one of main severe weather types affecting Beijing, strong convective weather can cause huge economic losses and life casualties. On 21 July 2012, 79 people died due to a severe convective storm inBeijing(Sun et al., 2013). Quantitative precipitationforecasting(QPF)is an important tool in preventing and mitigating such disasters but, at present, it cannotmake accurate predictions for most users(Carbone et al., 2002; Rotunno and Houze, 2007; Aoshima et al., 2008; Wulfmeyer et al., 2011). One way to improvethe QPF skills is to better underst and the convectiveinitiation(CI)(Weckwerth et al., 2011; Wulfmeyer et al., 2011).
Climatological studies of CI have been performedin Europe and North America. Wilson and Roberts(2006)analyzed the CI events during the period ofthe International H2O Project(IHOP). Aoshima et al.(2008)used the MeteoSAT rapid scan data to study CIclimatology during the period of the Convective and Orographically-induced Precipitation Study(COPS).Weckwerth et al.(2011)used the 2000-2008 radardata to study the spatial distribution and diurnal evolution of CI events in southwestern Germany and eastern France. They used the 2D composite radar data, thus could not obtain 3D properties such as storm top and base of CI.
There have been barely any studies on the climatological characteristics of CI in the Beijing-Tianjinregion. So far, almost all previous studies listed belowhave focused on convective weather events rather than CI. Ding et al.(2007)analyzed the climatological distribution of convective events using the 12-yr surfaceobserv ations of Beijing. Zheng et al.(2007)analyzedthe spatial distribution and diurnal variation of convective activity using satellite data. Han et al.(2009)analyzed the characteristics of convective storms usingDoppler radar data. Yin et al.(2011)analyzed the diurnal variations of precipitation in warm-season in theBeijing area using precipitation and wind observationdata. Miao et al.(2011)investigated the impacts ofurban processes and urbanization on heavy rainfall inBeijing using the Weather Research and ForecastingModel(WRF). Song et al.(2011)investigated the sensitivity of cumulus parameterization(CUP A)schemesin modeling summer precipitation over East Asia using the fifth-generation Mesoscale Model(MM5; Pennsylv ania State University-National Center for Atmospheric Research). Wang et al.(2011)identified thecommon synoptic flow patterns associated with propagating and non-propagating precipitation episodes inwarm season over East Asia using the ECMWF analyses. Chen et al.(2012)analyzed diurnal variationsof convection activity using 2D composite reflectivitymosaic radar data over North China. Sun and Zhang(2012)examined the impacts of Mountain-Plains Circulation(MPC)on diurnal variations of rainfalls alongthe Meiyu front over the East China Plains using theWRF model.
The objective of this study is to use long-termradar data to examine the characteristics of CI in theBeijing-Tianjin region. The 3D radar reflectivity datawith high spatial and temporal resolutions were usedin this study. All CI cases were identified by the thunderstorm identification, tracking, analysis, and nowcasting(TIT AN)algorithm(Dixon and Wiener, 1993), which can provide the location, timing, and 3D stormproperties of each CI case. In this study, a "storm"or "storm cell" is quantitatively defined as a 3D continuous area with reflectivity and volume above giventhresholds(Dixon and Wiener, 1993), which are 35dBZ and 30 km3, respectively. For any storm track, the first time is regarded as the CI time.2. Data and method2.1 Data
The radar data(May to August of 2008-2013)used in our study were collected by the Beijing Daxing(39.81°N, 116.47°E; 100-m elev ation) and TianjinTanggu(39.04°N, 117.73°E; 700-m elev ation)S-b and Doppler radars(Fig. 1a). The range limitation of theradars is 150 km(see white circles in Fig. 1).
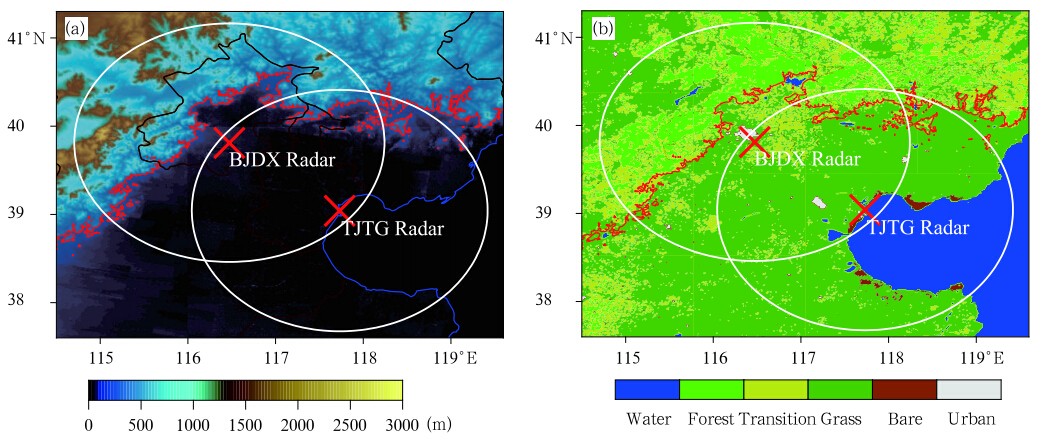 |
| Fig. 1.(a)Topography and (b)l and cover types in the study domain. Red "×" denotes the location of the BeijingDaxing/Tianjin Tanggu radar station. Thick red lines indicate the 200-m elev ation contour. |
A fuzzy-logic algorithm(Kessinger et al., 2003;Liu et al., 2007)was used to remove anomalous propagation echoes. All radar data were transformed into3D Cartesian coordinates with horizontal resolution of0.01°× 0.01°, vertical resolution of 1 km, and temporal resolution of 6 min. The study domain is 37.6°-41.3°N, 114.5°-119.6°E. This domain is divided into37 × 51 grids. The grid resolution is 0.10°× 0.10°.
The thick red line in Fig. 1 indicates the 200-melev ation, which marks the boundary between mountains and plains. The areas of oceans, plains, and mountain in the study domain are 16.63 × 10³, 62.45× 10³, and 31.38 × 10³ km2, respectively. In thisstudy, we define "unit area" as 1.0 × 10³km2.
The topography data were collected from the National Geophysical Data Center(NGDC)of China.The grid resolution is 30 arc seconds. The global l and cover classification field data(as shown in Fig. 1b)were created by Department of Geography, Universityof Maryl and (Hansen et al., 2000). There are 14 l and cover classes with a spatial resolution of 0.008333° × 0.008333°.
As the Beijing-Tianjin region is relatively small, the 14 l and cover classes were re-clustered into 6 types:1)forest(evergreen needle, evergreen broad, deciduousneedle, deciduous broad, mixed forest and woodl and s);2)transition(wooded grasses and close shrubs); 3)grass(open shrubs, grasses, and cropl and s); 4)water;5)urban; and 6)bare.
The ECMWF reanalysis(ERA-Interim)data(Dee et al., 2011)were used to analyze synopticweather environments. The data are on a horizontalresolution of 0.75°× 0.75°. The dataset provides convective available potential energy(CAPE), boundarylayer height(BLH), u and v wind fields, relative humidity, vertical velocity(ω), and geopotential heightat 37 levels(from 1000 to 1 hPa).2.2 Method
The TIT AN algorithm was used to identify convective storms and their tracks(Dixon and Wiener, 1993). TIT AN is a centroid-type tracking methodthat is able to identify and track individual storms.Storm properties, such as top and base height, location, speed, and direction, can be obtained throughTIT AN. Since 35 dBZ is well related to convectivestorms(Roberts and Rutledge, 2003; Mecikalski et al., 2007), it is used as the reflectivity threshold.
A storm track was rejected if it met one of thefollowing conditions(Dixon, 1994; Weckwerth et al., 2011):(1)the storm was too close to the radar station;(2)the storm originated outside the study region;(3)the storm lasted for only two timesteps;(4)the stormoccurred before the radar began to produce the firstsignal; and (5)the storm did not show variations insize or intensity. The remaining tracks were considered to be "good storm tracks", and the first detectedstorm of a good storm track was regarded as a CI case.
Figure 2 is an example of a storm track that occurred on 29 June 2008. This storm started at 1942BT, then moved eastward, and ended at 2034 BT. Theblack curve showed the tra jectory of this storm.
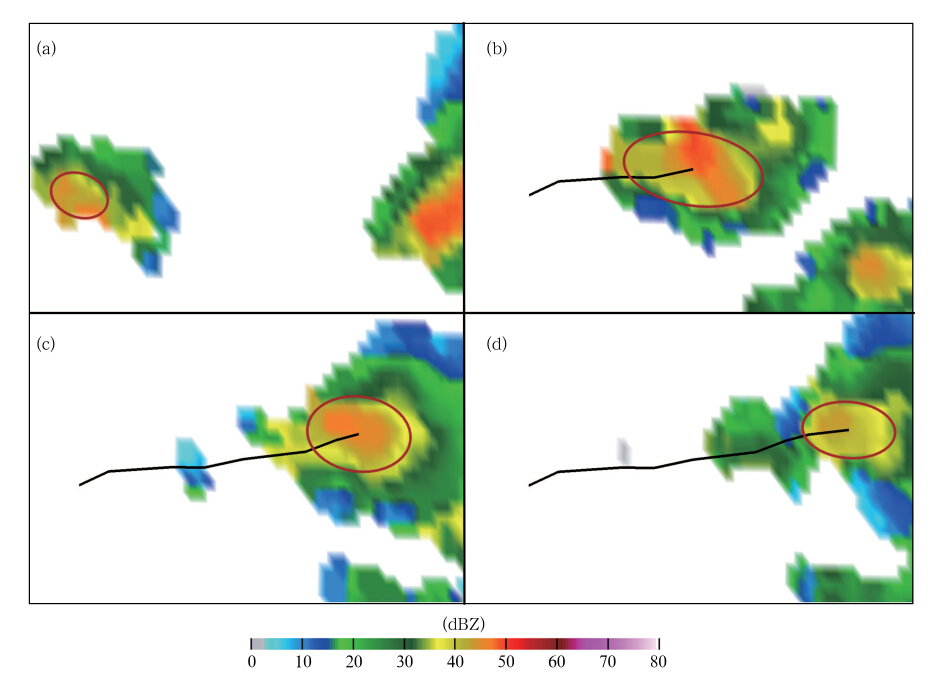 |
| Fig. 2. A storm track identified by TITAN. The black curve indicates the storm centroid tra jectory. Red ellipses denotethe storm detected by TITAN.(a)1942 BT, when the storm was first detected by TITAN;(b)2006 BT, in growingstage;(c)2024 BT, in dissipating stage; and (d)2034 BT, ended. |
A total of 38877 CI cases were identified. Themean values of the CI-top and the CI-base heights are5.96 and 1.73 km, respectively.
In Fig. 3, the spatial distribution of the numberof CI cases is overlaid by the average motion of the initiated cells. There is a significant increase of CI casenumber around the 200-m elev ation contour, suggesting that convections are more easily triggered in areas between mountains and plains, i.e., foothills. Thisphenomenon may be associated with the sharp terrainslope(He and Zhang, 2010). The highest number ofCI occurrences is located on the western side northof the 200-m contour and is associated with a nearbymountain peak(Fig. 1a).
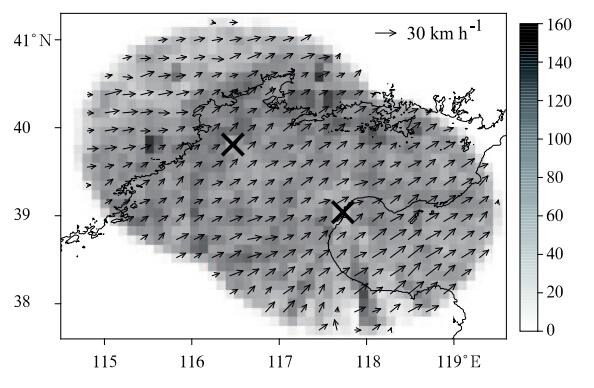 |
| Fig. 3. Spatial distribution of CI cases overlaid by theaverage motion of the initiated cells. The color of each gridrepresents the number of CI occurrences in the grid. Blackarrows represent the average motion vector of the initiatedcells within each grid box. Black thick line indicates the200-m elev ation contour as shown in Fig. 1 and the thickline in the bottom right corner indicates the coast line. |
The motion of the initiated cells tended to benortheastward. It is obvious that ocean-CIs movedfaster than mountain- and plain-CI cases. As themovement of convection is mostly determined by themean wind in the cloud layer(steering flow), we examined the mean speed of the steering flow over ocean, plains, and mountains. Harper and Beimers(1958)indicated that the steering-level was about 700 hPawith a st and ard deviation of 50 hPa. Hence, 700 hPawas used as the steering-level for the Beijing-Tianjinregion. The results show that the mean speed of steering flow over the ocean is 8.13 m s-1, higher than thatover the plains(6.24 m s-1) and mountains(5.48 ms-1). This likely explains why the CI cases over theoceans moved relatively faster.
Chen et al.(2012)showed that storms tended to propagate from the mountains to the plains. In thisstudy, initiated cells generally moved in a northeastward direction. This is because Chen's study mainlyfocused on the whole convective systems, while ourstudy focused on single newly-formed storm cells. Thepropagation direction of a system is usually on theright side of the direction of the single storm's movement.
Figure 4 is the CI distribution during 1200-1500, 1500-1800, 1800-2100, 2100-0000, 0000-0300, 0300-0600, 0600-0900, and 0900-1200 BT. It is clear that, from 1500-1800 to 0300-0600 BT, the relative highoccurrence CI region(red area)tended to propagatesoutheastward(i.e., from mountains to plains, then tothe ocean).
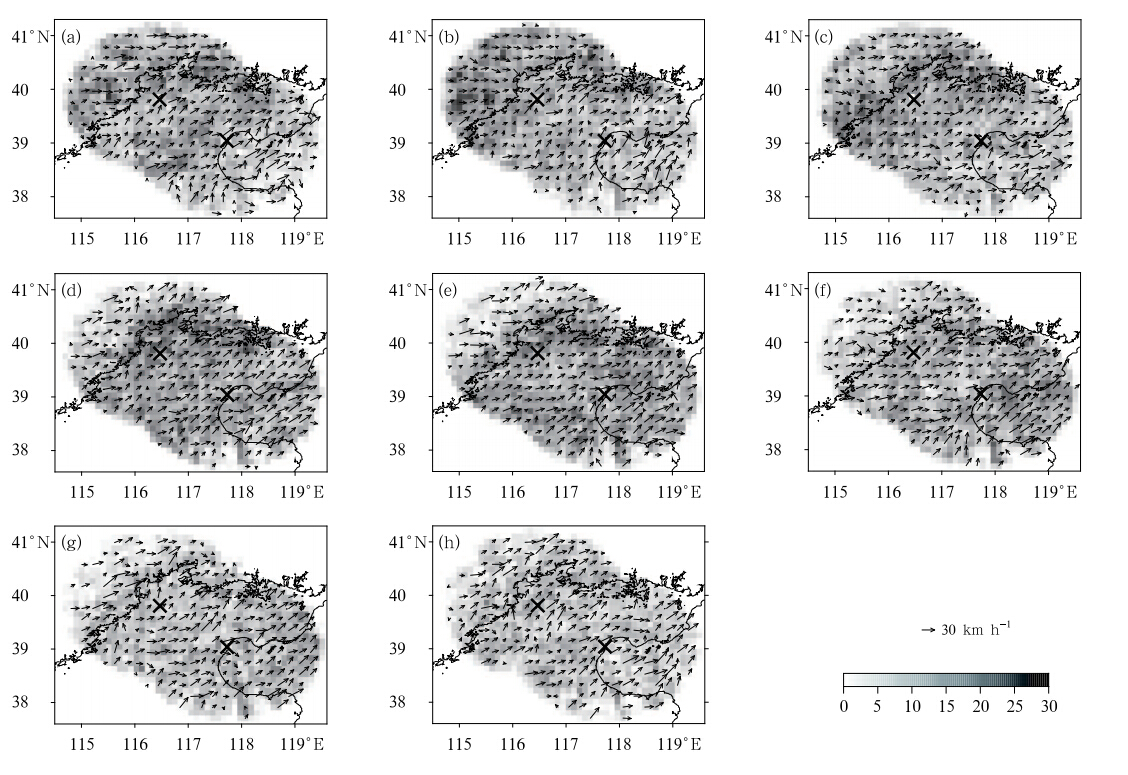 |
| Fig. 4. CI distributions during(a)1200-1500, (b)1500-1800, (c)1800-2100, (d)2100-0000, (e)0000-0300, (f)0300-0600, (g)0600-0900, and (h)0900-1200 BT. |
During 1200-1800 BT, CI occurred mainly overmountains. Then, during 1800-0300 BT, the highoccurrence area of CI moved to plains and finallymoved to oceans during 0000-0600 BT. During latemorning hours(0600-1200 BT), CI was rare over thewhole study domain.3.2 Terrain influence
The influence of terrain on CI density, CI-top and CI-base heights is shown in Fig. 5. The number of CIcases for each type of terrain was divided by the areaof the terrain to obtain the CI density.
Figure 5a shows that the peak of CI density overmountains occurred in the afternoon, implying thatmountains were more conducive to CI in the afternoon. This was likely caused by solar heating alongthe mountain slopes(Wolyn and Mckee, 1994; He and Zhang, 2010). The peak of CI density over plains occurred near midnight, while the peak of CI densityover ocean occurred a few hours later in the earlymorning. These results are consistent with Fig. 4, showing that from early afternoon to early morning, the high-occurrence region of CI propagated southeastward(i.e., from mountains to plains, then toocean). The diurnal variations of warm-season precipitation over northern China have similar characteristics(Wolyn and Mckee, 1994; He and Zhang, 2010).
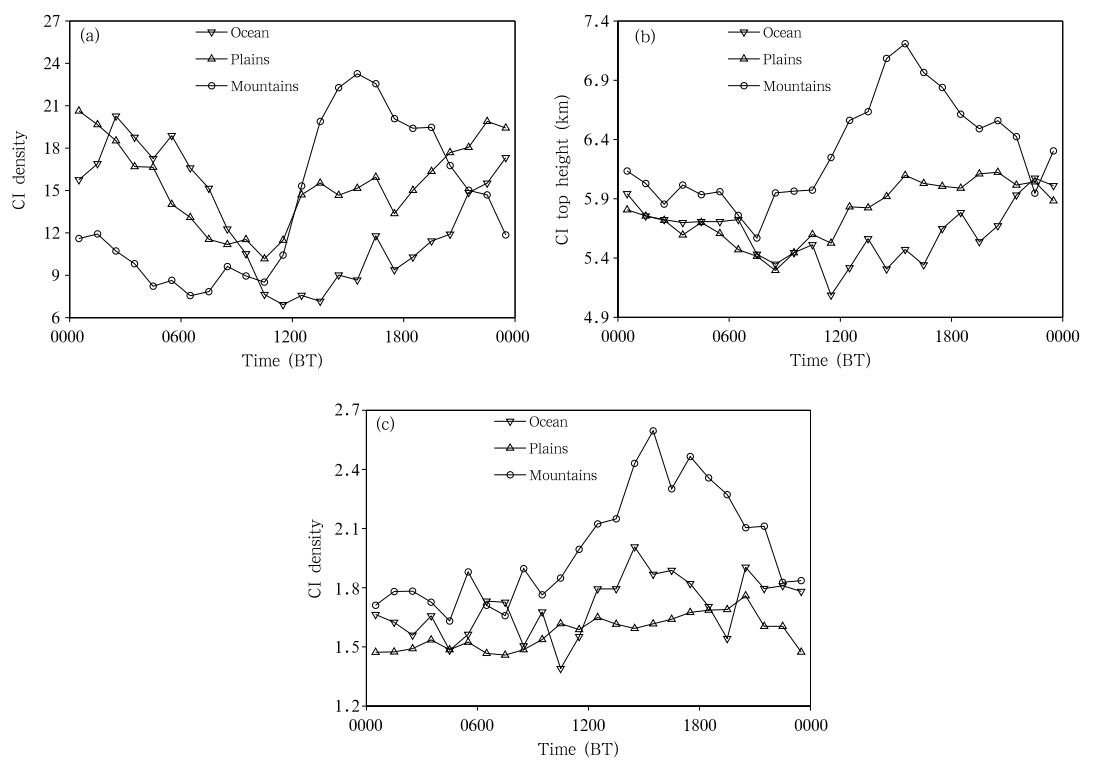 |
| Fig. 5. Diurnal variations of(a)CI density, (b)CI-top height, and (c)CI-base height over ocean, plains, and mountains.The CI density is in number per 1.0 × 10³ km2. |
Figure 5b shows the diurnal variation of CI-topheight. The CI-top height over mountains had a significant peak in the afternoon. This is likely due tothe strong surface heating along the mountain slopesleading to instability and rapid growth of convectivesystems. Figure 5c shows the diurnal variation of CIbase height. Similar to the CI-top, the CI-base heightover mountains also had a peak in the afternoon.3.3 Relationship with weather systems
All CI cases were categorized into four classes according to the weather system type to which theywere related. The first type of weather systemwas "trough", expressed as a trough in the 500-hPaweather chart over or west of Beijing-Tianjin; the second type was the Mongolian cold vortex(MCV)(Wilson et al., 2010), expressed as a closed isobar lasting at least 2-3 days in the 500-hPa weather chartover Northeast China or Mongolia; the third type was"after-trough", expressed as a trough to the east ofBeijing-Tianjin in the 500-hPa weather chart; the restwere regarded as "other".
As the weather chart's time interv al is 12 h, in order to take time into account, we treated each halfday(±6 h from 0000 and 1200 UTC)system as a singlesystem. A total of 692 single-systems were identified.The single-system number, CI number, and CI frequency(CI number divided by single-system numberfor each weather system), shown in Table 1, providean ev aluation of each weather system's potential totrigger CI.
 |
As shown in Table 1, the MCV weather systemhad the highest CI frequency of 68.17 while the aftertrough system had the lowest CI frequency of 36.47.CAPE, vertical velocity, and relative humidity werefurther examined by using composite weather charts.
Figure 6 shows composite weather charts ofCAPE, vertical velocity, and relative humidity for eachof the four weather types. A composite weather chartis the mathematical average of all individual cases fora given weather type. Here, a large negative value ofvertical velocity indicates a strong updraft.
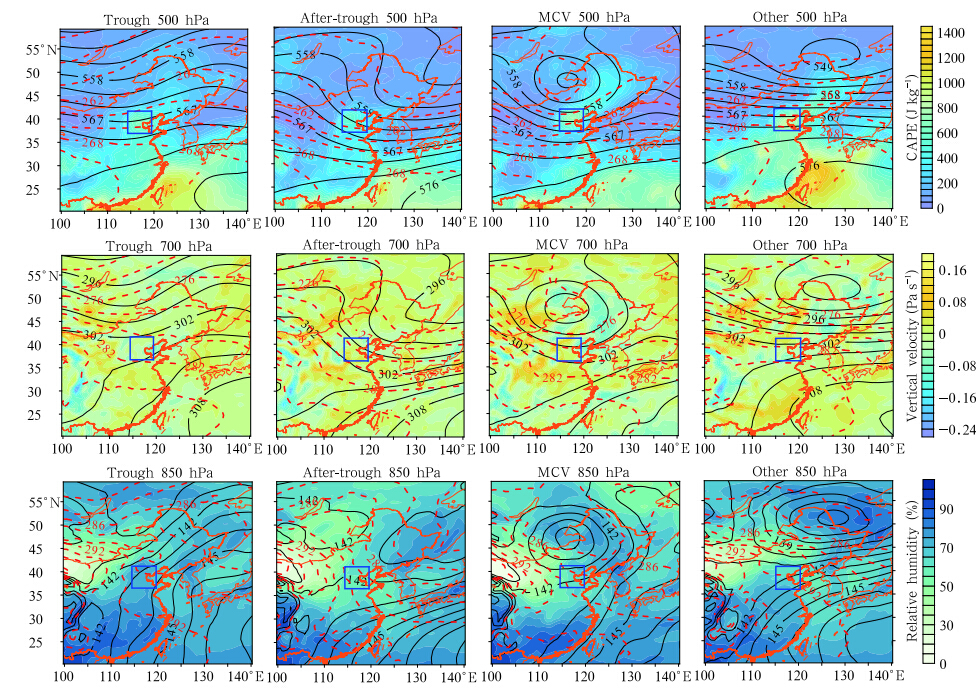 |
| Fig. 6. Composite weather charts(500, 700, and 850 hPa)of four weather system types. The first row is CAPE, thesecond row is vertical velocity, and the bottom row is relative humidity. The CAPE value is defined as saturated parcellifts from its level of free convection(LFC)to the equilibrium level(EL). Black solid lines represent geopotential height(m2 s-2). Red dashed lines denote temperature(K). Blue rectangles indicate the Beijing-Tianjin region. Orange lines are state boundaries. A large negative value of vertical velocity means a strong updraft, and vice versa. |
For the trough system case, a trough existedabove or west of the Beijing-Tianjin region. ForMCV, a closed isobar(low pressure center)existedover Northeast China or Mongolia. Generally, theafter-trough system had the lowest CAPE in BeijingTianjin region(with a mean value of 443.37 J kg-1) and the trough system had the highest relative humidity(850 hPa; mean value of 73.03%). But there wereno major differences in the CAPE, vertical velocity, and relative humidity between weather types.
Figure 7 shows spatial distributions of CI occurrences overlaid by velocity of the initiated cells for these four weather types. Figure 7a shows that troughCI cases were widely distributed over foothills and plains. As shown in Fig. 7b, after-trough-CI casesfrequently occurred over foothills and plains, but themotion of the initiated cells was quite different fromthat of the trough-CI cases. The main difference isthat the motion of the cells in the after-trough case isfrom northwesterly and westerly directions, comparedto southwesterly for the other cases. This is mostlikely because of the difference in the steering winddifference. Figure 7c shows that MCV-CI cases mainlyoccurred in foothills and coastal areas, and tended tomove eastward(over mountains and plains) and northeastward(over ocean).
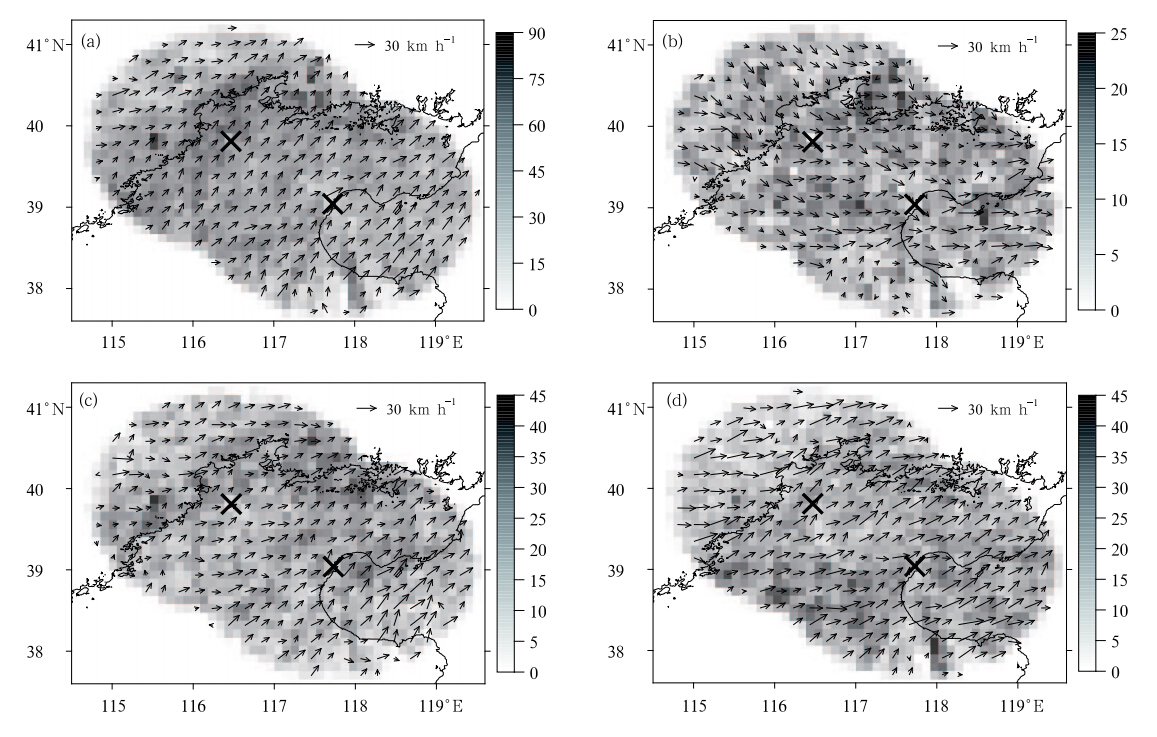 |
| Fig. 7. CI spatial distributions overlaid by the average motion of the initiated cells for(a)trough, (b)after-trough, (c)MCV, and (d)other types. Grey level of each grid represents the number of CI occurrences in the grid. |
The influence of l and cover on CI was examined.Table 2 shows the number of CI occurrences for eachl and cover type. The CI density was obtained by dividing the number of CI cases by each l and cover type'sarea, so as to compare the ability of each l and covertype to trigger CI.
From Table 2, the urban l and area had the highest CI density(446.6). A strong urban heat isl and (UHI)can affect vertical mixing, raise the planetaryboundary layer(PBL)height, and weaken the cappedinversion intensity(Bornstein and Lin, 2000), whichare conducive to the development of convection(Miao et al., 2011).
The forest-type l and cover had a high CI density(389.3)compared to all other l and cover types, whichmeans that CI is more likely to form over forests. Twopossible reasons for this have been mentioned by Gambill and Mecikalski(2011). The first reason is thatdense forests have greater ability to store and releasemoisture, and the second is that dense forests likelyhave increased aerodynamic roughness values.
The water area(mainly the Bohai Sea)is 16.5%of the whole study domain. It had the least impact forCI genesis with the lowest CI density(316.2). This islikely because the sea surface temperature is relativelylow in summer, leading to increased atmospheric stability and hence inhibiting convection initiation.4. Conclusions and discussion
This study analyzed the characteristics of CI occurrences in the Beijing-Tianjin region by using sixyears of radar data. The TIT AN algorithm was usedto identify CI. The reflectivity threshold was 35 dBZ.A total of 38877 CI cases were identified. The mean35-dBZ storm top and base of CI in the study domainwere 5.96 and 1.73 km, respectively.
One of the most common locations for CI was inthe foothills near the 200-m elev ation contour. Thismay be due to the sharp terrain slope. The direction of motion of the initiated cells was similar to the steering flow direction. The cell moving speeds tended toincrease from north to south, likely in response tostronger steering flows to the south. The CI spatialdistribution for 1200-1500, 1500-1800, 1800-2100, 2100-0000, 0000-0300, 0300-0600, 0600-0900, and 0900-1200 BT shows that, from 1500-1800 to 0300-0600 BT, the high-occurrence CI region tended topropagate southeastward(i.e., from mountains toplains, then to ocean).
The peak in CI occurred over the mountains inthe afternoon, the peak over the plains was near midnight, and the peak over the sea was a few hours aftermidnight. This is consistent with the above mentionedfinding that, from 1500-1800 to 0300-0600 BT, thehigh-occurrence CI region tended to propagate frommountains to plains, then to ocean. Both the CI-top and CI-base heights over mountains had a significantpeak in the afternoon.
Among the four weather systems, the MCVweather system had the highest CI frequency of 68.17, while the after-trough system had the lowest CI frequency of 36.47. The only noticeable differences observed were that the after-trough weather system hadthe lowest CAPE values and the trough system hadthe highest relative humidity.
For the l and cover relationship with CI, the highest CI density was observed in urban areas. Theforest-type l and cover had the second highest CI density.
The above results could be useful in improvingthe accuracy of local weather forecasting.
Acknowledgments: The authors would liketo thank James Wilson of NCAR, USA for fruitfuldiscussion and suggestions. We also thank two anonymous reviewers for constructive comments that havesignificantly improved the quality of this paper.
| [1] | Aoshima, F., A. Behrendt, H. S. Bauer, et al., 2008: Statistics of convection initiation by use of Me-teosat rapid scan data during the convective and orographically-induced precipitation study (COPS). Meteorologische Zeitschrift, 17, 921-930. |
| [2] | Bornstein, R., and Q. L. Lin, 2000: Urban heat islands and summertime convective thunderstorms in At-lanta: Three case studies. Atmos. Environ., 34, 507-516. |
| [3] | Carbone, R. E., J. D. Tuttle, D. A. Ahijevych, et al., 2002: Inferences of predictability associated with warm season precipitation episodes. J. Atmos. Sci., 59, 2033-2056. |
| [4] | Chen Mingxuan, Wang Yingchun, Gao Feng, et al., 2012: Diurnal variations in convective storm activity over contiguous North China during the warm season based on radar mosaic climatology. J. Geophys. Res., 117, D20115, doi: 10.1029/2012JD018158. |
| [5] | Dee, D. P., S. M. Uppala, A. J. Simmons, et al., 2011: The era-interim reanalysis: Configuration and per-formance of the data assimilation system. Quart. J. Roy. Meteor. Soc., 137, 553-597. |
| [6] | Ding Qinglan, Wang Ling, Chen Mingxuan, et al., 2007: Climate character analysis of convective weather during warm season (May to September) in Beijing. Meteor. Mon., 33, 37-44. (in Chinese) |
| [7] | Dixon, M. J., 1994: Automated storm identification, tracking and forecasting: A radar-based method. Ph. D. Dissertation, Department of Civil, Environ-mental, and Architectural Engineering, University of Colorado, Boulder, USA, 181 pp. |
| [8] | —-, and G. Wiener, 1993: TITAN—thunderstorm identi-fication, tracking, analysis and nowcasting—A radar based methodology. J. Atmos. Oceanic Technol., 10, 785-797. |
| [9] | Gambill, L. D., and J. R. Mecikalski, 2011: A satellite-based summer convective cloud frequency analysis over the southeastern United States. J. Appl. Me-teor. Climatol., 50, 1756-1769. |
| [10] | Han Lei, Fu Shengxue, Zhao Lifeng, et al., 2009: 3D convective storm identification, tracking, and forecasting—An enhanced TITAN algorithm. J. At-mos. Oceanic Technol., 26, 719-732. |
| [11] | Hansen, M. C., R. S. Defries, J. R. G. Townshend, et al., 2000: Global land cover classification at 1-km spa-tial resolution using a classification tree approach. Int. J. Remote Sens., 21, 1331-1364. |
| [12] | Harper, W. G., and J. G. D. Beimers, 1958: The move-ment of precipitation belts as observed by radar. Quart. J. Roy. Meteor. Soc., 84, 242-249. |
| [13] | He Huizhong and Zhang Fuqing, 2010: Diurnal variations of warm-season precipitation over northern China. Mon. Wea. Rev., 138, 1017-1025. |
| [14] | Kessinger, C., S. Ellis, J. Vanandel, et al., 2003: The AP clutter mitigation scheme for the WSR-88D. Preprints, 31st Conference on Radar Meteorology, Seattle, WA, 2003, Amer. Meteor. Soc., 526-529. |
| [15] | Liu Liping, Wu Linlin, and Yang Yinming, 2007: De-velopment of fuzzy-logical tow-step ground clutter detection algorithm. Acta Meteor. Sinica, 65, 252-260. (in Chinese) |
| [16] | Mecikalski, J. R., W. F. Feltz, J. J. Murray, et al., 2007: Aviation applications for satellite-based observa-tions of cloud properties, convection initiation, in-flight icing, turbulence, and volcanic ash. Bull. Amer. Meteor. Soc., 88, 1589-1607. |
| [17] | Miao Shiguang, Chen Fei, Li Qingchun, et al., 2011: Impacts of urban processes and urbanization on summer precipitation: A case study of heavy rain-fall in Beijing on 1 August 2006. J. Appl. Meteor. Climatol., 50, 806-825. |
| [18] | Roberts, R. D., and S. Rutledge, 2003: Nowcasting storm initiation and growth using GOES-8 and WSR-88D data. Wea. Forecasting, 18, 562-584. |
| [19] | Rotunno, R., and R. A. Houze, 2007: Lessons on oro-graphic precipitation from the mesoscale alpine pro-gramme. Quart. J. Roy. Meteor. Soc., 133, 811-830. |
| [20] | Song Shi, Tang Jianping, and Chen Xing, 2011: Impacts of spectral nudging on the sensitivity of a regional climate model to convective parameterizations in East Asia. Acta Meteor. Sinica, 25, 63-77. |
| [21] | Sun Jianhua and Zhang Fuqing, 2012: Impacts of mountain-plains solenoid on diurnal variations of rainfalls along the Mei-yu front over the East China plains. Mon. Wea. Rev., 140, 379-397. |
| [22] | —-, Zhao Sixiong, Fu Shenming, et al., 2013: Multi-scale characteristics of record heavy rainfall over Beijing area on July 21, 2012. Chinese J. Atmos. Sci., 37, 705-718. (in Chinese) |
| [23] | Wang, C. C., G. T. J. Chen, H. L. Huang, et al., 2011: Synoptic conditions associated with propagating and nonpropagating cloud/rainfall episodes during the warm season over the East Asian continent. Mon. Wea. Rev., 140, 721-747. |
| [24] | Weckwerth, T. M., J. W. Wilson, M. Hagen, et al., 2011: Radar climatology of the COPS region. Quart. J. Roy. Meteor. Soc., 1371(SI), 31-41. |
| [25] | Wilson, J. W., and R. D. Roberts, 2006: Summary of convective storm initiation and evolution dur-ing IHOP: Observational and modeling perspective. Mon. Wea. Rev., 134, 23-47. |
| [26] | —-, R. F. Ye, M. Chen, et al., 2010: Nowcasting chal-lenges during the Beijing Olympics: Successes, fail-ures, and implications for future nowcasting systems. Wea. Forecasting, 25, 1691-1714. |
| [27] | Wolyn, P. G., and T. B. Mckee, 1994: The mountain plains circulation east of a 2-km hight north-south barrier. Mon. Wea. Rev., 122, 1490-1508. |
| [28] | Wulfmeyer, V., A. Behrendt, C. Kottmeier, et al., 2011: The convective and orographically-induced precip-itation study (COPS): The scientific strategy, the field phase, and research highlights. Quart. J. Roy. Meteor. Soc., 137, 3-30. |
| [29] | Yin Shuiqing, Li Weijing, Chen Deliang, et al., 2011: Diurnal variations of summer precipitation in the Beijing area and the possible effect of topography and urbanization. Adv. Atmos. Sci., 28, 725-734. |
| [30] | Zheng Yongguang, Chen Jiong, Chen Mingxuan, et al., 2007: Statistic characteristics and weather signifi-cance of infrared TBB during May-August in Beijing and its vicinity. Chin. Sci. Bull., 52, 3428-3435. |
 2014, Vol. 28


