 2014, Vol. 28
The Chinese Meteorological Society
Article Information
- HE Di, WANG Jing, DAI Tong, FENG Liping, ZHANG Jianping, PAN Xuebiao, PAN Zhihua. 2014.
- Impact of Climate Change on Maize Potential Productivity and the Potential Productivity Gap in Southwest China
- J. Meteor. Res., 28(6): 1155-1167
- http://dx.doi.org/10.1007/s13351-014-3080-0
Article History
- Received March 17, 2014;
- in final form May 30, 2014


2 Chongqing Institute of Meteorological Sciences, Chongqing 401147
Southwest China(SWC)comprises Yunnan, Guizhou, Sichuan provinces, and Chongqing City. Ithas a total area of 1. 137×106 km2, and is locatedat relatively low latitudes(over approximately 20°-35°N). Known as "the third Golden-Maize-Belt" afterNortheast China and the North China Plain, SWC isone of the major maize production areas of China. Thetotal quantity of maize sown in SWC is about 5 millionha, which accounts for nearly 20% of the national total(Pan and Yang, 2012). Maize production in SWC is akey part of both local and national maize production and plays a vital role in guaranteeing grain securityin China. Nevertheless, maize production in SWC isthreatened by frequent seasonal drought events, despite annual precipitation being su°cient for crop water requirements(Wang Mingtian et al., 2012). Previous studies indicate that SWC has experienced awarming trend over the last five decades, especiallyin the most recent 20-25 years, and has witnessed astatistically significant decrease in autumn precipitation(Qin et al., 2010). Zhang Mingjun et al. (2013)identified this area as one of the most susceptible areasto climate change in China. In the past decade, severe and frequent seasonal droughts have struck SWC, seriously damaging crop production(Zhang Mingjun et al., 2013; Zhang W. et al., 2013).
Crop potential productivity is a key index fordetermining crop yield gaps and quantifying the impacts of climate change on crop production(Wang et al., 2011; Wang J. et al., 2012). Potential yield ina given location refers to the yield of a crop whengrown under conditions of full nutrient supply, thorough control of pests and weeds, and optimum farming techniques and management(van Ittersum and Rabbinge, 1997; Evans and Fischer, 1999; Grassini et al., 2009). Photosynthetic, light-temperature, and climatic potential productivity refer to the maximum crop output determined by radiation, light-temperature, and light-temperature-precipitation conditions, respectively, when soil, seed, and other agricultural techniques are suitable(Huang, 1985; Yang et al., 2010). These measures can provide important theoretical guidance for the planning of agricultural productivity and the reasonable use of climateresources(Yuan et al., 2012). The gap between light-temperature and climatic potential productivity indicates the yield loss due to water stress and suggestspotential to increase yield by improving the water supply(Wu et al., 2006).
A large number of studies have estimated the spatiotemporal changes in crop potential productivity indifferent parts of the world by using various statistical and simulation methods. Mechanism-based empir-ical methods, e. g., the Agro-Ecological-Zones method(Kassam et al., 1982), and various crop simulationmodels, e. g., Agriculture Production Systems Simulator Model(APSIM)(McCown et al., 1996; Keating et al., 2003), World Food Studies Model(WOFOST)(Diepen et al., 1989), and Crop Environment ResourceSynthesis Model(CERES)(Allan et al., 1986), havebeen widely used in evaluating crop yield potential inChina, especially in the North China Plain and North-east China(Wang et al., 2008; Wang J. et al., 2012; Chen et al., 2013).
Binder et al. (2008)quantified maize productionpotential using the CERES model in the North ChinaPlain and indicated that maize potential yields arelimited by the duration of the growing period. Wuet al. (2008)analyzed the impact of spatiotemporalvariations of climate variables on maize yield potentialusing the WOFOST model in the North China Plain, and found that the potential yield follows an increasing trend with latitude, which is closely related to thedistribution of global radiation in the maize growingseason. Chen et al. (2013)used the APSIM model toexamine the relative contribution of each climate variable to maize potential yield and indicated that an increase in temperature and a decrease in solar radiationhave significant negative impacts on maize yield potential. The gap between potential and rainfed maizeyield across the whole plain was found to be 2870 kgha-1, i. e., the rainfed yield was approximately 32% ofthe potential yield, with the highest values recorded inthe central North China Plain. These results are consistent with those found by Liu et al. (2002), namely, the central North China Plain has the greatest potential for increased summer maize yield if the watersupply is improved.
Similarly, the spatiotemporal changes in maizepotential productivity in Northeast China have alsobeen investigated(Chen et al., 2011; Yuan et al., 2012; Qin et al., 2013). Maize climatic potential productivity has increased with rising temperature during thepast 30 years(Chen et al., 2011; Yuan et al., 2012), though it varies greatly due to the variation of precipitation(Chen et al., 2011). Liu et al. (2012)analyzed maize potential yield and the yield gap in thechanging climate of Northeast China, and found thatthe largest yield gaps are located in the southeast ofNortheast China, and a simulated increase of maximum temperature results in a negative impact on thepotential yield.
In contrast to the plentiful research on maize yieldpotential and yield gaps in the North China Plain and Northeast China, SWC remains almost untouched albeit its being a major maize production area and oneof the most susceptible area to climate change. Therefore, the objectives of this study are:(1)to investigatethe spatiotemporal changes of climate variables and their effects on maize potential productivity and potential productivity gaps in SWC during 1961-2010, and (2)to detect the sensitivity of climatic potentialproductivity to key climate variables. 2. Materials and methods2. 1 Study sites, climate conditions, and cropdata
For analysis of the spatiotemporal variability ofmaize potential productivity during 1961-2010, historical climate data from 67 meteorological stations, evenly distributed throughout SWC, are obtainedfrom the China Meteorological Administration. Allthe climate data are of high quality and with continuous recording integrity. Daily climate data includesunshine hours(h), average temperature(° C), maximum temperature(° C), minimum temperature(° C), precipitation(mm), relative humidity(%), and windspeed(m s-1)over the period 1961-2010. The studyarea and spatial distribution of the meteorological stations are shown in Fig. 1.
 |
| Fig. 1. Southwest China(SWC) and the distribution of meteorological stations. Di®erent colors indicate the districtswith different growth periods of maize. |
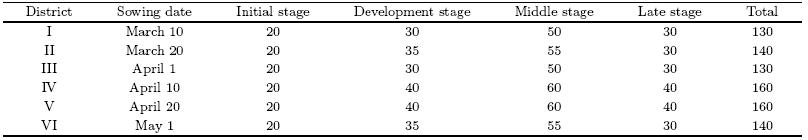
For simulating maize yield potential, the studyarea is divided into six maize-growing districts basedon different sowing dates and growth periods, as recommended by Liu et al. (2014). Observed maizephenology from 27 agricultural meteorological stations(Fig. 1)of the China Meteorological Administration is used to calibrate the maize-growing districts. The development stage of maize is divided into fourphases: initial stage(sowing-jointing), developmentstage(jointing-tasselling), middle stage(tasselling-milking), and late stage(milking-maturity), accordingto Allen et al. (1998). Maize-growing districts, sowingdates, and the lengths of four development stages ineach district are shown in Fig. 1 and Table 1. Average, maximum, and minimum temperatures duringthe maize growing season(from sowing to maturity)in the six maize-growing districts range from 19. 4 to20. 9° C, from 23. 4 to 27. 4° C, and from 12. 9 to 17. 1° C, respectively. Total sunshine hours and precipitationduring the maize growing season range from 470. 6 to796. 4 h and from 412. 0 to 607. 9 mm, respectively.
 |
Maize potential productivity is calculated according to the crop growth dynamics statistical method, which divides the potential production into three levels: photosynthetic, light-temperature, and climaticpotential productivity(Huang, 1985; Yuan et al., 2012). This method has been widely used in estimating crop potential productivity in China(Li et al., 2010; Yang et al., 2010; Yuan et al., 2012).
Firstly, photosynthetic potential productivity(YQ; 103 kg ha-1)is calculated as
where 0. 219 is the Huang Bingwei coefficient in unit of10-5 kg kJ-1(Li et al., 2010); C is the crop economiccoefficient, taking the value of 0. 4(Wang et al., 2005); j represents each maize development stage; gdj is thelength of each maize development stage; Rs; i is thedaily shortwave radiation during the maize growingseason in unit of kJ cm-2 day-1, which is calculatedaswhere Ra, i is the daily extraterrestrial radiation in kJcm-2 day-1, ni is the daily actual duration of sunshinein hour, Ni is the daily maximum possible duration ofsunshine in hour, and as = 0. 25 and bs = 0. 50 are usedfor the estimation of Ra, i, as recommended in Allen etal. (1998).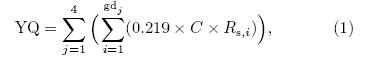

Secondly, light-temperature potential productivity(YT; 103 kg ha-1)is calculated by correcting thephotosynthetic potential productivity with the temperature stress coeficient as follows:
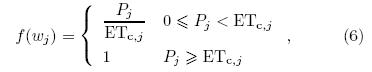
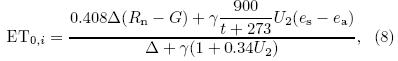
Here, f(ti)is the temperature stress coefficient thatcan be calculated as follows(Li et al., 2010):where ti is daily average temperature in(° C), and tmin, j , tmax; j, and to, j are the minimum, maximum, and optimum temperatures(° C)for each maize development stage, respectively. The values of tmin, j , tmax; j, and to, j used in this study are shown in Table 2 as recommended in Guo et al. (2004). Finally, climatic potential productivity(YW; 103 kg ha-1)is calculated by correcting the light-temperature potential productivity with the waterstress coefficient as follows(Li et al., 2010):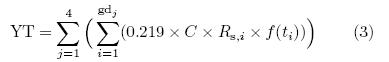


 |

The linear regression method is used in the trendanalysis in this paper. Linear regression is a commonlyused parametric method for identifying linear trendsin a time series. The slope of the linear regressionequation indicates the mean temporal change of thestudied variables. Multiplying the slope by the number of years can obtain the total change during the period. A Student's t-test(two-tail)is used for assessingthe significance of the trends. The variation coefficientof potential productivity, defined as the percentage ofst and ard deviation divided by the mean, is calculatedfor each station(Wu et al., 2006).
Sensitivity analysis is important in underst and ingthe relative importance of climate variables to the variation of potential productivity. A simple but practicalsensitivity analysis is performed in this study, i. e., therelative changes of a dependent variable are plottedagainst relative changes of independent variables as acurve(Gong et al., 2006). The sensitivity coefficient, i. e., the slope of the curve, can represent the changein potential productivity caused by any perturbationof the variable concerned. Relative change series(i. e., ±5%, ±10%, ±15%, and ±20%)of sunshine hours, maximum temperature, minimum temperature, and precipitation, respectively, are used to detect the relative change in potential productivity while all othervariables are held constant.
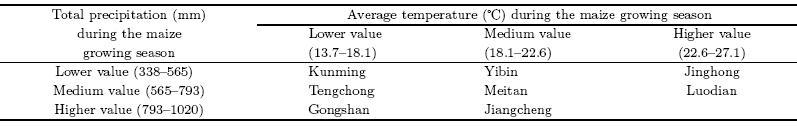
We classify meteorological stations using growing season precipitation and average temperature withlow, medium, and high levels, and arrive at a 3 × 3matrix(Liu et al., 2012). We select eight stations(indicated by the pentagrams in Fig. 1)that representeach category of climate(e. g., low precipitation and high temperature, medium precipitation, low temperature, etc. )to conduct the sensitivity analysis. Theclassification of stations is shown in Table 3. Noneof our c and idate stations represent high precipitation and high temperature.
 |
Growing season minimum temperature increased(p < 0. 05)at 76% of all the study stations from 1961to 2010(Fig. 2b). Growing season average and maximum temperatures showed an increasing trend at 84% and 77% of all the study stations; however, they werestatistically significant(p < 0. 05)at only 44% and 19% of the stations, respectively(Figs. 2a and 2c). Across SWC, the growing season average, minimum, and maximum temperatures increased by 0. 11° C(p <0. 01), 0. 20° C(p < 0. 01), and 0. 06° C(p > 0. 05)perdecade, respectively. The largest increase in average and minimum temperatures occurred mostly in Yunnan Province(Figs. 2a and 2b).
 |
| Fig. 2. The rates of changes per decade in(a)average temperature(° C), (b)minimum temperature(° C), (c)maximumtemperature(° C), (d)precipitation(mm), (e)sunshine hours(h day-1), and (f)reference crop evapotranspiration(mm)during the maize growing season in SWC from 1961 to 2010. |
Growing season total precipitation increased at48% of all the study stations, although none of theincreases were statistically significant(Fig. 2d). Onlythree stations showed a decreasing trend(p < 0. 05). The stations with increased precipitation were locatedmostly in areas of Yunnan Province and ChongqingCity(Fig. 2d). Growing season average sunshinehours decreased at 91% of all the study stations, and was statistically significant(p < 0. 05)at 69% of thestations(Fig. 2e). Across SWC, growing season average sunshine hours decreased at a rate of 0. 2 h day-1per decade. Eastern SWC showed the largest decrease in average sunshine hours mostly in areas ofChongqing City and Guizhou Province(Fig. 2e). Reference crop evapotranspiration decreased at 70% of allthe study stations, and was statistically significant at16% of the stations, centered in eastern SWC(p <0. 05; Fig. 2f). 3. 2 Change in maize potential productivity
The photosynthetic potential productivity ofmaize varied from 20197 to 26080 kg ha-1 in SWC, with a mean of 23134 kg ha-1 for the whole area(Fig. 3a). In general, photosynthetic potential productivitydecreased from north to south, with the largest values in maize-growing districts IV and V due to higheraverage growing season radiation and a longer maizegrowing season(Table 1). Light-temperature potentialproductivity of maize was noticeably lower than photosynthetic potential productivity, which varied from6687 to 19463 kg ha-1, with a mean of 13316 kg ha-1in SWC(Fig. 3b). Climatic potential productivityvaried from 6257 to 18257 kg ha-1, with a similar dis-tribution pattern to light-temperature potential productivity(Fig. 3c). Photosynthetic potential productivity showed a decreasing trend at 91% of all thestudy stations, being statistically significant(p < 0. 05)at 63% of the stations, from 1961 to 2010, due to anoticeable decline in sunshine hours(Figs. 3d and 2e). Across SWC, it decreased by 298 kg ha-1 perdecade, with the largest decrease mostly in the ar-eas of Chongqing City and Guizhou Province(Fig. 3d). However, only 71% of the stations showed adecrease in light-temperature potential productivity, with 30% of the stations being statistically significant(p < 0. 05; Fig. 3e). Furthermore, only 15% of the stations showed a statistically significant decrease(p <0. 05)in climatic potential productivity. Across SWC, light-temperature and climatic potential productivitydecreased by 75 and 44 kg ha-1 per decade, respectively(p > 0. 05). Both light-temperature and climaticpotential productivity showed a noticeable decreasingtrend in the northeast of SWC, whereas they increasedsignificantly in southwestern parts(Figs. 3e and 3f).
 |
| Fig. 3. (a)Photosynthetic, (b)light-temperature, and (c)climatic potential productivity(kg ha-1)of maize averagedfrom 1961 to 2010. Panels(d-f)indicate the rate of change(kg ha-1 per decade)of photosynthetic, light-temperature, and climatic potential productivity from 1961 to 2010, respectively. |
The variation coefficients of photosynthetic potential productivity(ranging from 3. 5% to 8. 5%)waslower than that of light-temperature potential productivity(ranging from 4. 6% to 23. 6%), demonstratingthe impact of temperature variability(Fig. 4). Thevariation coefficients of climatic potential productivity(ranging from 5. 7% to 31. 4%)were closely related tothe large variation in precipitation during the maizegrowing season. The interannual variation of climaticpotential productivity was the largest in central SWC, especially in Muli, where stations recorded low precipitation(353 mm)during the maize growing season.
 |
| Fig. 4. Variation coe±cients(%)of(a)photosynthetic, (b)light-temperature, and (c)climatic potential productivityin SWC from 1961 to 2010. |
The gap between light-temperature and climaticpotential productivity varied considerably with location(between 12 and 2729 kg ha-1)in SWC from1961 to 2010. The potential productivity gap reached1182-2729 kg ha-1 in northern and southwestern SWC(Yunnan and Sichuan)(Fig. 5). Climatic potentialproductivity was about 10%-24% of light-temperaturepotential productivity in these regions, which impliesthat precipitation is a strong limiting factor for maizepotential productivity. For instance, Yuanjiang, located in Yunnan province, witnessed the largest average potential productivity gap(2729 kg ha-1)from1961 to 2010, which was caused by high temperature(27. 1° C) and low precipitation(355. 8 mm)conditions(Table 3). Meanwhile, medium temperature(20. 9° C)but high precipitation(1020 mm)conditions contributed to the smallest gap(12 kg ha-1)inJiangcheng, Yunnan Province.
 |
| Fig. 5. Interdecadal changes in the gap(kg ha-1)between light-temperature and climatic potential productivity ofmaize in SWC from 1961 to 2010. (a)The 1960s, (b)the 1970s, (c)the 1980s, (d)the 1990s, and (e)the 2000s. |
There has been a significant spatiotemporalchange in the interdecadal potential productivity gapduring the past 50 years, although the growing season average potential productivity gap across SWChas seen little change(Fig. 5). The maize potentialproductivity gap showed a decreasing trend from the1960s to the 1990s, as indicated by the decrease in theproportion of high values(> 1500 kg ha-1)along withan increase in the proportion of low values(< 500 kgha-1). In the 2000s, however, the proportion of highvalues increased and the proportion of low values decreased, compared to the case in the 1990s. 3. 4 Sensitivity of climatic potential productiv-ity to key climate variables
Figure 6 shows that increasing sunshine hourscaused the increase in climatic potential productivity when other climate variables were kept constant. The sensitivity coefficients for sunshine hours rangedfrom 0. 3 to 0. 4(p < 0. 01), which means that a 10% increase in sunshine hours, while all other variables wereheld constant, would increase climatic potential productivity by 3%-4%. The changes in minimum and maximum temperatures resulted in larger changes inclimatic potential productivity for stations with lowtemperatures(row 1 in Fig. 6), and the sensitivity coefficients were about 1. 5(p < 0. 01). For the stationswith medium and high temperatures(rows 2 and 3 inFig. 6), the increase in temperature resulted in a smallincrease, or even a decrease, in climatic potential productivity because growing season temperature reached and even exceeded the optimal temperature for maizegrowth at these stations. The sensitivity coefficientsfor maximum temperature were larger than those forminimum temperature in many cases. The sensitivitycoefficient for precipitation varied from 0. 01 to 0. 28(p < 0. 01). Changes in precipitation from -20% to20% showed a large increment of climatic potentialproductivity at those stations with low precipitationcompared to those in the high precipitation category.
 |
| Fig. 6. Changes in climatic potential productivity at di®erent stations due to changes of daily sunshine hours(SH), maximum temperature(Tmax), minimum temperature(Tmin), and precipitation(P)by -20%, -15%, -10%, -5%, 0, 5%, 10%, 15%, and 20%, respectively, without changing any other variables. Changes in yield were the di®erence betweensimulated values and the original values of climatic potential productivity. The linear slope of the sensitivity curve isshown, and ** indicates statistical significance at p < 0. 01. |
Evaluating the potential productivity and potential productivity gap is helpful for underst and ing thelimitation of light, temperature, and rainfall resourceson crop production(Yuan et al., 2012). In this study, we analyzed the variations in climate factors and theirimpact on maize potential productivity(photosynthetic, light-temperature, and climatic)in SWC overthe period 1961-2010, and then quantified the spatial and temporal variations in the gap between light-temperature and climatic potential productivity.
Average temperature during the maize growingseason increased by 0. 55° C from 1961 to 2010 in SWC. The increment is lower than that in the whole China, where average temperature has increased by 1. 20° Csince 1960(Piao et al., 2010). Over the past fivedecades, growing season minimum temperature has increased significantly by 0. 20° C per decade(p < 0. 01), whereas an increase of only 0. 06° C per decade(p >0. 05)was detected in growing season maximum temperature. Across Northeast China, however, growingseason maximum and minimum temperatures have increased by 0. 36(p < 0. 01) and 0. 41(p < 0. 01)perdecade, respectively, in the last 30 years(Liu et al., 2012). Growing season sunshine hours showed a noticeable decline in SWC, consistent with the resultsreported by Xiong et al. (2010)over the whole China. The decline in sunshine hours decreased photosynthetic potential productivity significantly at 63% of allthe study stations(p < 0. 05; Fig. 3d). However, thedecrease in photosynthetic potential productivity wasoffset partly by the increase in temperature. Thus, thelight-temperature potential productivity showed a lessmarked decrease compared to photosynthetic potential productivity, decreasing significantly at only 30%of all the study stations(p < 0. 05; Fig. 3e). The di-rections of change in light-temperature and climaticpotential productivity were similar due to the incon-spicuous change and high variability of precipitation.
The higher values of maize potential productivityin SWC occurred mostly in maize-growing districts IV and V, in which Yunnan and Sichuan provinces are located. The spatial change in maize potential productivity did not follow a decreasing trend with latitudedue to the complex topographic conditions in theseregions. The distribution of areas with high valuesof photosynthetic potential productivity was differentto that with high values of light-temperature productivity due to altitude changes in Yunnan Province. Areas with high values of photosynthetic productivity were mainly located in the northern and centralYunnan Province; however, those with high values oflight-temperature potential productivity were mainlylocated in southern parts of Yunnan Province(Figs. 3a and 3b). In contrast, over the North China Plain, the simulated potential yield decreased generally fromnorth to south due to the latitudinal distribution ofsolar radiation and growing season temperature(Wu et al., 2006).
There is great potential to increase maize potential productivity by improving the water supplyin Northeast China, North China, and the Beijing-Tianjin-Hebei region in China(Albersen et al., 2002; Wang et al., 2011). In SWC, precipitation during themaize growing season ranged from 412 to 608 mmin the different maize-growing districts, which in theory can meet the water requirements of maize. However, in our study, a distinct gap between maize light-temperature and climatic potential productivity exists, varying from 12 to 2729 kg ha-1, which presentsa maize potential productivity loss due to water stresscaused by uneven precipitation distribution during themaize growing season. As shown in Fig. 6, the largestyield gap was located in eastern Sichuan Province and central Yunnan Province. For instance, in Yuexi and Bazhong cities, both located in Sichuan Province, withequal precipitation during the maize growing season(524 mm), the potential productivity gap was 172 and 1320 kg ha-1, respectively. We found to increasemaize potential productivity by improving the watersupply at stations with a large potential productivity gap, such as Bazhong City. Analyzing the potential productivity gap could help identify where and towhat extent maize yield can be improved when irrigation water is available.
The sensitivity of climatic potential productivityto climate variables changed with location in SWC. Increases in temperature generally caused a reductionin climatic potential productivity at stations in thehigh temperature category, whereas it contributed toan increase in climatic potential productivity at stations in the low temperature category. The effects ofan increase in maximum and minimum temperatureswere similar in SWC; however, in Northeast China, asimulated increase in maximum temperature generallycaused a reduction in yield potential, while an increasein minimum temperature produced no significant impact on yield potential(Liu et al., 2012). According tothe IPCC Fourth Assessment Report, the temperature and precipitation are very likely to increase in EastAsia during the 21st century, as projected by globalclimate models(Solomon et al., 2007). Based on ourfindings, warming and increased precipitation wouldfavor future maize production at stations in the lowtemperature and low precipitation categories.
The length of maize growing season has changedin the recent 50 years under climate change. In addition, farmers have employed medium and late maturing hybrids, which are more suitable to a warmerclimate(Liu et al., 2012; Wang et al., 2014). In ourstudy, the same length of maize growing season in eachof maize-growing districts was assumed for the wholestudy period, so the impact of changing maize growthduration on climate change trend had been eliminatedin deriving the change trend in climate factors(e. g., temperature, precipitation).
It is important to note that potential productivity is not completely consistent with actual yield. Thelatter is affected by many factors such as climate, soil, and hybrid types. A subsequent study should quantifythe influence of different hybrids, management practice(e. g., irrigation, fertilizer use), sowing dates, etc., on maize growth and development in SWC. In addition, crop growth model simulations should be tested and applied in further research, which is an approachthat has been used successfully in agricultural production analyses in the North China Plain and NortheastChina.
In conclusion, we analyzed the impact of climate change on the spatial and temporal variations ofmaize photosynthetic, light-temperature, and climaticpotential productivity from 1961 to 2010 in SWC. In doing so, we have demonstrated that a distinctgap between light-temperature and climatic potentialproductivity exists in parts of the study area whereannual and growing season precipitation is sufficient. We have also identified that there is an opportunityto increase maize yield in SWC via rational watermanagement, as is the case in other climate regions ofChina, such as Northwest China and the North ChinaPlain.
| [1] | Albersen, P., G. Fischer, M. Keyzer, et al., 2002: Estimation of Agricultural Production Relations in the LUC Model for China. International Institute for Applied Systems Analysis Press, Laxenburg, Austria, 60 pp. |
| [2] | Allan, J. C., J. R. Kiniry, and P. T. Dyke, 1986: CERES-Maize: A Simulation Model of Maize Growth and Development. Food and Agriculture Organization of the United Nations, 194 pp. |
| [3] | Allen, R. G., L. S. Pereira, D. Rates, et al., 1998: Crop Evapotranspiration-Guidelines for Computing Crop Water Requirements. FAO Irrigation and Drainage Paper 56, Rome, FAO, 1-15. |
| [4] | Binder, J., S. Graeff, J. Link, et al., 2008: Model-based approach to quantify production potentials of summer maize and spring maize in the North China Plain. Agronomy Journal, 100, 862-873. |
| [5] | Chen, C., W. E. Baethgen, and A. Robertson, 2013: Contributions of individual variation in temperature, solar radiation and precipitation to crop yield in the North China Plain, 1961-2003. Climatic Change, 116, 767-788. |
| [6] | Chen Changqing, Lei Chengxia, Wang Chunchun, et al., 2011: Changes of spring maize potential produc-tivity under the background of global warming in Northeast China. Scientia Geograph. Sinica, 31, 1272-1279. (in Chinese) |
| [7] | Diepen, C. V., J. Wolf, H. V. Keulen, et al., 1989: WOFOST: A simulation model of crop production. Soil Use and Management, 5, 16-24. |
| [8] | Evans, L. T., and R. A. Fischer, 1999: Yield potential: Its definition, measurement, and significance. Crop Science, 39, 1544-1551. |
| [9] | Gong, L., C. Xu, D. Chen, et al., 2006: Sensitivity of the Penman-Monteith reference evapotranspiration to key climatic variables in the Changjiang (Yangtze River) basin. J. Hydrol., 329, 620-629. |
| [10] | Grassini, P., H. Yang, and K. G. Cassman, 2009: Lim-its to maize productivity in western corn-belt: A simulation analysis for fully irrigated and rainfed conditions. Agri. Forest Meteor., 149, 1254-1265. |
| [11] | Guo Qingfa, Wang Qingcheng, and Wang Liming, 2004: Chinese Maize Cultivation. Shanghai Scientific and Technical Press, Shanghai, China, 63-69. (in Chinese) |
| [12] | Huang Bingwei, 1985: Agricultural Productive Potent-iality-Photosynthetic Potential in China. Science Press, Beijing, China, 15-22. (in Chinese) |
| [13] | Kassam, A. H., L. Naiken, G. Fischer, et al., 1982: Po-tential Population Supporting Capacities of Lands in the Developing World. Food and Agriculture Or-ganization of the United Nations, Roma, 139 pp. |
| [14] | Keating, B. A., P. S. Carberry, G. L. Hammer, et al., 2003: An overview of APSIM, a model designed for farming systems simulation. European Journal of Agronomy, 18, 267-288. |
| [15] | Li Kenan, Yang Xiaoguang, Liu Zhijuan, et al., 2010: Analysis of the potential influence of global climate change on cropping systems in China. III: The change characteristics of climatic resources in north-ern China and its potential influence on cropping systems. Scientia Agricultura Sinica, 43, 2088-2097. (in Chinese) |
| [16] | Liu Jiandong, Yu Qiang, Min Qingwen, et al., 2002: Impacts of water stress on agroclimatic resources of summer maize in Huanghuaihai Plain of China: Impact of water stress on regional productivity. Re-source Science, 24, 92-95. (in Chinese) |
| [17] | Liu, Z., X. Yang, K. G. Hubbard, et al., 2012: Maize potential yields and yield gaps in the changing climate of Northeast China. Global Change Biology, 18, 3441-3454. |
| [18] | Liu Zongyuan, Zhang Jianping, Luo Hongxia, et al., 2014: Temporal and spatial distributions of maize drought in Southwest China based on agricultural reference index for drought. Trans. Chinese Soc. Agri. Engi-neering, 30, 105-115. (in Chinese) |
| [19] | McCown, R. L., G. L. Hammer, J. N. G. Hargreaves, et al., 1996: APSIM: A novel software system for model development, model testing and simulation in agricultural systems research. Agricultural Systems, 50, 255-271. |
| [20] | Pan Guangtang and Yang Kecheng, 2012: Facing toward challenges and corresponding strategies for maize breeding in southwestern region of China. Acta Agronomica Sinica, 38, 1141-1147. (in Chinese) |
| [21] | Piao, S., P. Ciais, Y. Huang, et al., 2010: The impacts of climate change on water resources and agriculture in China. Nature, 467, 43-51. |
| [22] | Qin, N., X. Chen, G. Fu, et al., 2010: Precipitation and temperature trends for Southwest China: 1960-2007. Hydrological Processes, 24, 3733-3744. |
| [23] | Qin, Y., J. Liu, W. Shi, et al., 2013: Spatial-temporal changes of cropland and climate potential produc-tivity in northern China during 1990-2010. Food Security, 5, 499-512. |
| [24] | Solomon, S., D. Qin, M. Manning, et al., 2007: Climate Change 2007: The Physical Science Basis. Cam-bridge University Press, 996 pp. |
| [25] | van Ittersum, M. K., and R. Rabbinge, 1997: Concepts in production ecology for analysis and quantification of agricultural input-output combinations. Field Crops Research, 52, 197-208. |
| [26] | Wang, E., Q. Yu, D. Wu, et al., 2008: Climate, agri-cultural production and hydrological balance in the North China Plain. Int. J. Climatol., 28, 1959-1970. |
| [27] | Wang, J., E. Wang, X. Yang, et al., 2012: Increased yield potential of wheat-maize cropping system in the North China Plain by climate change adaptation. Climatic Change, 113, 825-840. |
| [28] | —-, —-, H. Yin, et al., 2014: Declining yield poten-tial and shrinking yield gaps of maize in the North China Plain. Agri. Forest Meteor., 195-196, 89-101. |
| [29] | Wang Mingtian, Wang Xiang, Huang Wanhua, et al., 2012: Temporal and spatial distribution of seasonal drought in Southwest China based on relative mois-ture index. Trans. Chinese Soc. Agri. Engineering, 28, 85-92. (in Chinese) |
| [30] | Wang Tao, Lu Changhe, and Yu Bohua, 2011: Pro-duction potential and yield gaps of summer maize in the Beijing-Tianjin-Hebei Region. J. Geograph. Sci., 21, 677-688. |
| [31] | Wang Zongming, Zhang Bo, Zhang Shuqing, et al., 2005: Studies on agricultural climatic potential productiv-ity and natural resources utilization ratio in Songnen Plain of Heilongjiang Province. Chinese J. Agrome-teor., 26, 2-6. (in Chinese) |
| [32] | Wu, D., Q. Yu, C. Lu, et al., 2006: Quantifying produc-tion potentials of winter wheat in the North China Plain. European Journal of Agronomy, 24, 226-235. |
| [33] | —-, —-, E. Wang, et al., 2008: Impact of spatial-temporal variations of climatic variables on summer maize yield in the North China Plain. Int. J. Plant Production, 2, 71-88. |
| [34] | Xiong, W., I. Holman, E. Lin, et al., 2010: Climate change, water availability and future cereal produc-tion in China. Agriculture, Ecosystems & Environ-ment, 135, 58-69. |
| [35] | Yang Xiaohuang, Cheng Chuanzhou, and Li Yuejiao, 2010: Effect of cropland occupation and supple-ment on light-temperature potential productivity in China from 2000 to 2008. Chinese Geograph. Sci., 20, 536-544. |
| [36] | Yuan Bin, Guo Jianping, Ye Mingzhu, et al., 2012: Vari-ety distribution pattern and climatic potential pro-ductivity of spring maize in Northeast China under climate change. Chin. Sci. Bull., 57, 3497-3508. |
| [37] | Zhang Mingjun, He Jinyun, Wang Baolong, et al., 2013: Extreme drought changes in Southwest China from 1960 to 2009. J. Geograph. Sci., 23, 3-16. |
| [38] | Zhang, W., F. Jin, J. Zhao, et al., 2013: The possible influence of a non-conventional El Niño on the se-vere autumn drought of 2009 in Southwest China. J. Climate, 26, 8392-8045. |