 2014, Vol. 28
The Chinese Meteorological Society
Article Information
- GUO Pinwen, ZHANG Xiakun, ZHANG Shuyu, WANG Chunling, ZHANG Xiao. 2014.
- Decadal Variability of Extreme Precipitation Days over Northwest China from 1963 to 2012
- J. Meteor. Res., 28(6): 1099-1113
- http://dx.doi.org/10.1007/s13351-014-4047-x
Article History
- Received February 13, 2014;
- in final form May 17, 2014


2 Key Laboratories of Arid Climate Change and Disaster Reduction of Gansu Province, Lanzhou Institute of Arid Meteorology, China Meteorological Administration, Lanzhou 730020;
3 School of Applied Meteorology, Nanjing University of Information Science & Technology, Nanjing 210044;
4 Institute of Atmospheric Physics, Chinese Academy of Sciences, Beijing 100029
As a result of global warming, the temperature inChina has exhibited an increasing trend since the 20thcentury . The frequency of extreme weather and climate events has also increased and thus drawn the attention of meteorological researchers(Zou et al., 2009).Studies show that extreme weather events have causedserious weather and climate disasters(Johanna and Jenny, 2002; Chen et al., 2012; Wang et al., 2012).
The classification of extreme weather and climateevents has spurred intensive debates. Working GroupI of the Intergovernmental Panel on Climate Change(IPCC)suggested that extreme weather and climateevents can be classified based on ev aluation of thefollowing four elements:(1)maximum and minimumtemperature, diurnal temperature range, hot and coldperiod length, and heat index;(2)precipitation intensity and frequency, including drought and wet periods;(3)tropical cyclones(including cyclone intensity, track, frequency, location, maximum wind speed, probable maximum intensity, and sea surface temperature) and extratropical cyclones(including stormtrack, sea-level pressure gradient, wind, water level, storm surge, and wave height); and (4)thunderstorms and other microscale weather, including tornadoes and related phenomena, such as hail, lightning, dust devil, waterspout, downpour, snowstorm, and cloud surge.
Based on analysis of average precipitation in the20th century, Iwashima and Yamamoto(1993), Tosnis(1996), and Fu et al.(2006)found that the frequency and intensity of extreme precipitation eventshave significantly changed worldwide. During the 20thcentury, precipitation increased by 5%-10%, and thefrequency of extreme precipitation events increased byan average of 2%-4% over continents in the mid-highlatitudes of the Northern Hemisphere(Milly et al., 2002). The results of numerical modeling show thatthe regional climate condition demonstrates a polarizing trend under doubled concentrations of greenhousegases(Zwiers and Khrin, 1998; Bell et al., 2004; Pal et al., 2004; Min and Qian, 2008).
Zhai et al.(2005)discovered that the frequency ofextreme precipitation(more than 95% of the daily precipitation sequence)events has exhibited an increasing trend over Northwest China in recent years. Thenumber of extreme precipitation events has also increased by 100%. Y ang et al.(2007)found a significant difference between the frequency of extremeprecipitation and spatial distribution of rainfall during the flood season in Northwest China. Chen etal.(2013)indicated that Northwest China witnessedfluctuations in precipitation in the last 40 years, and different anomaly regions showed different trends withobvious periodic, annual, and decadal variations. Shiet al.(2002)showed that precipitation in NorthwestChina has exhibited an increasing trend over the pastcentury . They also found that the increased frequencyof extreme weather events can be associated with climate transformation from wet to dry . Chen et al.(2012) and Zhang et al.(2012)emphasized that thefrequency of extreme weather events and the degreeof damage resulting from these events will continue toincrease.
Northwest China is located in arid and semi-aridregions, under certain influences of terrain and othergeographic conditions. Extreme precipitation eventspose a serious threat to the ecological environmentof Northwest China and can seriously restrict the development of the local economy(Zhang et al., 2012;Zhang and Dai, 2012; Chen et al., 2013). Studying thespatiotemporal distribution of extreme precipitationevents in Northwest China is important to meteorological disaster prevention and mitigation. This studydiscusses the spatiotemporal distribution of extremeprecipitation in Northwest China during summer. Italso aims to show the regularity and characteristics ofextreme precipitation events in Northwest China overthe past 50 years.2. Data and methods
The data used in this study were gathered fromthe "China's ground, high-altitude, and radiation station basic information list" released by the data service section of the National Meteorological Information Center(NMIC)of China. Precipitation datafrom 177 stations in 5 northwestern provinces/regions(Gansu Province, Ningxia Region, Qinghai Province, Shaanxi Province, and Xinjiang Region)from 1961 to2012 were selected. These data include those from1961 to 2010 of the "1951-2010 monthly data of Chinanational ground station data corrected file(A0/A1/A)basic dataset" compiled by the ground meteorologicaldata archive construction project. Data from January2011 to August 2012 were based on the monthly report submitted by each province/region to the NMIC, and data from September 2012 to October 2012 werebased on real-time records of the NMIC.
Daily precipitation intensity was categorized intothe following five grades: sprinkle rain(6 10 mmday-1), moderate rain(10-25 mm day-1), heavyrain(25-50 mm day-1), torrential rain(50-100 mmday-1), and downpour(> 100 mm day-1). In thisstudy, extreme heavy precipitation event days weredefined as the days with rainfall of more than 25 mmday-1. Stations with considerable missing data on theextreme precipitation events were excluded. Finally, 153 stations were selected.
Based on multi-stage fitting, we conducted nineyear sliding-moving t-test, wavelet analysis, Mann-Kendall(M-K)test, and analysis on spatiotemporal variations of the extreme precipitation frequency .Northwest China was further divided into three subregions with clustering analysis on the extreme precipitation frequency time series at each of the 153 stationsfor 1963-2012.3. Spatial distribution of extreme precipitationevent frequency
Figure 1 shows the spatial distribution of the frequency and variance of extreme precipitation eventsduring summer in Northwest China over the past 50years. A high frequency of summer extreme precipitation was observed in the south of Qinghai to Shaanxi, where the average annual extreme precipitation daysreached 12 days(Fig. 1a). The maximum area waslocated in southern Qinghai, Gansu, and southernShaanxi, where the average annual extreme precipitation days reached 16 days. The average annual extreme precipitation days in the eastern region of theTanggula Mountains reached 20 days, a result indicating that this area was most prone to heavy precipitation. Meanwhile, the regions with the lowest frequency were located in the T arim and Junggar basinsin Xinjiang(north of the Kunlun Mountains). Extreme precipitation days were fewer in the T arim basin(< 4 days)than in other areas. This phenomenon isassociated with drought. The extreme precipitationfrequency in the central region of Qinghai showed thelargest meridional gradient. The average annual extreme precipitation frequency in northern Qinghai wasless than 8 days, whereas that in the southern regionreached 20 days.
 |
| Fig. 1. Geographical distributions of(a)the annual mean number of heavy rainfall days(over 12 within the shadedarea) and (b)the corresponding st and ard deviation(day yr-1; over 4 within the shaded area)from 1961 to 2012. |
The large st and ard deviation of heavy rainfalldays during summer was nearly collocated with thelarge frequency of annual extreme precipitation days(Fig. 1b). Large st and ard deviation of more than3.5 days yr-1occurred over southern Qinghai and theHetao region. The st and ard deviation over the easternT angula Mountain in southern Qinghai reached 6 daysyr-1, indicating a large difference in the interannualvariability of extreme precipitation frequency . Similarto the distribution of extreme precipitation frequency, a small st and ard deviation occurred in Xinjiang Region(< 2 days yr-1).
To study the spatial variation of heavy rainfallevent(HRE)frequency, the annual extreme precipitation frequency anomaly from 1961 to 2012 was decomposed by empirical orthogonal function(EOF)analysis. The variances of the first, second, and third feature vector fields were 17.4%, 14.9%, and 7.3% of the total variance, respectively .
The positive load of the first eigenvector field(Fig. 2a)covered most of the study area and thusreflected the consistency of extreme summer precipitation frequency in Northwest China. The center ofa large load value was located in southern Qinghai and southern Shaanxi, indicating the largest changerate of extreme precipitation frequency in these areas.The corresponding temporal coeffcient exhibited mutations(Fig. 2b)around 1979. The early period wasmainly negative, whereas the late period was mostlypositive. This finding validates the low frequency ofextreme precipitation in Northwest China during theearly period and the high frequency during the lateperiod. Figure 2b also shows the decadal variabilities with negative values during the 1960s-1970s and 1995-2004, and positive values during 1979-1995 and 2004-2012.
 |
| Fig. 2. First leading mode of the EOF analysis on the leading 20 EOFs of the normalized HRE(heavy rainfall event)frequency from 1961 to 2012 in Northwest China.(a, c, e)The first, second, and third eigenvector fields, and (b, d, f)the corresponding temporal coeffcients. |
The second eigenvector field(Fig. 2c)was distinguished from the first eigenvector field in spatialdistribution. The second eigenvector was positive insouthern Qinghai, and the largest load-capacity areawas located in the north of the T angula Mountain.Meanwhile, the value was negative in southern Gansu, Ningxia, and Shaanxi. The largest load-v alue areawas located in southern Gansu, Ningxia, and northern Shaanxi. Therefore, the changed characteristic insouthern Qinghai was opposite to those of southernGansu, Ningxia, and Shaanxi. The distribution of extreme precipitation frequency from Shaanxi to Qinghaihad a west-high and east-low feature or vice versa. Thecorresponding time coeffcient(Fig. 2d)was almostentirely negative before 1997 and positive after 1997.This result indicates that the extreme precipitationfrequency was low during the early stage in Qinghai, but it was high in the Shaanxi-Gansu-Ningxia area.The frequency was reversed during the late period.Figure 2d shows an increasing trend from large negative values during the 1960s-1970s to positive valuesafter 2000.
 |
| Fig. 3. HRE frequency time series(dashed line) and its fifth-order polynomial(solid line) and average for each decade(asterisk)for(a)Northwest China, (b)Gansu Province, (c)Ningxia Region, (d)Qinghai Province, (e)Xinjiang Region, and (f)Shaanxi Province from 1963 to 2012(unit: number of occurrences per year per station). |
In the third characteristic vector field(Fig. 2e), the high value located in eastern Qinghai, southernGansu, and Shaanxi was positive; the large load capacity was located in southern Shaanxi. Therefore, thetendency of Qinghai was opposite that of the southern Gansu-Shaanxi area. The east-west difference inthese two areas was the third space exception type.The corresponding time coeffcient(Fig. 2f)was almost entirely positive before 1995 and negative after1995. This result indicates that the extreme precipitation frequency during the early stage was low inQinghai but high in Shaanxi, whereas that of the lateperiod was opposite. Figure 2f depicts a decreasingtrend from positive values during the 1960s-1980s tonegative values during the 1990s-2000s.4. Time variation of extreme precipitation frequency4.1 The time series of extr eme precipitationfr equency
Figure 3 shows the time series of extreme precipitation frequency, its fifth-order polynomial fitting, and decadal values in northwestern provinces/regions.Extreme precipitation frequency generally exhibitedan increasing trend in Northwest China. Gansu and Ningxia demonstrated a slightly downward trend. Bycontrast, Qinghai and Xinjiang showed an upwardtrend, particularly in Qinghai, where the average number of HRE days from 2003 to 2012 increased by approximately 1.5 days compared with that from 1963to 1972. Shaanxi did not exhibit any notable trend.
Mutation testing of the time series in NorthwestChina by using the M-K method(Huang et al., 2012)showed that a mutation in extreme precipitationfrequency occurred in 1979(Fig. 4). UF tracts were mainly negative before 1979, but these became positive after 1979. The results show that the extremeprecipitation frequency in Northwest China increasedafter 1979. The analysis result exceeded the criticalvalue after 1985, indicating that the extreme precipitation frequency exhibited a significant upward trendwith the fastest rising period during the 1990s. Theintersection point of UF and UB(UF and UB st and for the forward sequential statistic and backward sequential statistic of M-K test), i.e., the frequencymutation point located within the line of the significant level confidence(ff1.96), appeared from 1978to 1979. These findings suggest that extreme precipitation frequency exhibited mutations from 1978to 1979 in Northwest China, and an increasing trendwas recorded in the late period, particularly in recentyears.
 |
| Fig. 4. Temporal variation in the frequency of HREs in Northwest China through M-K analysis. |
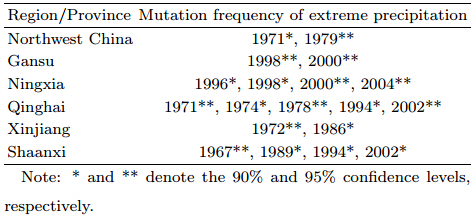
To verify the accuracy of the mutation points, we conducted a 9-yr sliding test(Cheng and Wang, 2004)on the extreme precipitation frequency for eachprovince/region in Northwest China. Table 1 showsa mutation in 1979, which is similar to that found inthe M-K analysis(Fig. 4). Considerable mutationsoccurred around 1977 and from 1994 to 2002. A largemutation occurred during the 1970s in Qinghai and Xinjiang. The mutation time span in Shaanxi was generally similar, but the mutation intensity was less thanthose in Qinghai and Xinjiang, and the frequency didnot exhibit any trend. The frequencies barely changed in Gansu and Ningxia during the early period, and mutations mainly occurred after the 1990s.
 |
Wavelet analysis was performed to elucidate themutation of extreme precipitation frequency in northwestern provinces/regions over the past 50 years(Niu et al., 2004; Shao et al., 2006; Jiang et al., 2009).The result of the wavelet analysis shows a 2-yr cyclical swing of extreme precipitation frequency in Northwest China(Fig. 5a). On a timescale of 10 yr or more, a noticeable mutation occurred in 1979. This mutation value was negative during the early stage and positive during the late stage. The maximum valuewas observed from 1985 to 1995, indicating that thefrequency rapidly increased after the mutation point.The maximum frequency occurred during the 1990s, afinding that is consistent with previous analyses(Niu et al., 2004; Shao et al., 2006; Jiang et al., 2009).
 |
| Fig. 5. Wavelet spectra of heavy rainfall days in Northwest China and in each province/region from 1963 to 2012 withMexican hat wavelet analysis.(a)Northwest China, (b)Gansu Province, (c)Ningxia Region, (d)Qinghai Province, (e)Xinjiang Region, and (f)Shaanxi Province. The dark black and gray areas denote negative and positive values, respectively . |
A 2-4-yr cyclical swing occurred in GansuProvince(Fig. 5b). On the decadal scale, the valuewas negative before 1975 and after 1995, and it waspositive from 1975 to 1995. Mutation occurred in1997. This result indicates that the extreme precipitation frequency from 1975 to 1995 was high, whereasthe lowest frequency occurred in Gansu Province from2000 to 2010. A 2-4-yr cyclical swing was also observed in Ningxia Region(Fig. 5c). However, on a4-14-yr time scale, the frequency was low during theearly and late years, but it was high in between. Themutation point occurred in 2000.
A low-high-low-high trend was observed in Qinghai Province(Fig. 5d). On the 6-8-yr timescale, thevalue was low in 1970 and 2000, but it was high around 1985 and 2010. The interdecadal timescale generallyexhibited an increasing trend. A noticeable mutationoccurred in 1979. A 2-4-yr cyclical swing occurredin Xinjiang Region. The minimum value occurred in1975, whereas the maximum value occurred in 2000.Meanwhile, a 3-10-yr cyclical swing was observed inShaanxi Province(Fig. 5f). Two maximum and minimum values were found. The minimum values occurred in 1975 and 2000, whereas the maximum values occurred in 1986 and 2008. A significant mutationoccurred in 1979, 1990, and 2002(Fig. 5f).4.3 Dec adal variability
The differences in the 10-yr mean extreme precipitation frequency between two adjacent decades from1963 to 2012 were calculated to analyze the decadalvariation of extreme precipitation frequency in Northwest China(Fig. 6). In northern Qinghai, the central and western Gansu and eastern Xinjiang showeda similar horizontal distribution, but they exhibitedless intensities compared with those in southern Qinghai, Shaanxi, and southern Gansu. This phenomenon may be related to the mountainous topography ofsouthern Qinghai, Shaanxi, and southern Gansu, which favors the development of cyclones. By contrast, northern Qinghai, central and western Gansu, and eastern Xinjiang are characterized by northerlywesterly winds, which favor the development of anticyclones.
 |
| Fig. 6. Horizontal distributions of the differences in 10-yr mean heavy rainfall days(day yr-1)between(a)the 1970s and 1960s, (b)the 1980s and 1970s, (c)the 1990s and 1980s, and (d)the 2000s and 1990s. Negative areas are shaded.Table 1. Abrupt change(mutation)years of heavyrainfall events in Northwest China from 1963 to 2012on the basis of a 9-yr sliding-moving t-test. |
In the present study, Northwest China was furtherdivided according to the frequency trend characteristics of extreme precipitation(Fig. 7). We used clusteranalysis to the time series of extreme precipitation frequency to study the characteristics of the region(seealso Cheng et al., 1998, 2001). Northwest China canbe divided into three regions, namely, Xinjiang to thenorth of Gansu and west of the T arim basin(Zone1; Fig. 7a), west of Qinghai and the Shaanxi-GansuNingxia area(Zone 2; Fig. 7c), and southern Qinghaito the southern Shaanxi and Hexi Corridor area(Zone3; Fig. 7e).
 |
| Fig. 7. Zones divided by cluster analysis of the time series of extreme precipitation frequency of each station inNorthwest China(a, c, e) and their wavelet analysis(b, d, f). |
Wavelet analysis shows that Zone 1(Fig. 7b)underwent a mutation during the late 1980s and around2000, and the extreme precipitation frequency significantly increased between these two mutation points.The minimum frequency appeared in 1973, whereasthe maximum one occurred in 1998. Zone 2(Fig. 7d)exhibited a mutation from 1978 to 1979 on the decadaltimescale. The precipitation in Zone 2 significantly increased compared with that in Zone 1. Zone 3(Fig. 7f)exhibited periodic oscillation trends on the 3-15-yrtimescale. One maximum(in 1985) and two minimum(around 1970 and 1999)frequencies occurred over thepast 50 years. The mutations occurred in 1978 and 1992.5. Factors influencing the extreme precipitation events5.1 Stratification stability
The two important factors that affect precipitation development are moisture and thermal stability .Chen et al.(2012) and Zhang et al.(2012)introducedan index(K)to denote these two factors, which canbe expressed as
where T is the air temperature and Tdis the dewpoint temperature. On the right side of Eq.(1), thefirst term represents the temperature-lapse rate in thelower troposphere, the second term denotes the moisture in the lower troposphere, and the third term indicates the atmospheric saturation and thickness of wetair in the mid troposphere. The increase in the possibility of extreme precipitation can be associated withthe increase in K.
The K index of Northwest China(Fig. 8a) and the individual provinces/regions(Figs. 8b-f)generallyexhibited an increasing trend before the 1990s, whichfavored the development of extreme precipitation(seeFig. 3). The K index in Gansu and Ningxia showeddecadal tendencies similar to those of the extreme precipitation frequency in the same region. The K indexin Qinghai mainly presented an increasing trend, except for a brief decline during the 1980s. In Xinjiang, the similarity between the K index and extreme precipitation variation trends was low. The possible reasons might be the dry air, small precipitable water, and low atmospheric humidity significantly affectingthe extreme precipitation in Xinjiang.
 |
| Fig. 8. The K index time series(dashed line) and its fifth-order polynomial(solid line) and average for each decade(asterisk)for(a)Northwest China, (b)Gansu Province, (c)Ningxia Region, (d)Qinghai Province, (e)Xinjiang Region, and (f)Shaanxi Province from 1963 to 2012. |
Figure 9 shows the mean difference of the K indexbetween each decade from 1963 to 2012. The decadalchanges of K over Northwest China were mainly positive between the 1970s and 1960s(Fig. 9a) and thusfavored extreme precipitation. The negative decadalchanges of K were mainly located in southern Qinghai. The interdecadal average difference of the K exponential was fundamentally similar to that of extremeprecipitation. Therefore, the change in extreme precipitation frequency was significantly related to the Kindex from the 1960s to the 1970s.
 |
| Fig. 9. Decadal changes of the K index from 1963 to 2012. The mean difference between(a)the 1970s and 1960s, (b)the 1980s and 1970s, (c)the 1990s and 1980s, and (d)the 2000s and 1990s. |
Between the 1980s and 1970s(Fig. 9b), the me and ifference of K in Qinghai and most areas of Xinjiang was negative, and the area with the minimumvalue was located in northern Xinjiang. Positive values were observed in the other regions. The area withthe maximum value was in Ningxia and northern Xinjiang. During this period, the extreme precipitationfrequency(Fig. 6b)was generally increasing, exceptfor a slight decrease in a few areas in central Xinjiang and in northern and southern Gansu. The frequency in the other regions, particularly in southernQinghai, Gansu, and southern Shaanxi, significantlyincreased. Therefore, during this period in western Qinghai, southern Gansu, Ningxia, and Shaanxi, the extreme precipitation frequency was significantly affected by the K index. The frequency changes insouthern Qinghai differed from the changes of the Kindex.
Comparison between the 1990s and 1980s(Fig. 9c)showed negative values in the Shaanxi-GansuNingxia area, southern Xinjiang, and northern Qinghai. The minimum value was located in southern Xinjiang. Positive values were found in western and northern Xinjiang and southern Qinghai. The corresponding average extreme precipitation frequency difference(Fig. 6c)indicates that the rainfall days in southern Gansu, Ningxia, and Shaanxi were noticeably reduced, whereas those in other regions were increasedor unchanged. Therefore, good correspondence wasobserved between the changes in the K index and thechanges in extreme precipitation frequency .Comparison between the 2000s and 1990s(Fig. 9d)showed negative values in most areas, except incentral and southern Qinghai. The minimum valueoccurred in western Xinjiang and southern Shaanxi, whereas the maximum value occurred in southernQinghai. With regard to the corresponding me and ifference of extreme precipitation frequency betweeneach decade(Fig. 6d), the frequency increased in mostareas of Qinghai and southern Gansu, but it decreasedin northern and central Gansu and northern Xinjiang, corresponding well to the K index. This analysis indicates that the change in the K index was similar tothat in the extreme precipitation frequency, and thesimilarity was high in Qinghai, Shaanxi, Ningxia, and Gansu.
The horizontal distributions of temperature and humidity in the upper and lower troposphere for thepast 10 years(2003-2012)were analyzed to explain thechange in the K index(Fig. 10). Warming and moistening in the lower troposphere and cooling and drying in the upper troposphere were observed, except insouthern Xinjiang. The temperature and humidity inthe upper and lower troposphere significantly changedin northern Qinghai and southern Gansu. This phenomenon is consistent with the positive difference ofthe K index in northern Qinghai and southern Gansu.This phenomenon also exhibited a good relationshipwith the increased frequency of extreme precipitationin northern Qinghai and southern Gansu. The increase in temperature and humidity at low altitudes and the decrease at high altitudes are caused by climate change in Northwest China. These changes ledto the increase in the K index and thus the frequencyof extreme precipitation events.
 |
| Fig. 10.(a, c)Temperature(°C) and (b, d)humidity(%)anomaly distributions in the(a, b)upper and (c, d)lowertroposphere(2003 to 2012, with 1963 to 2012 as the st and ard). |
The inconsistency between Figs. 9 and Figs. 6 revealsthat the K index cannot fully explain the changes inextreme precipitation days. Therefore, the analysis inSection 5.1 may not be suffcient, and the influencesof moisture and dynamic factors may need to be considered. The precipitable water can be expressed as
where q is the specific humidity(water vapor mixing ratio)of each layer, and p0 is the surface pressure(Zhang et al., 2012).
Figure 11 shows the decadal variability of precipitable water in Northwest China. Comparison of theprecipitation between the 1970s and 1960s shows thatnorthern and western Xinjiang exhibited a moistening trend, whereas southern Xinjiang, Qinghai, southern Gansu, and Ningxia demonstrated a drying trend.This result indicates that the reduction in extremeprecipitation frequency was associated with the drying trend in southern Qinghai and southern Shaanxi.Comparison of the precipitable water between the1980s and 1970s indicates that most areas in Qinghai and Shaanxi-Gansu-Ningxia were wet, whereas Xinjiang was dry, which was consistent with the increasedprecipitation frequency in Qinghai and the ShaanxiGansu-Ningxia area. This finding also explains thedecrease in the K index and the extreme precipitationfrequency increase in southern Qinghai. Comparisonof the precipitable water between the 1990s and 1980sindicates that western and central Xinjiang was becoming wet, whereas eastern Xinjiang was becomingdry . These observ ations can explain the correspondingchanges in extreme precipitation frequency . Finally, Qinghai became wet and central Xinjiang became dryfrom the 1990s to the 2000s, and these changes accounted for the increase in extreme precipitation frequency over Qinghai and the decrease over the centralXinjiang.
 |
| Fig. 11. Decadal changes of precipitable water(mm)from 1963 to 2012. The mean difference between(a)the 1970s and 1960s, (b)the 1980s and 1970s, (c)the 1990s and 1980s, and (d)the 2000s and 1990s. |
In this subsection, the effects of atmospheric dynamics on precipitation in Northwest China were analyzed. The distribution of the divergence difference between 300 and 700 hPa averaged during June-Augustof 2003-2012 was shown in Fig. 12a. High- and lowlevel convergence was enhanced over the past 10 years, resulting in an increase in the divergence difference between high and low levels.In the previous sections, the extreme precipitation frequency noticeably increased in southern Gansufrom 2003 to 2012. To further explain the phenomenonfrom the dynamical perspective, the profiles of vertical velocity were plotted along 105°E over southernGansu with the data of June-August 2003-2012(Fig. 12b). Over 30°-40°N, negative anomalies occurredbelow 350 hPa, whereas positive anomalies occurredabove 350 hPa. At 32.5°N, negative anomalies reachedtheir maximum of more than -9 × 10⁻³ Pa s-1. Strongupward motion in southern Gansu was observed, and this was conducive to extreme precipitation. Therefore, the convergence in the lower troposphere and thedivergence in the upper troposphere were enhancedover the past 10 years and thus led to the strong upward motion anomalies with increased atmosphericinstability and enhanced convection and precipitation.
| |
| Fig. 12.(a)Distribution of the difference in divergence(10-12s-1)between 300 and 700 hPa averaged and (b)profilesof the vertical velocity(10-3 Pa s-1)along 105°E averaged during July-August of 2003-2012. |
The spatiotemporal distribution of the extremeprecipitation frequency in Northwest China and theassociated influencing factors are investigated in thisstudy . The major results are as follows.
The highest summer extreme precipitation frequency and largest interannual difference of extremeprecipitation frequency occurred in the southern partsof Qinghai, Gansu, and Shaanxi provinces in Northwest China. These areas are prone to abrupt changesof extreme precipitation frequency .
Over the past 50 years, the frequency of extremesummer precipitation events exhibited an increasingtrend in Northwest China, accompanied with multitimescale cyclical swings in the extreme precipitationfrequency in local areas. The extreme precipitationfrequency in the entire Northwest China and in eachprovince/region exhibited a mutation during the late1970s and 1990s. In particular, the extreme precipitation frequency during the late 1970s demonstrateda significant increasing trend. Qinghai showed an increasing trend, whereas Gansu and Ningxia presenteda relatively flat trend. The low rainfall days in Xinjiang barely changed, and Shaanxi demonstrated aquasi-10-yr oscillation.
Northwest China can be divided into three subregions(northern, central, and southern)based oncluster analysis of the extreme precipitation frequencytime series. The northern area mainly exhibited a mutation from low to high from the late 1980s to the early1990s. Meanwhile, a low-to-high mutation occurred inthe central region in the beginning of the 1990s. Thesouthern region demonstrated a 10-yr oscillation.
Over the past 50 years, summer stratification stability, water vapor content, and atmospheric dynamical effects have influenced the extreme precipitationfrequency in Northwest China. The increase in localextreme precipitation frequency was associated withenhanced summer instability, increased atmosphericmoisture, and atmospheric upward motion, and viceversa.
Stratification stability and precipitable water significantly affected extreme precipitation frequencyduring summer in western Qinghai and the ShaanxiGansu-Ningxia border region. The effect of water vapor content on summer extreme precipitation frequency was significant in eastern and southern Qinghai. The increased water vapor content correspondedto the increase in extreme precipitation frequency inQinghai Province. The effect of atmospheric upwardmotion on summer extreme precipitation frequencywas noticeable in Qinghai and southern Gansu. Theincreased atmospheric upward motion correspondedwith the increase in extreme precipitation frequencyin Qinghai and southern Gansu.
| [1] | Bell, J. L., L. C. Sloan, and M. A. Snyder, 2004: Regional changes in extreme climatic events: A future climate scenario. J. Climate, 17, 81-87. |
| [2] | Chen Huopo, Sun Jianqi, and Fan Ke, 2012: Decadal features of heavy rainfall events in eastern China. Acta Meteor. Sinica, 26, 289-303. |
| [3] | Chen Zhikun, Zhang Shuyu, Luo Jiali, et al., 2013: A climatic analysis on the precipitation features and anomaly in Northwest China. J. Desert Res., 33, 1874-1883. (in Chinese) |
| [4] | Cheng Qiansheng, Zhou Xiaobo, and Zhu Yingshan, 1998: Cluster analysis of climate jump. Chinese J. Geophy., 41, 308-314. (in Chinese) |
| [5] | —-, —-, and Sun Xichen, 2001: Discontinuous wavelet analysis and mixed cluster analysis. Chinese J. At-mos. Sci., 25, 552-558. (in Chinese) |
| [6] | Cheng Shenglong and Wang Naiang, 2004: Study on air temperature change in Lanzhou City in recent 70 years. Arid Land Geogr., 27, 558-563. (in Chinese) |
| [7] | Fu Congbin, Yan Xiaodong, and Guo Weidong, 2006: Aridification in the northern China and human adaptation. Prog. Natural Sci., 16, 1216-1223. (in Chinese) |
| [8] | Huang Wei, Wu Xian, Chen Jianhui, et al., 2012: Tropo-spheric biennial oscillations and abrupt changes of precipitation in the arid central Asia. Prog. Inquis. Mutat. Climate, 8, 448-455. (in Chinese) |
| [9] | Iwashima, T., and R. Yamamoto, 1993: A statistical analysis of the extreme events: Long-term trend of heavy daily precipitation. J. Meteor. Soc. Japan, 71, 637-640. |
| [10] | Jiang Xiaoyan, Liu Shuhua, Ma Mingmin, et al., 2009: A wavelet analysis of the precipitation time series in Northeast China during the last 100 years. Geogr. Res., 28, 354-362. (in Chinese) |
| [11] | Johanna, H., and S. Jenny, 2002: Climate variations in relation to local scale land use and farmer's percep-tion of climate in Danangou watershed on the Loess Plateau, China. Earth Sciences Centre, Goteborg University, B355. |
| [12] | Milly, P. C. D., R. T. Wetherald, K. A. Dunne, et al., 2002: Increasing risk of great floods in a changing climate. Nature, 415, 514-516. |
| [13] | Min Shen and Qian Yongfu, 2008: Regionality and per-sistence of extreme precipitation events in China. Adv. Water Sci., 19, 763-771. (in Chinese) |
| [14] | Niu Cunwen, Zhang Liping, and Xia Jun, 2004: Wavelet analysis on the precipitation in North China. Arid Land Geogr., 27, 66-70. (in Chinese) |
| [15] | Pal, J. S., F. Giorgi, and X. Q. Bi, 2004: Consistency of recent European summer precipitation trends and extremes with future regional climate projections. Geophy. Res. Lett., 31, L13202. |
| [16] | Shao Xiaomei, Xu Yueqing, and Yan Changrong, 2006: Wavelet analysis of rainfall variation in the Yellow River basin. Acta Sci. Nat. Univ. Pekin., 42, 503-509. (in Chinese) |
| [17] | Shi Yafeng, Shen Yongping, and Hu Ruji, 2002: Pre-liminary study on signal, impact and foreground of climatic shift from warm-dry to warm-humid in Northwest China. J. Glaciol. Geocryol., 24, 219-226. (in Chinese) |
| [18] | Tosnis, A. A., 1996: Widespread increases in low-frequency variability of precipitation over the past century. Nature, 382, 700-702. |
| [19] | Wang Xiaojun, Gong Zhiqiang, Ren Fumin, et al., 2012: Changes in climate system spatial-temporal charac-teristics of regional extreme low temperature events in China during 1960-2009. Adv. Climatic Change Res., 4, 186-194. |
| [20] | Yang Jinhu, Jiang Zhihong, Yang Qiguo, et al., 2007: Analysis on extreme precipitation events over North-west China in flood season. J. Desert Res., 27, 320-325. (in Chinese) |
| [21] | Zhai, P. M., X. B. Zhang, H. Wan, et al., 2005: Trends in total precipitation and frequency of daily pre-cipitation extremes over China. J. Climate, 18, 1096-1108. |
| [22] | Zhang Naisheng and Dai Yuheng, 2012: Characteristics of extreme precipitation events and their circula-tions in Northwest China. J. Anhui Agric. Sci., 40, 14876-14878. (in Chinese) |
| [23] | Zhang Xiakun, Guo Pinwen, Zhang Shuyu, et al., 2012: Variations of extreme precipitation days during the main flood season in southern Gansu Province and its possible causes. Meteor. Mon., 38, 490-494. (in Chinese) |
| [24] | Zou Yongchang, Yang Xiuqun, Liao Yufang, et al., 2009: Seasonal difference of the spatiotemporal variation of the number of extreme precipitation processes in China. J. Nanjing Univ. (Nat. Sci.), 45, 98-109. (in Chinese) |
| [25] | Zwiers, F. W., and V. V. Kharin, 1998: Changes in the extremes of the climate simulated by CCC GCM2 under CO2 doubling. J. Climate, 11, 2200-2222. |