 2014, Vol. 28
The Chinese Meteorological Society
Article Information
- ZHENG Jiafeng, ZHANG Jie, ZHU Keyun, LIU Liping, LIU Yanxia. 2014.
- Gust Front Statistical Characteristics and Automatic Identification Algorithm for CINRAD
- J. Meteor. Res., 28(4): 607-623
- http://dx.doi.org/10.1007/s13351-014-3240-2
Article History
- Received February 13, 2014;
- in final form May 10, 2014


2 State Key Laboratory of Severe Weather, Chinese Academy of Meteorological Sciences, Beijing 100081;
3 College of Atmospheric Sciences, Chengdu University of Information Technology, Chengdu 610225;
4 Air Force Meteorological Center in Chengdu, Chengdu 610041;
5 Fuzhou Meteorological Bureau, Fuzhou 350008
Gust front is a kind of meso- and micro-scale disastrous weather condition that is often caused by mature thunderstorms or squall line systems. Storms cangenerate discontinuous meteorological elements whensinking cold air reaches low levels and converges withenvironmental air. Gust fronts often lead to strongwinds and wind shear when transiting,so they canpose a threat to agriculture and aviation operations.Alarge number of gust front instances have been observed by the extensive network of China's new generation weather radar(CINRAD). So far,mature and reliable automatic identification algorithms for gustfronts have not been developed in China,though theCINRAD data provide plenty of useful information forgust front research and identification.
Byers and Braham(1949)pointed out thatthunderstorms influence the surrounding areas thatgreatly exceed the thunderstorm itself. Fujita(1963)suggested that ev aporative cooling behind the gustfront will cause a pressure rise. Goff(1976)conducted a detailed analysis of the stream structure of storms and gust fronts. Wihelmson and Chen(1982)considered that outflow from thunderstorms can trigger theformation of new convective cells in multi-cell storms.Wilson and Schreiber(1986) pointed out that upliftedflow along a gust front allows maternal storms to remain energetic and forms a new cell. Zrnic and Lee(1982) and Klingle et al.(1987)statistically analyzed Doppler radar echo characteristics of gust fronts.Uyeda and Zrnic(1985)presented a recognition algorithm based on the radial velocity of convergence linesby improving the cyclone recognition algorithm. Hermes et al.(1993)added a vertical continuity checkin the algorithm and developed a wind shear detection algorithm. Delanoy and Troxel(1993)proposed afunction template correlation(FTC)method to identify gust fronts; subsequently,Troxel et al.(1996)designed gust front recognition algorithms for the ASR-9 and TDWR radars. Smalley et al.(2005)borrowedthe algorithm in ASR-9WSP to design a new recognition algorithm for NEXRAD.
In China,Ge(1986) made a comparative analysis between the static and travelling gust fronts using Beijing and Oklahoma's weather radar data, and found that two kinds of gust fronts reflect differentroles of the downdraft and environmental wind. Liu et al.(2007),Bi et al.(2008),Hu et al.(2008),Wu et al.(2009),Liang(2010),Diao et al.(2011),Yuan et al.(2011),Xu et al.(2012),Zhuang and Liu(2012), and Xue and Dong(2013)also drew similar conclusionsby analyzing gust front instances. Li et al.(2006),Zhu and Zhou(2006), and Wang et al.(2007)analyzed the radar echo characteristics of gust fronts and showed that gust fronts exhibit linear and weak echoesin the reflectivity field,corresponding with wind speedconvergence or wind shear area in the velocity field.Zong(2009)identified gust fronts by searching for convergence zones of wind speed. Chen(2009)used theedge-detection technology to estimate the gust frontechoes. Li(2010)referred to the Delanoy's method and achieved narrow-b and identification. Zheng et al.(2013)used the bidirectional gradient method to recognize narrow-b and echoes.
Echo characteristics of gust fronts are the basisof recognition algorithms. In the past,the echo features were obtained from a few site cases that mayhave lacked broader applicability . In this paper,weselect 879 radar volume-scan samples from 21 gustfront weather processes that occurred in China between 2009 and 2012. Detailed reflectivity,velocity, and spectral width field characteristics are tobe investigated,which will then be used to designa narrow-b and echo and a convergence line recognition sub-algorithm. The narrow-b and echo identifi-cation sub-algorithm is an improvement of Smalley'smethod(Smalley et al., 2005), and the convergenceline recognition sub-algorithm uses least-squares fitting combined with other thresholds. Algorithm products and six quantitative indicators that could represent the strength of gust fronts will also be given. Fortesting the algorithm,315 volume-scan samples are tobe used. Three typical instances are analyzed, and thealgorithm strength,weakness, and applicability wellbe discussed.2. Statistics of gust front echo characteristics
Gust front echo characteristics were obtained bycounting radar historical data before designing the algorithm. Radar historical data from 21 gust front processes detected at 19 radar stations(Beijing,Tianjin,Shijiazhuang,Puyang,Shangqiu,Xuzhou,LianY ungang,Zhengzhou,Bengbu,Y ancheng,Zhu Madian,Fuyang,Hefei,Changzhou,Jiujiang,Nanchang,Chengdu,Chongqing, and Guangzhou)in different regions of China from 2009 to 2012 were selected for statistical analysis. This dataset consists of 879 volumescan samples that span the entire life cycle(birth todeath)of the gust fronts, and include detailed characteristics of reflectivity,velocity, and spectral width.2.1 Reflectivity field
Agust front appears as a line or arc echo inthe reflectivity field,which is referred to as narrowb and echo in radar meteorology. The counting elements of a narrow-b and echo include intensity,width,height,length, and the relationship between narrowb and echo and its surroundings.
Proportions within a range of narrow-b and inten-sities are shown in Fig. 1a,which indicates that alarge proportion(93.85%)of intensity values is weak(between 5 and 30 dBZ). The narrow-b and intensityrange of 10-15 dBZ accounts for the highest proportion(26.15%)for the analyzed samples. The narrowb and widths are shown in Fig. 1b,with about 97.10%within the 2-10-km range. The narrow-b and widthof 4 km accounts for the highest proportion(19.80%).Figure 1c shows that gust fronts occur mostly at lowaltitudes, and narrow-b and echoes do not exceed 4 km and most of them(89.33%)are lower than 3 km. During severe thunderstorms,cold flow has a wide range and strong intensity,so the narrow-b and can be longdue to sinking and diverging cold flow(Fig. 1d). Themajority(81.90%)of narrow-b and lengths are between50 and 200 km. In primary moments,the gust frontis close to maternal storms common with a shorternarrow-b and length of 50 km; however,as a gust frontmoves forward,the length may increase. The narrowb and length echoes also have a certain relationshipwith the type of maternal storm. A squall line systemcan have a longer narrow-b and echo and a thunderstorm may have a shorter one.
 |
| Fig. 1. Statistics of narrow-b and (a)intensity,(b)width,(c)maximum height, and (d)length. |
The narrow-b and is closely related to the maternal storm, and it usually appears on the leading edgeof the maternal storm. In the primary stage,a gustfront is near to a storm echo or may be connectedtogether. However,as a storm develops and a gustfront increases in velocity,the interv al between themwill gradually increase. Another key feature of thenarrow-b and echo is that the intensity of a narrowb and is stronger than its surrounding echoes by atleast 5 dBZ, and the latter presents no echo or muchweaker than the former.2.2 Velocity field
Agust front presents a wind shear or a convergence line in the velocity field. A wind shear connectedwith a stronger environment flow(Fig. 2a) and a convergence line corresponding to the weaker environmentflow(Fig. 2b)both can reach a maximum speed gradient on the frontline. Occasionally,we can detect thelinear echo in the velocity field(Fig. 2c).
 |
| Fig. 2. Typical echo characteristics of a gust front in the velocity field. |
Depending on the direction at which a gust frontis moving,we categorize the speed convergence and wind shear as moving away from the radar or moving toward the radar,schematically represented in Fig. 3. Figures 3a and 3c represent the conditions of windshear,where the radial velocity decreases from a largerpositive speed to a smaller positive speed near theradar side, and decreases from a smaller negative speedto a larger negative speed away from the radar side.Figures 3b and 3d show speed convergences,where thefeatures of the radial velocities are changing similarlyto the wind shear. Therefore,the speed on both sides of a gust frontline will convert from larger positive speed(smaller negative speed)to smaller positivespeed(larger negative speed),namely,the speeds arecontinuously decreased when the distance increases.When the angle between the frontline and the radarradial line is small,the wind shear is characteristicof an azimuthal shear. In addition,wind speeds stilldecrease from one side to the other.
 |
| Fig. 3. Schematic of speed change near the gust front. |
As shown in Fig. 4,the spectral width value ofthe gust front is large. About 87.09% exceed 4 m s-1, and are mostly between 4 and 12 m s-1,with 4-8 and 8-12 m s-1 accounting for 38.36% and 36.89%,respectively .
 |
| Fig. 4. Statistics of spectral width of gust fronts. |
The purpose of a gust front recognition algorithm is to identify the gust front by using radar data,namely using radar data as input and producing gustfront identification products and related indicators asoutput. The algorithm processing framework shownin Fig. 5 illustrates that the algorithm will preprocess the radar base data, and then is devided respectively into the narrow-b and echo and the convergenceline identification sub-algorithms. Finally,the gustfront identification products and quantitative indexes are generated as output.
 |
| Fig. 5. Framework of gust front recognition algorithm. |
Data preprocessing involves quality control ofradar base data,including noise filtering,missing data filling, and data smoothing. Isolated points,singularity, and radial strip noises may be caused by birds,aircraft, and radio interference. Missing data arethe lacking measurement points,pieces, and radials.Noises and missing data will influence the subsequentalgorithm to a certain extent. Liang et al.(2002)usedthe "K-area- and -frequency" method to filter noises and fill missing data in the velocity field before correcting the velocity ambiguity . In this paper,the parameters of this method are tested to select the optimal parameter configuration. They are then appliedto our radar data treatment in reflectivity and velocity fields. The principle of K-area- and -frequency is asfollows:
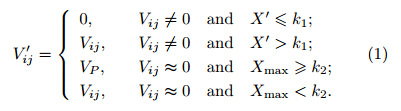
1)Select an M × N small sliding window,then divide the data value range into P equal interv als. Theinterv al distance is Δd, and the centre value of thewindow is Vij,so make Vij ± Δd/2 as the P +1 interval.2)Counting points distributed in different frequency ranges(X1; X2; : : : ; XP) and X' in the M × Nwindow. Assume that Xmax is the maximum amongX1; X2; : : : ; XP, and X',then select the median of theinterv al corresponding to Xmax as VP.3)Make V'ij as the new value for window center,meanwhile eliminate noise and fill lacking measurements through Eq.(1). Let k1 represent the thresholdof eliminating noise,k2 represent the threshold of filling lacking measurements, and zero represents no echo.
The physical meaning of Eq.(1)can be interpreted asfollows: when the original value of the window centerVij is not zero,namely,it is an effective echo point,if X'is less than or equal to k1,it is suggested thatsimilar echo points rarely exist around the center,soit is a singular point and should be deleted; when X'is greater than k1,this indicates that there are a su±-cient number of similar echo points around the center,so this point is a normal point in continuous areas and should be reserved. The window midpoint Vij is an effective point when it is equal to zero,so we should consider whether it is a lacking measurement point and should be filled or not. When Xmax is greater thank2,it suggests that this point's frequency is large in acertain interv al and there are enough e±cient pointsaround it,so it should be filled by giving the midpointof the corresponding interv al; when Xmax is less thank2,it indicates that there is no echo or less echoes inside the window and that e±cient points seldom existaround it,therefore this point is invalid and does notneed to be filled.
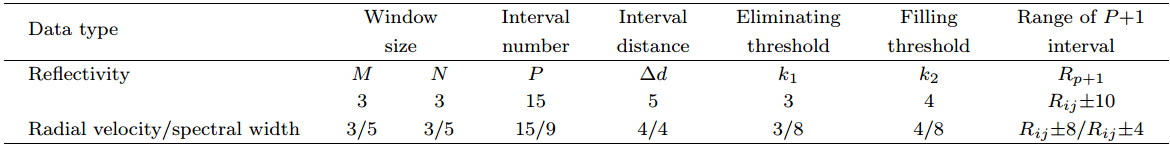
"K-area- and -frequency" uses the correlation ofthe same ob ject's echo with a clear physical meaning,but the selection of parameters M,N,P,Rp+1,k1, and k2 will have a greater impact on the result.Thus,it is necessary to have multiple sets of tests forparameters to compare the influences of different parameter configurations. For the S-b and CINRAD,thereflectivity gate length is 1000 m and the velocity and spectral width gate length is 250 m. Table 1 gives theoptimal parameters.
After "K-area- and -frequency" treating,a fivepoint moving average is utilized to smooth the radialvelocity data,which could be beneficial to slow downthe data fluctuation for identifying convergence lines.3.3 Narrow-b and identific ation
Smalley et al.(2005)realized the extraction oflinear echo by using a method of combining matrixtemplate with scoring function,which has been usedas one of the core algorithms of gust front recogni-tion in NEXRAD. However,his matching template isnot designed for the features of gust fronts observedin China, and there are some shortages that still exist in his scoring function. Here,a new narrow-b and matching template is designed based on the characteristics of the gust fronts that we analyzed above, and the corresponding scoring function for the matchingtemplate is also redesigned. The steps of narrow-b and identification are described in detail as follows:
1)Coordinate transformation: T ransforming theradar basic data from polar coordinate to Cartesiancoordinate.
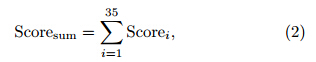
2)Construction of narrow-b and matching template: The template is a matrix operator shown inFig. 6. According to the statistical characteristics inreflectivity field of a gust front,the template width and length are set to 9 and 17 km,respectively . Thetemplate consists of 35 points that include 17 red onesrepresenting the points on the narrow-b and echo and 18 green ones representing the points on the two sides.The black point is the center of the template. We obtain the reflectivity value of these 35 points from thematching template.
3)Scoring function: The redesigned scoring function for the matching template is shown in Fig. 7a.The red line is for a narrow-b and echo. The scoregradually increases from 1 to 6 as the reflectivity valueis enhanced for narrow-b and s(5-35 dBZ),while thescore is -6 when the reflectivity value is not a point ofnarrow-b and (< 5 dBZ or > 35 dBZ). The green linerepresents the scoring function of two sides echo,thescore gradually decreases from 6 to 1 as the reflectivityvalue is increased(5-30 dBZ), and the score is -6 inthe other interv als. The matching template should becombined with the scoring function so that the reflectivity value of the narrow-b and echo is 5 dBZ higherthan its surrounding echo; this can help to detect thenarrow-b and echo whose reflectivity value is high inthe middle and low on both sides. According to thereflectivity values of the 35 points in the template,wecan obtain the Scorei(i = 1,2,: : :,35)through thescoring function,then add all of them to calculate theScoresum,as shown in Eq.(2). Figure 7b shows thescoring function presented by Smalley et al.(2005).Comparing Figs. 7a with 7b indicates that when using the redesigned scoring function,Scorei must begreater than(or equal to)7 and Scoresum must beat least 120 when the matching template is on thenarrow-b and echo whether its reflectivity is weak orstrong; therefore,a stable threshold could be set easily to distinguish the narrow-b and echo. However,theSmalley's scoring function does not have this adv antage; it has a large variation as the narrow-b and has adifferent reflectivity . The narrow-b and could be extr acted only when the reflectivity value is between 5 and 15 dBZ,but unfortunately the actual observ ations already reveal that the narrow-b and echo is likely toappear between 5 and 30 dBZ. Hence,the universality and stability of the redesigned scoring function isgreater than Smalley's.
 |
| Fig. 7. Scoring functions for matching template of narrow-b and .(a)The resigned scoring function presented in this paper and (b)the scoring function presented by Smalley et al.(2005). |
4)T emplate rotating and the maximum score calculation: In reality,the direction of the narrow b and could not be prescient,so the matching template mustbe rotated to adapt to different angles. As shown inFig. 8,A' is the rotated point of A at a rotationangle,β = 15°,whereby 12 different templates aregenerated with different angles. The coordinate afterrotating could be calculated from Eqs.(3) and (4).By this means,12 Scoresumcan be obtained,namely,Scoresum i(i = 1,2,: : :,12) and their maximum willbe taken as the final Max_Scoresum .

 |
| Fig. 8. Template rotation schematic. |
5)Score threshold judgment: Max_Scoresum satisfies the narrow-b and echo,when Max_Scoresum islarger it conforms to the features of the narrowb and echo. Therefore,a score threshold called "Score_threshold" is set to judge the Max_Scoresum .When Max_Scoresum is greater than Score_threshold,it represents a point of narrow-b and echo.
6)Edge threshold judgment: After score threshold judgment,a wide range of precipitation and scattered echo can be filtered and the linear echo will remain. However,another linear echo may remain,thedifference between this echo and the narrow-b and echois: in the reflectivity field,narrow-b and echo is high inthe middle and low on two sides,but this non-narrowb and linear echo presents as one side has no echo but the other side and the middle have well-distributedweak echoes. The latter must be removed because it can also generate a high Max_Scoresum . For thispurpose,a technology is taken as follows: whencalculating the Max_Scoresum,the template angleis recorded and "Score_left" and "Score_right" arethen calculated for the columns on either side of thenarrow-b and (as shown in Fig. 6,18-26 on the left, and 27-35 on the right); setting a variable called"Edge_threshold" when |Score_left-Score_right| isgreater than Edge_threshold; if it is demonstratedthat this is not a narrow-b and echo,it is deleted.Edge_threshold reflects the different scores on bothsides of the matching template.
 |
| Fig. 6. Narrow-b and echo matching template. |
7)Altitude judgment: Gust front is produced atthe low level and earlier statistics show that the altitude does not exceed 4 km. Hence,use Eq.(5)tojudge the echo altitude and filter the residual clutterwhose height is greater than 4 km.
where h represents the radar site height,R is echo distance, and δ is radar elev ation.
8)Coordinate transformation: T ransforming thecoordinate from Cartesian back to Polar.
After the eight steps above,the narrow-b and echocan be identified. An instance shown in Fig. 9 was detected by Fuyang radar at 1307 BT(Beijing Time)5 June 2009. A comparison of Figs. 9a and 9b showsthat the reflectivity field becomes smooth after datapretreatment,the noises and scattered points havebeen filtered, and the lacking radial data have beenfilled. Furthermore,after template matching and function scoring,a wide range of precipitation and clutterecho are filtered out. Subsequently,the pseudo linearecho and clutter are mostly eliminated after edge and altitude judging,a finally effect is shown in Fig. 9d.
 |
| Fig. 9. Narrow-b and echo recognition effect of Fuyang radar at 1307 BT 5 June 2009 with a display distance of 300 km.(a)Original reflectivity,(b)image after preprocessing and coordinate transformation,(c)image after template matching and score grading(Score_threshold = 120), and (d)narrow-b and echo after edge and height judgment(Edge_threshold= 30). |
The statistics of gust front velocity echo characteristics show that gust fronts present a convergenceline or wind shear in the velocity field. Radially outward,the speeds gradually decrease with the distance.Therefore,the least-square method can be used to fitthis feature. The detailed steps for the convergenceline identification are described as follows.
Set the linear regression equation as below:
where a and b are the speed constant and speed slope,r is the distance, and v* is the estimated speed.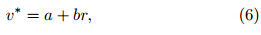
Then,the error between the estimated and measured value is:
where vi is the measured speed.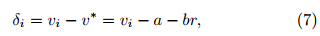
According to the principle of least squares,thevalue of the following equation must be minimized tohave the lowest error sum of squares(D):
Then,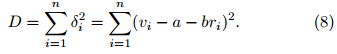

The solution is
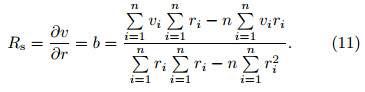
Equation(11)is used to compute the radial shear(Rs). The available azimuthal shear(As)is computedas follows:
where θ is the azimuth.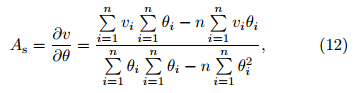
Synthesizing radial shear and azimuthal shear collectively are referred to as combined shear(Cs):

Further judgment is needed for the least-squaresfitting for radial shear and combined shear. Seta variable called "Radial_shear",as the speeds decrease continually when they pass through the gustfront,so Radial_shear must be less than zero.As for combination shear,set a threshold called"Combination_shear",it must be large enough as gustfronts can cause strong wind shear. At last,some scattered points in the result will be filtered by using asliding window.
Figure 10 is the result of convergence line identification at 1249 BT 5 June 2009. A comparison oforiginal velocities(Fig. 10a) and the velocity after preprocessing(Fig. 10b)shows that noise and data gapsare both effectively treated by preprocessing,resultingin a smooth velocity image with more compact edges.Figure 10c is the result after least-squares fitting and thresholds judging,the convergence line is completelyextracted. After filtering scattered points,the finalconvergence line is shown in Fig. 10d.
 |
| Fig. 10. Convergence line identification effect of Fuyang radar at 1249 BT 5 June 2009 with a display distance of 150km.(a)Original velocity,(b)image after preprocessing,(c)image after least-squares fitting and threshold judging, and (d)convergence line image after scatter filtering. |
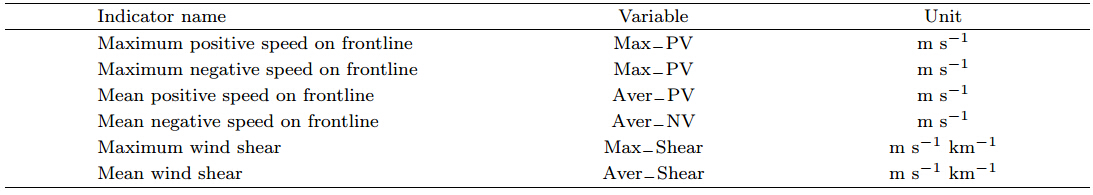
The strength of a gust front is described by sixquantitative indicators(Zheng et al., 2013),as shownin Table 2. The six indicators are output after theconvergence line identification is completed. They re-flect the strength of the gust front directly, and can be used in the prediction of strong wind and wind shear.
Several quality problems of CINRAD data will cause adverse effects to the algorithm. Examples are:the radar only detects one of the narrow-b and or convergence line echoes,the narrow-b and echo is too closeto the radar station,there is a seriously lacking of velocity data or there exists interferential strip echo inreflectivity field. Therefore,the gust front identification algorithm must be optimized to yield as muchinformation as possible. In this paper,our algorithmgenerates three output products: narrow-b and echoproduct,convergence line product, and final frontline product. Narrow-b and echo and convergence lineproducts result from sub-algorithms,while the finalfrontline product is obtained according to the spaceconsistency of narrow-b and echo and convergence line, and will synthetically locate the frontline. The specificapproaches are as follows.
If one point is both the narrow-b and echo and convergence line,this point will be defined as "Gustfront;" if it is only on the narrow-b and ,it will be de-fined as "Suspicious area of narrow-b and ," similarly,ifit is only on the convergence line,it will be defined as"Wind shear zone." In the "Final frontline product,"the "Gust front," "Suspicious area of narrow-b and " and "Wind shear zone" will be noted in different colorcodes. The "Gust front" results from radar detectionof both narrow-b and echo and convergence line,whichis highly indicative of a gust front. The "Suspiciousarea of narrow-b and " just suggests that the radar hasonly detected narrow-b and echo, and two situationsare possible. First,a similar linear weak echo may exist but not a gust front on the reflectivity field. Second,the echo is a gust front,but the quality of the velocityfield data is so poor that the radar fails to identify theconvergence line. The "Wind shear zone" representsa risky area with strong wind shear. For "Suspiciousarea of narrow-b and " and "Wind shear zone," if theyconnect the "Gust front" into a line,then they are alsopart of the gust front.
In the example shown in Fig. 11,the algorithmidentifies the narrow-b and echo and convergence line.In the final frontline product,the whole frontline hasbeen recognized; furthermore,in addition to the redline as a gust front,both sides are linked together withthe green line and the yellow line as parts of the gustfront.
 |
| Fig. 11. Gust front recognition products of Shangqiu radar at 1433 BT 3 June 2009 with a display distance of 300 km.(a)Original reflectivity,(b)narrow-b and echo product,(c)original velocity,(d)convergence line product, and (e)finalfrontline product. |
Gust front samples were collected to test the algorithm's effect. Samples were selected from different gust front processes(i.e.,having varied strength,moment, and area)to include samples from 3 strong,6 moderately strong, and 5 weak gust fronts. In total,315 samples were analyzed within the entire gustfront life cycle(i.e.,birth to death). The algorithm isconsidered successful when one of the three productsis identified. T esting results show that the algorithmwas stable and highly successful,with 277 samples successfully identified(87.94%),as summarized in Table 3. Only 3 samples were not successfully identified on6 July 2010 in Shijiazhuang(Tables 3 and 4). Failurecases in Shijiazhuang are the result of a limitation ofthe algorithm,whereas the other failures are causedpossibly by the quality problems of CINRAD data.Therefore,the quality of radar data greatly influencesthe success of the algorithm.

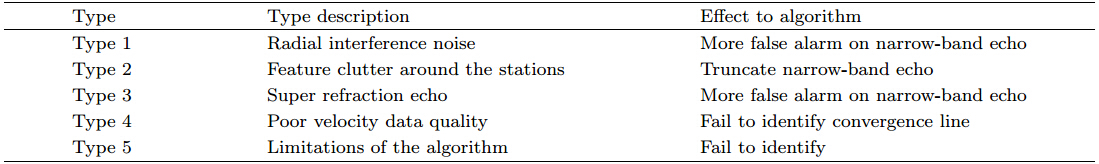
Figure 11 indicates that the algorithm is effective for detecting strong gust fronts. Three typicalinstances(i.e.,one medium and two weak gust fronts)are used to analyze the algorithm's effect(shown inFigs. 12,13, and 14). Figure 12 shows a gustfront(generated by a squall line system)detected byZhengzhou radar at 1226 BT 3 June 2009; the algorithm can identify the narrow-b and echo,the convergence line, and the frontline. Figure 13 shows that thegust front(also generated by a squall line system)isdetected by Shijiazhuang radar at 1335 BT 26 July2011. Figure 13 indicates that there is an imperceptible gust front southeast of the squall line system,thealgorithm can identify the weak narrow-b and echo and convergence line successfully, and the discriminatingfrontline is very clear. Figure 14 shows a gust front(generated by a storm cell)detected by Changzhouradar at 0718 BT 30 July 2011. It demonstrates thatthere is a downburst at about 60 km northwest of theradar station and a small-scale gust front about 30km east of the radar station. In this case,the algorithm nearly identifies the gust front but requires someinterpretation by an experienced forecaster. Thesethree cases reveal that the algorithm is effective for identifying strong gust fronts, and weak and smallscale gust fronts.
 |
| Fig. 12. As in Fig. 11,but for Zhengzhou radar at 1226 BT 3 June 2009.(a)Reflectivity,(b)narrow-b and echoproduct,(c)velocity,(d)convergence line product, and (e)frontline product. |
 |
| Fig. 13. As in Fig. 11,but for Shijiazhuang radar at 1335 BT 26 July 2011. |
 |
| Fig. 14. As in Fig. 11,but for Changzhou radar at 0718 BT 30 July 2011. |
The gust front automatic identification algorithmpresented in this paper has several virtues: 1)the gustfront statistical characteristics are collected from different regions of China,which ensures the universalityof the algorithm; 2)the algorithm is divided into twosub-algorithms for identifying the narrow-b and echo and convergence line,so it is more complete than theformer methods; 3)the algorithm is also effective forweak or small-scale gust fronts; and 4)the algorithmcan output three products,including detailed recognition information. Therefore,the users have a higherprobability of making the correct judgment by usingthe algorithm products.
The algorithm also has some limitations: 1)whenthe radar data have quality problems,the algorithmmay produce false alarm narrow-b and echo. 2)Thealgorithm can only produce six simple quantitative indicators of gust fronts; some technologies still need tobe researched in the next step,such as the gust frontmoving direction,moving speed, and possible affectedarea.
The algorithm is designed for S-b and weatherradar. For radars of other b and s,the corresponding parameters should be adjusted. The optimal values of parameters used in the algorithm are shown inTable 5.

This paper presents an automatic gust front identification algorithm. As the basics,879 radar volumescans selected from 21 gust front weather processesthat occurred in different regions of China between2009 and 2012 were counted and the gust front statistical characteristics in the reflectivity,velocity, and spectral width fields were obtained. Then,basedon these statistical characteristics,narrow-b and echo and convergence line recognition sub-algorithms weredesigned with identification products and six quantitative indicators as outputs. Finally,315 samples wereused to test the algorithm's effect and three typicalrecognition instances were utilized to demonstrate theeffect. In the end,the virtues and limitations of thedesigned algorithm were summarized and the applicability and optimal parameters of the algorithm weregiven.
The following condusions are derived.(1)Thegust front reflectivity statistics show that the narrowb and echo intensity is between 5 and 30 dBZ,thewidth is between 2 and 10 km,maximum height isless than 4 km with 89.33% lower than 3 km, and lengths are between 50 and 200 km. The narrow-b and and maternal storm echoes are separated by a considerable distance, and the narrow-b and echo intensity ishigher than its surrounding echo.(2)Gust fronts inthe velocity field present a convergence line or a windshear that is expressed radially outward,the speedsgradually decrease with distance. The spectral widthof a gust front is high,exceeding 4 m s-1 for 87.09%of the samples.(3)The gust front identification algorithm is highly stable and successful for the 315gust front volume-scan samples that were tested,with277 samples being successfully recognized regardless ofwhether the gust front is weak or small scale.(4)Only3 out of 38 unsuccessfully identified samples were dueto limitations of the algorithm itself,while the otherswere caused by poor radar data quality . Therefore,the quality of radar data greatly influences the successof the algorithm.
Acknowledgments: We thank senior engineerGao Xiqiao and weather forecaster Zhang T ao for theirsignificant help.
| [1] | Bi Xu, Liu Huimin, and Zhao Yufei, 2008: Series of Shanxi gust front weather processes analysis. Journal of Shanxi Meteorology, 2, 23-26. (in Chinese) |
| [2] | Byers, H. R., and R. R. Braham, Jr., 1949: The Thunderstorm. U.S. Govt. Printing Office, Washington DC, 287 pp. |
| [3] | Chen Gang, 2009: Detection and identification of gust front. Master dissertation, Dept. of Computer Application, Xi’an Electronic and Engineering University, Xi’an, 53 pp. (in Chinese) |
| [4] | Delanoy, R. L., and S. W. Troxel, 1993: The Machine Intelligent Gust Front Algorithm. MIT Lincoln Laboratory Project Report, ATC, 1-196. |
| [5] | Diao Xiuguang, Zhu Junjian, and Liu Zhihong, 2011: Analysis of three supercell storms with Doppler weather radar data. Acta Meteor. Sinica, 25, 211-223. |
| [6] | Fujita, T. T., 1963: Analytical mesometeorology: A review. Meteor. Monogr., 27, 77-125. |
| [7] | Ge Runsheng, 1986: Gust front observation and study by radar. Chinese Academy of Meteorological Sciences Annual Report, 1, 113-122. (in Chinese) |
| [8] | Goff, R. C., 1976: Vertical structure of thunderstorm outflows. Mon. Wea. Rev., 104, 1429-1439. |
| [9] | Hermes, L. G., A., Witt, S. D. Smith, et al., 1993: The gust front detection and wind-shift algorithms for the terminal Doppler Weather Radar System. J. Atmos. Oceanic Technol., 10, 693-709. |
| [10] | Hu Wendong, Tao Linke, Yang Kan, et al., 2008: Anal-ysis on a gust front event in arid area of Northwest China. J. Desert Res., 28, 349-356. (in Chinese) |
| [11] | Klingle, D. L., D. R. Smith, and M. M. Wolfson, 1987: Gust front characteristics as detected by Doppler radar. Mon. Wea. Rev., 115, 905-918. |
| [12] | Li Guocui, Guo Weihong, and Wang Lirong, 2006: Ap-plication of gust front to damage wind forecasting. Meteor. Mon., 32, 36-41. (in Chinese) |
| [13] | Li Jin, 2010: Gust front automatic identification algorithm research by using Doppler radar. Master dissertation. Dept. of Atmospheric Remote Sensing Science and Technology, Nanjing University of Information Science & Technology, Nanjing, 57 pp. (in Chinese) |
| [14] | Liang Haihe, Zhang Peiyuan, and Ge Runsheng, 2002: Study of data processing of wind fields from Doppler radar. J. Appl. Meteor. Sci., 13, 591-601. (in Chinese) |
| [15] | Liang Xudong, 2010: Improvement of the integrating velocity-azimuth process single-Doppler radar windretrieval method. Acta Meteor. Sinica, 24, 721-731. Liu Yong, Wang Nan, and Liu Liping, 2007: Analysis of two gust fronts using Doppler radar and automatic meteorological station data. Plateau Meteor., 26, 380-387. (in Chinese) |
| [16] | Smalley David, J., B. J. Bennett, and R. Frankel, 2005: MIGFA—The machine intelligent gust front algorithm for NEXRAD. The 32nd Conference on Radar Meteorology, 27, October, Amer. Meteor. Soc., 354-362. |
| [17] | Troxel, S. W., R. L. Delanoy, J. P. Morgan, et al., 1996: Machine intelligent gust front algorithm for the terminal Doppler weather radar (TDWR) and integrated terminal weather system (ITWS). Amer. Sci., 13, 70-79. |
| [18] | Uyeda, H., and D. S. Zrnic, 1985: Automatic detection of gust front. J. Atmos. Oceanic Technol., 3, 36-50. |
| [19] | Wang Zhenguo, Zhuo Hong, Li Chunhu, et al., 2007: Analysis of a gust front 3-D structure by using Doppler radar data. Arid Meteorology, 25, 48-52. (in Chinese) |
| [20] | Wihelmson, R. B., and C. S. Chen, 1982: A simulation of the development of successive cells along a cold outflow boundary. J. Atmos. Sci., 39, 1466-1483. Wilson, J. W., and W. E. Schreiber, 1986: Initiation of convective storms at radar-observed boundary layer convergence lines. Mon. Wea. Rev., 114, 2516-2536. |
| [21] | Wu Fangfang, Wang Hui, Wei Yingying, et al., 2009: Analysis of a strong gust front and downburst with Doppler weather radar data. Meteor. Mon., 35, 55-64. (in Chinese) |
| [22] | Xu Daosheng, Shao Aimei, and Qiu Chongjian, 2012: Doppler radar data assimilation with a local svd en3Dvar method. Acta Meteor. Sinica, 26, 717-734. |
| [23] | Xue Ming and Dong Jili, 2013: Assimilating best track minimum sea level pressure data together with Doppler radar data using an ensemble Kalman filter for Hurricane Ike (2008) at a cloud-resolving resolution. Acta Meteor. Sinica, 27, 379-399. |
| [24] | Yuan Zipeng, Wang Ying, Cui Shengquan, et al., 2011: Analysis on the characteristics of a midlatitude squall line. Meteor. Mon., 37, 814-820. (in Chinese) |
| [25] | Zheng Jiafeng, Zhang Jie, Zhu Keyun, et al., 2013: Automatic identification and alert of gust fronts. J. Appl. Meteor. Sci., 24, 117-125. (in Chinese) |
| [26] | Zhu Minhua and Zhou Honggen, 2006: Application of Doppler weather radar in gust front monitoring. Scientia Meteor. Sinica, 26, 97-102. (in Chinese) |
| [27] | Zhuang Wei and Liu Liping, 2012: A reflectivity climatology algorithm for hybrid scans and its application to radar coverage over the Tibetan Plateau. Acta Meteor. Sinica, 26, 746-757. |
| [28] | Zong Rong, 2009: Study of gust front identification by using Doppler weather radar. Master dissertation. Dept. of Atmospheric Remote Sensing Science and Technology, Nanjing University of Information Science & Technology, Nanjing, 53 pp. (in Chinese) |
| [29] | Zrnic, D. S., and J. T. Lee, 1982: Pulsed Doppler radar detects weather hazards to aviation. J. Aircraft, 19, 183-190. |