 2014, Vol. 28
The Chinese Meteorological Society
Article Information
- WU Ying, WENG Fuzhong. 2014.
- Applications of an AMSR-E RFI Detection and Correction Algorithm in 1-DVAR over Land
- J. Meteor. Res., 28(4): 645-655
- http://dx.doi.org/10.1007/s13351-014-3075-x
Article History
- Received November 12, 2013;
- in final form May 5, 2014


2 School of Atmospheric Physics, Nanjing University of Information Science & Technology, Nanjing 210044, China;
3 NOAA/NESDIS/Center for Satellite Application and Research, College Park, MD 20742, USA
Early examinations of passive microwave bright-ness temperature measurements showed evidence ofextensive Radio-Frequency Interference(RFI)signalsat low microwave frequencies(Li et al., 2004; Njoku et al., 2005; Kidd,2006). A number of passive microwavesensors,such as the Advanced Microwave ScanningRadiometer(AMSR-E)aboard the Earth ObservingSystem(EOS)Aqua platform and the WindSat Ra-diometer on the U.S. Department of Defense Coriolissatellite,have demonstrated increasing RFI impactson satellite measurements in C- and X-b and chan-nels and on geophysical parameter retrievals(Li et al., 2004,2006; Njoku et al., 2005; Ellingson and John-son, 2006; Kidd,2006; Wu and Weng, 2011). Zouet al.(2012)detected RFI signals over l and fromthe FY-3B Microwave Radiation Imager(MWRI),which is similar to AMSR-E but without channelsat 6.9 GHz. The successor to AMSR-E,AMSRE-2 aboard the Japanese Shizuku mission(originallyGCOM-W1(Global Change Observation Mission 1st-Water))(Kachi et al., 2008)launched on 18 May 2012(JAXA,2012),is similar to AMSR-E,but is enhanced for RFI detection with the addition of channels at7.3 GHz.
Impacts of RFI on L-b and satellite data havealso been experienced by the Microwave Imaging Ra-diometer with Aperture Synthesis(MIRAS)aboardthe ESA/SMOS(European Space Agency/Soil Mois-ture and Ocean Salinity)mission(Camps et al., 2010;Hallikainen et al., 2010; Skou et al., 2010; Anterrieu,2011; Castro et al., 2012; Mecklenburg et al., 2012;Misra and Ruf, 2012; Oliva et al., 2012) and NASA'sAQUARIUS(Le et al., 2007; Misra and Ruf, 2008)mission,launched in June 2011.
In order to properly identify and reject RFI con-tamination,both hardware and software RFI detection and mitigation schemes(Gasiewski et al., 2002; Njoku et al., 2005; Johnson et al., 2006; Li et al., 2006; Ruf et al., 2006; Piepmeier et al., 2008; Wu and Weng, 2011; Lacava et al., 2013)have already been investi-gated over l and . Njoku et al.(2005)examined thespatial and temporal characteristics of the RFI in the6.9- and 10.7-GHz AMSR-E channels over the globall and domain for a 1-yr observation period using spec-tral indices. Li et al.(2006)developed PCA-based(principal component analysis)l and RFI algorithmsto detect C-(6.9 GHz) and X-b and (10.7 GHz)l and RFIs of WindSat measurements through extending thespectral difference technique by using PCA of RFIindices. This method integrated statistics of targetemission/scattering characteristics(through RFI in-dices) and multivariate correlation of radiometer datainto a single statistical framework of PCA. Lacava etal.(2013)proposed the multi-temporal robust satel-lite techniques that can be implemented on C-b and AMSR-E data to identify areas systematically affectedby different levels of RFI.
In this paper,the RFI characteristics of C- and X-b and data of AMSR-E,including the magnitude,extent, and location,are further investigated by usingan RFI detection and correction algorithm proposedby Wu and Weng(2011). Emphasis is given to the ap-plications of the algorithm in geophysical parameterretrievals over l and using the one-dimensional vari-ational retrieval(1-DVAR)approach. The retrievalconvergence metric(or goodness of fit)between bright-ness temperature(TB)model simulations and satel-lite measurements is utilized to identify possible RFI-contaminated regions. Section 2 provides a descriptionof AMSR-E missions and the RFI detection and cor-rection algorithm. Section 3 describes the 1-DVARapproach,as well as the metric for identifying conver-gence. Numerical results are presented in Section 4.Section 5 provides a summary and some conclusions.2. AMSR-E description2.1 Mission overview
AMSR-E,launched on 4 May 2002,is a 12-channel,dual-polarization conically scanning passivemicrowave radiometer with 6 frequencies ranging from6.9 to 89.0 GHz,which detects faint microwave emis-sions from the earth's surface and atmosphere.
Various geophysical parameters can be retrievedfrom AMSR-E measurements,including water vapor,cloud liquid water,precipitation,sea surface temper-ature,sea surface wind speed,sea ice concentration,snow water equivalent, and soil moisture. Its global and continuous long-term geophysical record with finespatial resolution plays an important role in climatechange monitoring and provides valuable informationfor underst and ing the earth's climate system,includ-ing water and energy circulation. Near real-time prod-ucts will be used to investigate satellite data assimila-tion into weather forecasting models and to contributeto improvement of forecasting accuracy.2.2 AMSR-E RFI detection and correction al-gorithm
It is well known that AMSR-E measurements at6.9 and 10.7 GHz over l and are seriously contaminatedby variable surface radio frequency transmitters. Inorder to properly identify and reject increasing RFIcontamination,Wu and Weng(2011)proposed an RFIidentification and correction algorithm for AMSR-Echannels. The algorithm is based on mean emissivityspectral characteristics over various l and types thatare simulated by using a microwave l and emissivitymodel(Weng et al., 2001). An RFI index can be usedto detect RFI over l and . The larger the RFI index is,the stronger the RFI contamination is. In this al-gorithm,the AMSR-E measurements over l and withan RFI index greater than 5 K are defined as RFI-contaminated.
In the RFI correction,two empirically-basedequations are derived based on AMSR-E trainingdata under non-RFI contaminations,exploiting thefact that measurements at 18.7 GHz are rarely con-taminated,i.e.,a relationship is established betweenAMSR-E measurements at 10.7 GHz and those at18.7 or 6.9 GHz. If an RFI is detected at 10.7 GHzinstead of 6.9 GHz,the RFI-contaminated AMSR-Emeasurements at 10.7 GHz are predicted from mea-surements at 18.7 or 6.9 GHz by using this relation-ship between two neighborhood frequencies. Also,ifan RFI is detected at 6.9 GHz instead of 10.7 GHz,the RFI-contaminated measurements at 6.9 GHz canbe predicted from measurements at 10.7 GHz. Again,when RFI contaminations are detected at both 6.9 and 10.7 GHz,RFI-contaminated measurements at thesetwo frequencies can still be predicted from measure-ments at 18.7 GHz.
Moreover,it is found that AMSR-E measure-ments have better agreement with simulations in avariety of surface conditions after the RFI-correctionalgorithm(Wu and Weng, 2011). As a result,onecould expect to use more RFI-contaminated AMSR-E measurements for satellite data retrieval with RFImitigation.3. 1-DVAR approach
The 1-DVAR algorithm used in this paper is acomponent of the MIRS(Microwave Integrated Re-trieval System)(Boukabara et al., 2011),which usesthe Community Radiative Transfer Model(CRTM)(Han et al., 2006; Ding et al., 2011)as the forward and adjoint operators. The 1-DVAR inversion schemesolves the surface and atmospheric parameters simul-taneously,e.g.,surface emissivities,temperature,pro-files of atmospheric temperature,moisture and rain-fall. Besides these primary parameters,other productsare derived either by performing simple vertical inte-gration,such as the total precipitable water(TPW),orby performing a more elaborate post-processing,suchas the surface rainfall rate(RR)based on the hydrom-eteor parameters(Boukabara et al., 2011).
The variational approach employed in the inver-sion scheme seeks to minimize the following cost func-tion,J(X)(Eyre et al., 1993; Boukabara et al., 2011),which measures the fit of the model to the radiances.Assuming Gaussian errors,this cost function can bewritten as
where xb is the background state vector; B,which isassociated with the back ground state variable xb,isthe error covariance matrix of X; E is the error co-variance matrix of observations and /or forward mod-els; xb is the measurement. Specifically,assumingthat we have a forward operator Y that can simu-late radiances similar to the measurements withoutbias,the errors in the satellite observations and pri-ori information are unbiased,uncorrelated, and haveGaussian distributions, and the best estimate of theatmospheric state X minimizes the cost function. Theminimization of this cost function is also the basis forvariational analysis retrieval(Boukabara et al., 2011).Minimization of the cost function is obtained by usingan iterative process that computes the descent direc-tion at state X by solvingThe Jacobian matrix K corresponds to the partialderivatives of the radiative transfer with respect toX.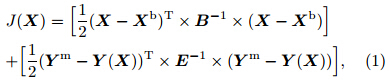

The forward operator is based on the CRTM de-veloped by the Joint Center for Satellite Data Assim-ilation(JCSDA)in this study. The CRTM producesthe simulated radiances as well as the Jacobian matrixK. The parameter x2 is calculated as
where x2 is used as a metric for deciding if convergencehas been reached; x2 is also a measure of the goodnessof fit of the forward model. Only those channels se-lected and effectively utilized in the 1-DVAR are usedto compute this metric.4. Results and discussion4.1 RFI identification and correction
By identifying contaminated AMSR-E TB,af-fected channels can be ignored to produce retrievalsunaffected by RFI. However,the utilization of fewerchannels in the retrieval process may increase noise and decrease accuracy since various retrieved param-eters are related to the effect of the frequency depen-dence. As a result,the spectral difference method(Wu and Weng, 2011)is used to detect RFI signals overl and in this study. In the RFI correction,a relation-ship between AMSR-E measurements at 10.65 GHz and those at 18.7 or 6.925 GHz is used to predict RFI-contaminated TBs over l and (Wu and Weng, 2011).
The convergence metric(x2)used in the 1-DVARapproach could also be an excellent filter for detect-ing microwave data contaminated by RFI over l and .Adams et al.(2010)described the geophysical re-trieval chi-square probability method to identify re-gions of the ocean where ocean retrievals are affectedby geostationary communication satellites. The mag-nitude of the x2 statistic depends on the number ofmeasurements used in the retrieval and the number ofretrieved parameters; x2 will be low when the forwardmodel provides an excellent match with the AMSR-ETBs. Significant RFI in the AMSR-E TB will result inhigh x2 because the spectral characteristics of RFI dif-fer from the spectral characteristics of natural sources(Li et al., 2006).
Comparisons of the convergence metric distribu-tions using the 1-DVAR approach between two ver-sions(before and after RFI correction)are shown inFig. 1. We use x2 as a relative measure to show howclosely the forward model matches the measured TB.Various reasons,such as inaccurate modeling of theeffects of geophysical variations,ice cover, and precip-itation,could result in a poor goodness of fit betweenmodeled and measured TB,which is presented by highx2 values. In these cases,the high x2 values are spa-tially correlated with the geophysical parameters towhich AMSR-E is sensitive and will likely cause TBdifferences at multiple frequencies. Meanwhile,ran-dom measurement noise will be r and om both spatially and temporally,although it is usually frequency in-dependent. However,man-made radiation from activemicrowave transmitters(or RFI to a radiometer)is dis-tinctly different from natural radiation in terms of in-tensity,spatial variability,spectral characteristics, and channel correlations. RFI signals typically arise froma wide variety of coherent point target sources,i.e.,radiating devices and antennas,which are often direc-tional,isolated,narrowb and ed, and coherent. Thesecharacteristics of RFI may help to provide the criteriaof biases determined by RFI when x2 values are high.
Figures 1b,1e, and 1h show that convergencereaches almost everywhere,except for those regionswhere strong RFI exists(red dots in the ovals in Figs.1a,1d, and 1g). This corresponds to those dots(inred)with high values of x2 from 1-DVAR in the ovalsin Figs. 1b,1e, and 1h. Moreover,it is evident thatthere is a high consistency between the values of RFIindex and x2. The stronger the RFI contamination,the larger the x2. When RFI is larger than 10 K,the correlation coe±cient between RFI at 6.9 GHz forhorizontal/vertical polarization and x2 in the US is0.912/0.479; the correlation coe±cient between RFIat 10.7 GHz for horizontal/vertical polarization and x2 in Europe is 0.917/0.475; and the correlation coef-ficient between RFI at 10.7 GHz for horizontal/verticalpolarization and x2 in Japan is 0.921/0.396. However,convergence reaches over larger regions after the RFI-correction algorithm(Wu and Weng, 2011)is applied(oval areas in Figs. 1c,1f, and 1i).
 |
| Fig. 1. Comparison of the convergence metric distributions between the two versions of 1-DVAR with and withoutRFI correction based on the AMSR-E data on 3 October 2008 for ascending orbits. Left panels(a,d,g)represent theRFI distribution in the US at 6.9 GHz,Europe at 10.7 GHz, and Japan at 10.7 GHz,respectively; middle panels(b,e,h)represent the convergence metric distributions without RFI detection and correction in the US,Europe, and Japan,respectively; and right panels(c,f,i)represent the convergence metric distributions with RFI detection and correctionin the US,Europe, and Japan,respectively. |
L and and atmospheric parameters from MIRSproducts and for various sensors(NOAA-18,NOAA-19,Metop-A, and DMSPF16 SSMI/S)are validatedby using NWP(numerical weather prediction)analy-ses,such as those from the ECMWF and NCEP GDAS(Global Data Assimilation System)(Boukabara et al., 2011). The inconsistency in the results suggests thatthere is intra-variability between the different refer-ences used.
The NCEP GDAS outputs are taken as a re-ference in this study. Compared to collocated GDAS analysis,examples of MIRS outputs are presented inFigs. 2,3, and 4. Note that in these figures,GDASgrid data are interpolated in time and space to theexact location and time of the AMSR-E measurement(Yang and Weng, 2011)before the comparison is per-formed.
GDAS is the system used by the Global ForecastSystem(GFS)model to place observations into a grid-ded model space for the purpose of starting or initial-izing weather forecasts with observed data(Zheng et al., 2009; Yan and Weng, 2011; Yang and Weng, 2011).GDAS adds the following types of observations to agridded 3-D model space: surface observations,bal-loon data,wind profiler data,aircraft reports,buoyobservations,radar observations, and satellite obser-vations. Currently,GDAS produces global analyses oftemperature,water vapor profiles, and l and parame-ters,such as l and skin temperature(LST),soil mois-ture,snow depth,etc.,four times a day(0000,0600,1200, and 1800 UTC)with a spatial resolution of ap-proximately 0.3± after assimilating the conventional and satellite data.
An example of the LST difference between prod-ucts from GDAS and MIRS over snow-free and snow-covered l and surfaces on 3 October 2008 is presentedin Fig. 2. The middle panels in Fig. 2 show the LST difference(LSTMIRS-LSTGDAS)between outputs fromMIRS before RFI correction and GDAS,while theright panels in Fig. 2 represent the LST differencebetween outputs from MIRS after RFI correction and GDAS. The GDAS LST products are given in the leftpanels. In addition,note that the accuracy of theskin temperature estimate from GDAS over the high-latitude regions is poor due to surface snow and icecover.
 |
| Fig. 2. Comparison of LST derived from GDAS products and MIRS using AMSR-E data on 3 October 2008 forascending orbits. Left panels(a,d,g)represent the LST derived from GDAS products in the US,Europe, and Japan,respectively; middle panels(b,e,h)represent the LST difference between products derived from MIRS without RFIcorrection and GDAS in the US,Europe, and Japan,respectively; and right panels(c,f,i)represent the LST differencebetween products derived from MIRS with RFI correction and GDAS in the US,Europe, and Japan,respectively. |
Overall,major features of the surface tempera-ture from MIRS are consistent with GDAS products.The differences are found to be more pronounced in theRFI-contaminated regions. For example,based on Fig. 2,the retrieved LST over these areas contaminated byRFI is much higher than GDAS LST products,whichare represented by ovals in the middle panels. Mean-while,the differences of LST between the retrieval and GDAS are evidently decreased through taking the RFIcorrection algorithm into account(shown in the ovalsin the right panels). For the LST comparisons,similarto water vapor or TPW presented later,new retrievalsare obtained by using RFI-corrected AMSR-E bright-ness temperatures as renewed inputs to the retrievalsystem. Furthermore,in regions with much strongerRFI,such as Engl and ,Italy, and Japan,the conver-gence metric(x2)of 1-DVAR is too large and the con-vergence cannot be reached. Therefore,retrieval re-sults cannot be obtained since the retrievals are unre-liable. The LST statistics of studied areas before RFIcorrection show a mean bias of 2.42 K and a st and arddeviation of 6.29 K,while the statistics after RFI cor-rection show a mean bias of 1.73 K and a st and arddeviation of 5.59 K. Additionally,note that the pene-tration of microwaves is as much as a few centimetersinside the soil, and this penetration depth is depen-dent on the frequency and on the type of soil,whichcreates both systematic biases and scattered differ-ences.
Another way to validate the AMSR-E RFI detec-tion and correction algorithm is to compare the atmo-spheric moisture at 850 hPa derived from the MIRSalgorithm and that provided by the GDAS analysis.Figure 3 shows the differences in the humidity field at850 hPa as retrieved by MIRS using AMSR-E data on3 October 2008, and as provided by the GDAS anal-ysis. From these figures,we can see that the major-ity of moisture plumes and other large-scale featuresof GDAS are well captured by the MIRS retrievals.However,for those regions with weak or moderateRFI intensity,such as the US(Fig. 1a),the values ofMIRS retrievals(Fig. 3b)are much higher than thosefrom GDAS(Fig. 3a). Meanwhile,in those regions with the existence of extremely strong RFI,such asEngl and ,Italy, and Japan,the convergence metric(x2)from 1-DVAR is so large that the retrievals are re-jected in MIRS(Figs. 3e and 3h),which are similar tothe case of retrieved LST(Figs. 2e and 2h). However,those retrievals with abnormally high values due toRFI in Figs. 3b,3e, and 3h are mitigated in Figs. 3c,3f, and 3i by applying the RFI correction algorithm.The rejected retrievals due to strong RFI are also re-obtained. The statistics of atmospheric moisture at850 hPa for the studied areas before RFI correctionshow a mean bias of 0.36 g kg1 and a st and ard de-viation of 2.56 g kg1,while the statistics after RFIcorrection show a mean bias of 0.12 g kg1 and a stan-dard deviation of 2.15 g kg1.
 |
| Fig. 3. Comparison of water vapor at 850 hPa derived from GDAS products and MIRS using AMSR-E data on 3 October 2008 for ascending orbits. Left panels (a, d, g) represent the water vapor at 850 hPa derived from GDAS products in the US, Europe, and Japan, respectively; middle panels (b, e, h) represent the water vapor difference at 850 hPa between products derived from MIRS without RFI correction and GDAS in the US, Europe, and Japan, respectively; and right panels (c, f, i) represent the water vapor difference at 850 hPa between products derived from MIRS with RFI correction and GDAS in the US, Europe, and Japan, respectively . |
According to the studies of Boukabara et al.(2011),it is noticed that the st and ard deviation overl and using NOAA-18 data is consistent between thecomparisons made with ECMWF data and those madewith GDAS data,ranging between 54% at 300 hPa and 30% at the surface for the l and case. However,the biasis not consistent between the ECMWF and GDAS asreferences. It is also different from the assessment re-sults obtained when comparing to radiosondes. Theuncertainty computed by using the radiosondes as areference is similar at the surface with that obtainedusing ECMWF or GDAS(Boukabara et al., 2011).
| |
| Fig. 4. Comparison of TPW derived from GDAS products and MIRS using AMSR-E data on 3 October 2008 forascending orbits. Left panels(a,d,g)represent the TPW provided by the GDAS analysis in the US,Europe, and Japan,respectively; middle panels(b,e,h)represent the TPW difference between products derived from MIRS without RFIcorrection and GDAS in the US,Europe, and Japan,respectively; and right panels(c,f,i)represent the TPW differencebetween products derived from MIRS with RFI correction and GDAS in the US,Europe, and Japan,respectively. |
The global TPW has proved to be a useful prod-uct for many applications,including short-term pre-cipitation forecasting and studies of the hydrologicalcycle. The retrieved moisture profile is vertically in-tegrated to generate the TPW from MIRS,which bydefinition ensures that there is consistency betweenthe profile and the TPW. The TPW from MIRS wasfound to be valid over all surface types,except whenthere is precipitation since it is radiometrically di±-cult to distinguish the water vapor signature from theliquid water signature.
Figure 4 presents a set of TPW maps correspond-ing to the MIRS retrieval and the GDAS-based prod-ucts. It is shown that MIRS compares favorably toGDAS in terms of the distribution of the features aswell as the statistical performance. The TPW statis-tics of the studied areas before RFI correction showa mean bias of -2.75 mm and a st and ard deviation of9.88 mm,while the statistics after RFI correction showa mean bias of -3.37 mm and a st and ard deviation of8.56 mm.
The two estimates(GDAS and MIRS)of TPWdiffer in snow and ice covered areas,which could beattributed to the poor accuracy of the skin tempera-ture estimate from GDAS over these types of surfaces(Boukabara et al., 2011). Boukabara and Weng(2008)assessed the TPW global coverage from MIRS using anumber of different reference datasets, and the assess-ments were stratified by surface background types aswell as by sensors.5. Summary and conclusions
An RFI detection and correction algorithm is ap-plied in retrieving a comprehensive suite of geophys-ical parameters from AMSR-E measurements usingthe MIRS 1-DVAR method. The suite of parametersincludes a set of derived and post-processed productsalso derived from MIRS. In the retrieval process,theRFI correction algorithm based on the natural chan-nel correlations between AMSR-E measurements atneighborhood frequencies is used to predict and cor-rect RFI-contaminated brightness temperatures. Theresults show that the difference caused by RFI be-tween new retrievals and GDAS products,which aretaken as reference,is evidently decreased. In partic-ular,for those regions with much stronger RFI,theconvergence metric(x2)of 1-DVAR is significantlydecreased after RFI correction such that the conver-gence can be reached and the retrieval results canbe obtained. Furthermore,x2 from 1-DVAR could beutilized not only as a metric of goodness of fit betweenmodeled and measured brightness temperature,butalso as a detector to identify geographical regions ofpossible RFI. The x2 will be high when the forwardmodel provides a poor match with the AMSR-E TB.The AMSR-E TB measurements are significantly con-taminated by RFI since the spectral characteristics ofRFI differ from the spectral characteristics of naturalsources. The results of RFI detected by x2 are almostconsistent with those identified by the spectral differ-ence method.
| [1] | Adams, I. S, M. H. Bettenhausen, P. W. Gaiser, et al., 2010: Identiflcation of ocean-reflected radiofrequency interference using WindSat retrieval chisquare probability. IEEE Geosci. Remote Sens. Lett., 7, 406-410. |
| [2] | Anterrieu, E., 2011: On the detection and quantification of RFI in L1a signals provided by SMOS. IEEE Trans. Geosci. Remote Sens., 49, 3986-3992. |
| [3] | Boukabara, S. A., and F. Weng, 2008: Microwave emissivity over ocean in all-weather conditions: Validation using WindSat and airborne GPS-dropsondes. IEEE Trans. Geosci. Remote Sens., 46, 376-384. |
| [4] | —-, K. Garrett, W. Chen, et al., 2011: MiRS: An allweather 1DVAR satellite data assimilation and retrieval system. IEEE Trans. Geosci. Remote Sens., 49, 3249-3272. |
| [5] | Camps, A. A., J. Gourrion, J. M. Tarongi, et al., 2010: RIF Ranalysis in SMOS imagery. 2010 IEEE International Geoscience and Remote Sensing Symposium (IGARSS). Honolulu, HI, IEEE, 2007-2010, doi: 10.1109/IGARSS.2010.5654268. |
| [6] | Castro, R., A. Guti′errez, and J. Barbosa, 2012: A first set of techniques to detect radio frequency interferences and mitigate their impact on SMOS data. IEEE Trans. Geosci. Remote Sens., 50, 1440-1447. |
| [7] | Ding, S., P. Yang, F. Weng, et al., 2011: Validation of the community radiative transfer model. J. Quant. Spectrosc. & Radiative Transfer., 112, 1050-1064. |
| [8] | Ellingson, S. W., and J. T. Johnson, 2006: A polarimetric survey of radio-frequency interference in Cand X-bands in the continental United States using WindSat radiometry. IEEE Trans. Geosci. Remote Sens., 44, 540-548. |
| [9] | Eyre, J. R., G. A. Kelly, A. P. NcNally, et al., 1993: Assimilation of TOVS radiance information through one-dimensional variational analysis. Quart. J. Roy. Meteor. Soc., 119, 1427-1463. |
| [10] | Gasiewski, A. J., M. Klein, A. Yevgrafov, et al., 2002: Interference mitigation in passive microwave radiometry. IEEE International Geoscience and Remote Sensing Symposium. Toronto, Canada, IEEE, 1682-1684. |
| [11] | Hallikainen, M., J. Kainulainen, J. Seppanen, et al., 2010: Studies of radio frequency interference at L-band using an airborne 2-D interferometric radiometer. 2010 IEEE International Geoscience and Remote Sensing Symposium (IGARSS). Honolulu, HI, IEEE, 2490-2491, doi: 10.1109/IGARSS.2010.5651866. |
| [12] | Han, Y., van P. Delst, Q. Liu, et al., 2006: Community Radiative Transfer Model (CRTM): Version 1, NOAA Technical Report NESDIS 122. NOAA, Washington, DC, 33 pp. |
| [13] | Japan Aerospace Exploration Agency (JAXA) Press, 2012: Launch Result of the Global Changing Observation Mission 1st-Water “SHIZUKU” (GCOM-W1) and the Korean Multi-Purpose Satellite 3 (KOMPSAT-3) by H-IIA Launch Vehicle No. 21. Available online at: http://www.jaxa. jp/press/2012/05/20120518− h2af21− e.html,2012. |
| [14] | Johnson, J. T., A. J. Gasiewski, B. Guner, et al., 2006: Airborne radio-frequency interference studies at Cband using a digital receiver. IEEE Trans. Geosci. Remote. Sens., 44, 1974-1985. |
| [15] | Kachi, M., K. Imaoka, H. Fujii, et al., 2008: Status of GCOM-W1/AMSR2 development and science activities Sensors, Systems, and Next-Generation Satellites XII. Proceedings of the SPIE, 7106, 71060P-71060P-8, Meynart, R., S. P. Neeck, H. Shimoda, et al., doi: 10.1117/12.801228. |
| [16] | Kidd, C., 2006: Radio frequency interference at passive microwaves observation frequencies. Int. J. Remote Sens., 27, 3853-3865. |
| [17] | Lacava, T., I. Coviello, M. Faruolo, et al., 2013: A multitemporal investigation of AMSR-E Cband radio-frequency interference. IEEE Trans. Geosci. Remote Sens., 51, 2007-2015, doi: 10.1109/TGRS.2012.2228487. |
| [18] | Le Vine, D. M., G. S. E. Lagerloef, F. R. Colomb, et al., 2007: Aquarius: An instrument to monitor sea surface salinity from space. IEEE Trans. Geosci. Remote Sens., 45, 2040-2050. |
| [19] | Li, L., E. G. Njoku, E. Im, et al., 2004: A preliminary survey of radio-frequency interference over the U. S. in Aqua AMSR-E data. IEEE Trans. Geosci. Remote Sens., 42, 380-390. |
| [20] | —-, P. W. Gaiser, M. H. Bettenhausen, et al., 2006: WindSat radio-frequency interference signature and its identification over land and ocean. IEEE Trans. Geosci. Remote Sens., 44, 530-539. |
| [21] | Mecklenburg, S., M. Drusch, Y. H. Kerr, et al., 2012: ESA’s soil moisture and ocean salinity mission: Mission performance and operations. IEEE Trans. Geosci. Remote Sens., 50, 1354-1366. |
| [22] | Misra, S., and C. S. Ruf, 2008: Detection of radio-frequency interference with the aquarius radiometer. IEEE Trans. Geosci. Remote Sens., 46, 3123-3128. |
| [23] | —-, and —-, 2012: Analysis of radio frequency interference detection algorithms in the angular domain for SMOS. IEEE Trans. Geosci. Remote Sens., 50, 1448-1457. |
| [24] | Njoku, E. G., P. Ashcroft, T. K. Chan, et al., 2005: Global survey and statistics of radio-frequency interference in AMSR-E land observations. IEEE Trans. Geosci. Remote Sens., 43, 938-947. |
| [25] | Oliva, R., E. Daganzo-Eusebio, Y. H. Kerr, et al., 2012: SMOS radio frequency interference scenario: Status and actions taken to improve the RFI environment in the 1400-1427-MHz passive band. IEEE Trans. Geosci. Remote Sens., 50, 1427-1439. |
| [26] | Piepmeier, J. R., P. N. Mohammed, and J. J. Knuble, 2008: A double detector for RFI mitigation in microwave radiometers. IEEE Trans. Geosci. Remote Sens., 46, 458-465. |
| [27] | Ruf, C., S. M. Gross, and S. Misra, 2006: RFI detection and mitigation for microwave radiometry with an agile digital detector. IEEE Trans. Geosci. Remote Sens., 44, 694-706. |
| [28] | Skou, N., S. Misra, J. E. Balling, et al., 2010: L-band RFI as experienced during airborne campaigns in preparation for SMOS. IEEE Trans. Geosci. Remote Sens., 48, 1398-1407. |
| [29] | Weng, F., B. Yan, and N. C. Grody, 2001: A microwave land emissivity model. J. Geophys. Res., 106, 20115-20123. |
| [30] | Wu Ying and Weng Fuzhong, 2011: Detection and correction of AMSR-E radio-frequency interference. Acta Meteor. Sinica, 25, 669-681. |
| [31] | Yan, B., and F. Weng, 2011: Effects of microwave desert surface emissivity on AMSU-A data assimilation. IEEE Trans Geosci. Remote Sens., 49, 1263-1276. |
| [32] | Yang, H., and F. Weng, 2011: Error sources in remote sensing of microwave land surface emissivity. IEEE Trans. Geosci. Remote Sens., 49, 3437-3442. |
| [33] | Zheng, W., J. Meng, H. Wei, et al., 2009: Improvement of satellite data utilization in NCEP operational NWP modeling and data assimilation systems. Proc. 2nd Workshop Remote Sens. Model. Surf. Properties, Toulouse, France, June 9-11, 14 pp. |
| [34] | Zou, X., J. Zhao, F. Weng, et al., 2012: Detection of radio-frequency interference signal over land from FY-3B Microwave Radiation Imager (MWRI). IEEE Trans. Geosci. Remote Sens., 40, 4994-5003. |