 2014, Vol. 28
The Chinese Meteorological Society
Article Information
- LI Xuesong, LUO Yali, GUAN Zhaoyong. 2014.
- The Persistent Heavy Rainfall over Southern China in June 2010:Evolution of Synoptic Systems and the Effects of the Tibetan Plateau Heating
- J. Meteor. Res., 28(4): 540-560
- http://dx.doi.org/10.1007/s13351-014-3284-3
Article History
- Received January 16, 2014;
- in final form April 28, 2014


2 Key Laboratory of Meteorological Disaster of Ministry of Education, School of Atmospheric Sciences, Nanjing University of Information Science & Technology, Nanjing 210044;
3 Dalian Meteorological Bureau, Dalian 116001
Covering about a quarter of the Chinese territorY,the mean elev ation of the Tibetan Plateau(TP)ismore than 4000 m above sea level. Because of its special location,large size, and high elev ation,the TP's dynamic and heating effects can exert great influenceson weather and climate in China,East Asia, and eventhroughout the globe(Ye and Gu, 1955; Flohn,1957).The diabatic heating of the TP has a significant impacton the planetary-scale circulation and summer monsoon circulation(Hahnd and Manabe, 1975; Huang,1985; He et al., 1987; Kitoh,2004). The air over theTP sinking in winter and rising in summer acts like ahuge "air pump" that affects surrounding and globalatmospheric circulations. In summer,the plateau is aheat source on average compared to the atmosphereover the plateau(Ye and Gao, 1979). The surface sensible heat flux,which is large near the northern and southern flanks of the TP,appears to be the majordriving source. This "sensible heat pump"(Wu et al., 2006)regulates the development,adv ance, and retreatof the East Asian rainb and (Xu et al., 2010). Researchhas also indicated that the lower sensible heating fluxof TP in spring will delaYthe seasonal conversion ofthe l and -sea thermal contrast in East Asia, and weakenthe East Asian summer monsoon circulation. In contrast,a larger sensible heating flux in spring can leadto an earlier onset of the East Asian summer monsoon and strengthen the monsoon circulation(Duan et al., 2012).
The generation and development of the weathersystems over the TP are significantlYaffected bYtheplateau's surface thermal conditions. For example,theplateau's surface sensible heating can reduce atmospheric stabilitY,increasing the boundarYperturbation(Wang,1987). This effect plays an important role inthe generation of the low-pressure vorticitYover theplateau and its southeastern margin near the Sichuanbasin(Luo et al., 1991; Luo and Yang, 1992; Chen et al., 1996; Li et al., 2002; Li and Liu, 2006). BYcomparing adiabatic processes,diabatic processes,presence and absence of surface sensible heating and latentheating,respectivelY,in a series of numerical experiments,some scholars concluded that the formation ofthe plateau vortex is mainlYcaused bYdiabatic processes. Within the diabatic processes,theYconcludedthat the plateau surface sensible heating effect is muchmore important than the surface latent heating(Luo and Yang, 1992). Subsequent case studies also foundthat if there is no surface sensible heating effect,theplateau vortex will not form(Chen et al., 1996). Moreover,the strengthening and developing of the TP vortex after its formation is generallYconsidered to becloselYrelated to the release of latent heating, and the convectivelYgenerated latent heating feedback effect is more important than the large-scale latent heating(Chen et al., 1996). The surface sensible heatingalso plays an important role in the development of theplateau vortex,depending on the configuration of thevortex center and the sensible heating center. Whenthe two centers are appropriatelYlocated,greater differences in temperature create a more conducive environment for the development of the vortex(Li et al., 2002).
In recent years,persistent heavYrainfall eventshave attracted increasing attention, and some progresshas been made on the impact of TP on the persistent rainfall over southern China. Some researcherspointed out that the existence of the southwest windcenter over the southeastern edge of the plateau isthe main climatic cause of persistent precipitation insoutheastern China(Wan and Wu, 2007; Wan et al., 2009). In spring,TP is a weak heating source. TPheating-forced low-level cyclonic winds can strengthenthe southwest flows over its southeastern margin,transporting warm air to South China. Meanwhile,the plateau's bypassing effect strengthens the southward movement of northern cold air. The warm and cold air masses converge over South China,increasingspring precipitation therebY(Liang et al., 2005; Wan and Wu, 2007; Wan et al., 2009). The plateau's strongsurface heating effect can maintain from spring to summer,turning the summer plateau into a strong atmospheric heating source(Wang et al., 2013). In summer,the TP's heating effect is a main factor causing lowerlevel cyclonic circulation and higher-level anticycloniccirculation over the plateau and its surrounding areas(Wu and Liu, 2000; Wu et al., 2002). The TP'sthermal forcing can strengthen the South Asian high,with its center moving northwestward(Liang et al., 2005). It can also lead to a RossbYwave train downstream. A cyclonic response over the northeasternplateau strengthens the lower-level northerlYover thenorthern China, and an anticyclonic response over thewestern Pacific enhances the subtropical high and thelower-level southerlYalong its west. Warm and cold airflows converge over the Huaihe River basin,strengthening summer rainfall in the region. In summer,theTP's sensible heating strengthens the warm center of the plateau,which causes the eastward-moving warmadvection to be enhanced,with upward motion and persistent precipitation in the Huaihe River basin alsostrengthened(Wang et al., 2013). In addition,changesof the East Asian circulation pattern and the abnormal distribution of clouds,which are induced bYtheabnormal thermal conditions of the TP surface,weremain causes of the persistent rainfall over the HuaiheRiver in summer 1991(Zhang et al., 1995).
Previous studies of the TP focused mainlYonthe climate influence perspective,i.e.,more about theTP's influence on the general circulation,monsoon,etc.,but less about the influence of TP from a synoptic perspective. There are feWstudies that look at theTP's heating effects on the persistent heavYrainfall insouthern China. Previous research has concentratedrelativelYmore in spring,with fewer studies investigating summer patterns. More serious disasters arecaused bYheavYrainfall in summer and the physicalmechanisms underlying the persistent heavYrainfallin southern China are still unclear. Therefore,it isnecessarYto analyze the TP's impact on persistentheavYrainfall in southern China from the perspectiveof synoptic meteorology,to reveal the physical mechanisms of TP's thermal forcing effects, and to identifythe main influencing factors and pathways.
South China is a region with the longest rainYseason,the highest maximum precipitation, and the mostflood disasters. Persistent heavYrainfall often occursin the rainYseason,influencing economic development and people's livelihood. In June 2010,South China and southern Jiangnan experienced persistent heavyrainfall that caused severe flooding,l and slides,mudslides, and other disasters. This affected 1.432 millionpeople in F ujian,Guangxi,Sichuan,Guangdong, and Jiangxi provinces,with a death toll of 42,missing people of 36, and collapsed houses of more than 6000. Thedirect economic losses were approximatelY2.04 billion yuans(http://news.xinhuanet.com/politics/2010-06/16/c-12226604.htm). Kong(2010),Wang et al.(2011), and Yuan et al.(2012)described the largescale circulation patterns during the persistent heavyrainfall events in June 2010 in southern China. Thehigher-level South Asian high and westerlYjet wereconducive to the divergence over South China(Yuan et al., 2012). At middle and lower levels,the Ural blocking high and the Lake Baikal trough were strongerthan normal and maintaining stable(Wang et al., 2011),with much fluctuation moving eastward in lowlatitudes. The subtropical high was stronger and located anomalouslYwestward(Kong,2010). Along thenorthwest side of the subtropical high,the southwestmonsoonal flows transported water vapor from thewestern Pacific,the BaYof Bengal, and the SouthChina Sea to South China, and then converged withthe drY and cold air from the mid and high latitudes(Wang et al., 2011; Yuan et al., 2012). He and Li(2013)carried out numerical experiments to investigate the TP's topographic effects on persistent rainfallevents in southern China in MaY2010. Based on allthese prior studies,we will further examine the mechanism of hoWthe TP's heating effects influence thepersistent heavYrainfall in southern China in June2010.
First,we compare and analyze the rainfall distribution and large-scale circulation in June 2008 and June 2010 to find similarities and differences in relatedpersistent rainfall characteristics. Both 2008 and 2010experienced the strongest persistent rainfall in southern China. Compared with June 2008,June 2010 ischaracterized bYfrequent occurrences of low-value systems in the middle and lower troposphere from the TPto the lower reaches of the Yangtze River(Figs. 2c and 2d). Persistent precipitation over southern Chinais more likelYto be influenced bYthe plateau's heatingeffect,so we select June 2010 for further studY. We analyze the evolution of weather systems in each precipitation event during 14-24 June 2010 in order to learnmore about the relationship between the persistentheavYrainfall over southern China and the short-termchanges of the main weather systems. For instance,weanalyze the South Asian high,western Pacific subtropical high(WPSH),as well as the middle- and lowerlevel loWsystems. We then carrYout two ensembles ofhigh-resolution(4-km horizontal grid spacing)simulations,including a control- and a sensitivity-ensembleexperiment,using the WRF model(Skamarock et al., 2008)for the four rainfall events. The control(CTL)experiment reproduces the observed surface precipitation,atmospheric circulation, and the main featuresof the weather systems. The sensitivitY(SEN)experiment is carried out with the surface albedo over the TPbeing changed artificiallYto one(Fig. 1c); otherwise,it is identical to the CTL experiment. In the SEN experiment,the TP does not absorb solar radiation and the surface graduallYcools,thus the plateau's surfacesensible heating effect on the atmosphere is eliminated.FinallY,we compare the two ensemble simulations and discuss the influence of the TP's heating effects on thepersistent heavYrainfall in southern China in June2010.2. Data,model, and numerical experiments2.1 Data
T o reveal the distribution of precipitation,we usea 0.1°× 0.1°gridded hourlYprecipitation dataset(http://cdc.cma.gov.cn/dataSetDetailed.do)in June2008 and June 2012. The data are generated bymerging the Chinese automatic weather station rainfall records with CMORPH(Joyce et al., 2004).
The ERA-interim reanalysis from ECMWF witha horizontal resolution of 1.5°× 1.5°(Dee et al., 2011)is averaged for June of 1981-2010. This is used to reveal the climatic circulation patterns in June.
We make use of the ERA-interim reanalysis datafrom 1800 UTC 12 to 0000 UTC 25 June 2010 at 6-h interv als(0000,0600,1200, and 1800 UTC)with ahorizontal resolution of approximatelY0.7°× 0.7° and 37 vertical layers. This is used to analyze the circulation as well as weather systems and their evolutionduring the studYperiod. The data are also used toprovide the initial and lateral boundarYconditions forthe WRF model.2.2 Model and exp erimental design
Recent studies shoWthat numerical simulations(or forecasts)with 1-4-km horizontal resolutions canexplicitlYrepresent convective and mesoscale circulations,which is called "convection-permitting." Thismethod avoids the use of deep convective parameterization schemes and associated large uncertainties,thusimproving the model's precipitation simulation(Kain et al., 2008; Lean et al., 2008; Schwartz et al., 2009).Studies also shoWthat the ensemble-mean precipitation from ensemble simulations(or forecasts)is muchcloser to observation than the results from individual members(Du et al., 1997; Chien and Jou, 2004).Meanwhile,ensemble forecasts also shoWadvantagesto single deterministic forecasts for other variablessuch as wind(Grimit and Mass, 2002),temperature, and humiditY(Stensrud and Yussouf, 2003). Therefore,we carrYout a series of high-resolution(4 km)ensemble simulations for the persistent precipitationin June 2010 to studYthe heating effects of the TP .
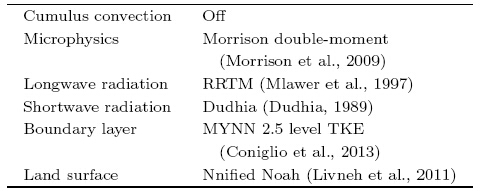
In this studY,we carrYout two five-memberconvection-permitting ensemble simulations for thepersistent heavYrains during 14-24 June 2010 insouthern China using the WRF model. A set of controlexperiment(CTL) and sensitivitYexperiment(SEN)are carried out,respectivelY. All the simulations runwith a single grid across the Eurasian continent,covering 15°-50°N,50°-125°E(Fig. 1a). The east-westdistance is up to 7600 km,the north to south is approximatelY3550 km,the horizontal resolution is 4km, and there are 1876 × 888 grid points and 40vertical layers. The five members of each ensembleare produced with different initial fields,i.e.,startingfrom 1800 UTC 12 and 0000,0600,1200, and 1800UTC 13 June 2010,respectivelY. All simulations terminate at 0000 UTC 25 June 2010. Outputs from0000 UTC 14 to 0000 UTC 25 June 2010 are analyzed.The main plateau is defined as the region more than3000 m above sea level over 25°-40°N,60°-110°E.The southern slope of the TP(SSP)is 500-3000 mabove sea level from 70°to 98°E. In the SEN,thesurface albedo over the TP and its SSP is changedartificiallYto one(Fig. 1c). This means that thesurface of the plateau and the SSP does not absorbsolar heating, and thus the surface sensible heatingeffects on the atmosphere are removed. Through numerical simulation studies,Li et al.(2000)showedthat when the surface albedo increases,the net radiation received bYthe ground is reduced,the groundtemperature drops,the sensible heating of the bottomatmosphere is weakened,local convection and precip-itation are suppressed and the corresponding condensation heating in the middle troposphere is also weakened. Boos and Kuang(2010)also artificiallYchangedthe surface albedo over the TP to one when studying the impact of the TP's heating effects on theAsian monsoon. Physical parameterization schemes and model configuration details of the two simulationsare shown in Table 1. All of the simulation results be-loWare the average of all members in an ensemblesimulation.
 |
| Fig. 1.(a)Simulation domain and topographY. Surface albedo averaged during 14{24 June 2010 for the(b)controlexperiment(CTL) and (c)sensitivitYexperiment(SEN). The thick black line represents the 3-km topographYcontourwhile the thin black lines represent the YelloWRiver and the Yangtze River. |
Analyzing the dailYaverage precipitation during June of 2006-2012 in southern China(20°-28°N,110°-120°E)using CMORPH(figure omitted),we findthat the maximum precipitation occurred in June of2008 and 2010. In this section,we compare the rainfall and circulation characteristics in June of 2008 and 2010 to analyze the similarities and differences between the two years.
Comparing the distribution of cumulative precipitation(Figs. 2a and 2b)in June of 2008 and 2010,we find that,in June 2008,heavYrainfall in southernChina mainlYoccurred over the South China coastsas well as in Guangdong Province and Guangxi Region. In June 2010,several heavYrainfall centers appeared,mainlYlocated in Guangdong,Guangxi,F ujian,Jiangxi, and Zhejiang. Compared with the situation in June 2008,the rainb and in 2010 was northward and heavYrainfall centers were more dispersed.
 |
| Fig. 2. Comparison between(a,b)accumulated precipitation(color shading; mm; blue lines denote 1- and 3-km terraincontours) and (c,d)500-hPa geopotential height(black solid line; dagpm) and its climatic anomalies(color shading;dagpm; thick purple lines denote the 3.5-km terrain contour)during(a,c)June 2008 and (b,d)June 2010. |
The geopotential height and its climatologicalanomalies at 500 hPa in June 2008(Fig. 2c)showthat positive geopotential height anomalies extendednortheastward from the northwestern TP to the Sea ofOkhotsk. Negative anomalies covered eastern China, and the midlatitude trough and ridge were stronger.Cold and warm air activities were also stronger and theYconverged in the Yangtze River basin and SouthChina,which was conducive to persistent heavYrainfall. In June 2010(Fig. 2d),negative anomaliesof 500-hPa geopotential anomalYextended east-westward from the TP to the Yangtze River basin,suggesting frequent loWsystem activities. The low-latitudepositive anomalies covered from the Arabian Sea tothe western Pacific,illustrating that the western Pacific subtropical high(WPSH)was stronger and oriented westward. The 588-dagpm geopotential heightcontours extended westward to about 105°E and thesouthwest flows along the northwest side of the subtropical high were transporting moisture to SouthChina. The cold and warm air masses converged inthe Yangtze River basin and South China. Comparedwith the case in June 2008 and the climate mean condition,the WPSH was much stronger and much morewestward in June 2010.
Comparing the anomalies in divergence and windfields at 850 hPa between June 2008 and June 2010(figure omitted),we find that the similarities betweenthe two years lie in an anomalous convergence zonethat extended from south of the Yangtze River toSouth China,the stronger southwest flows along theSouth China coast, and the control of anticyclonic circulation anomalies over the South China Sea. Thedifference is that in June 2008 the abnormal wind convergence zone near the South China coast was mainlylocated in Guangdong and Guangxi,whereas in 2010it was relativelYmore to the north,corresponding tothe differences in location of precipitation.4. Rainfall distribution and weather systemevolution during 14-24 June 2010
T o further clarifYthe relationship between thepersistent heavYrainfall over southern China in June and main short-term changes of the weather systemssuch as the WPSH,we choose four strongest precipitation events during 14-24 June 2010 for a furtheranalysis.
During 14-24 June 2010,four cumulative precipitation centers were found located in the northern Arabian Sea,the northern part of the BaYof Bengal,theSSP, and southern China(Fig. 3a). The overall rainb and in southern China was east to west oriented witha patchYdistribution, and the maximum rainfall centers were mainlYlocated on the borders of F ujian,Zhejiang, and Jiangxi provinces. According to the rainfall distribution and atmosphere circulation pattern,we divide 14-24 June into four sub-periods: 14-15,16-18,19-21, and 22-24 June. We then analyze thespatial and temporal distributions of rainfall and themain weather systems during these sub-periods.
 |
| Fig. 3. Accumulated precipitation(mm)during 14{24 June 2010 from(a)observation(OBS),(b)control experiment(CTL), and (c)sensitivitYexperiment(SEN);(d)difference in the accumulated precipitation between the control and sensitivitYexperiments(CTL{SEN);(e)significance test result,where the blue/red shading represents significant valuesat the 95% confidence level. Blue lines denote the 1- and 3-km terrain contours; black line denotes the coastline,theYangtze River, and the YelloWRiver. |
During 14-15 June(Fig. 4a),southern Chinaexperienced a heavYprecipitation event,showing anortheast-southwest zonal distribution. The precipitation was more than 100 mm in eastern Guangxi,northern Guangdong, and F ujian. During 16-18 June(Fig. 4b),heavYprecipitation occurred in Jiangnan and South China again,showing a patchYdistribution, and there were two main heavYprecipitation centers(> 100 mm). One of the centers was located innorthern Guangxi, and the other in Jiangxi and F ujian. During 19-21 June(Fig. 4c),two heavYrainfallb and s appeared in southern China. TheYwere locatedon the south side of the middle reaches of the YangtzeRiver(Jiangxi and Hunan) and from the borders ofF ujian,Zhejiang, and Jiangxi provinces to the northof Guangxi,respectivelY. The largest precipitation(>200 mm)appeared on the borders of Jiangxi,F ujian, and Zhejiang provinces. During 22-24 June(Fig. 4d),Jiangnan and South China experienced the fourth precipitation process. The heavYprecipitation center(>100 mm)appeared in northern F ujian,Jiangxi, and central Hunan.
 |
| Fig. 4.Accumulated precipitation(mm)during each rainfall event during 14{24 June 2010 from(a{d)the observation(OBS) and (e{h)the control experiment(CTL). The panels from top to bottom shoWthe first,second,third, and fourthprecipitation events. Blue lines denote the 1- and 3-km terrain contours; black lines denote the coastline,the YangtzeRiver, and the YelloWRiver. |
Comparing the four events,we find that heavyprecipitation was all located in southern China witha zonal or patchYdistribution. The difference is thatin the first event(Fig. 4a)the precipitation occurredrelativelYsouth,while in the second,third, and fourthevents(Figs. 4b-d)the precipitation mainlYoccurredin Jiangnan and northern South China with the mainprecipitation center located on the borders of F ujian,Zhejiang, and Jiangxi provinces.
During the four events,the associated weathersystems at 200 hPa were the South Asian high and the accompanying high pressure ridge. The SouthAsian high appeared over the southern TP while thehigh pressure ridge controlled main TP and easternChina(figure omitted). During the first three precipitation events,the South Asian high graduallYintensified,exp and ed and shifted towards the TP . Inthe fourth event,the South Asian high substantiallyweakened and shrinked, and the precipitation graduallYdissipated. During the four events,strong divergence mainlYoccurred over South China,TP, and the BaYof Bengal. However,in the first event,strongdivergence mainlYoccurred over South China coastalareas,while in the second,third, and fourth events,divergence was found over Jiangnan and northernSouth China,indicating that the upper-level divergence corresponds well with the location of the surfaceheavYrainfall area during each event.
The main weather systems at 500 hPa were themid- and high-latitude trough and ridge,the WPSH,as well as the eastward-moving shalloWtroughs in thestraight westerlies over South China. In the first threeevents(Figs. 5a-c),the mid- and high-latitude trough and ridge strengthened and the WPSH graduallYextended westward and northward. In the fourth event(Fig. 5d),the trough and ridge moved eastward,theWPSH retreated eastward and southward, and theprecipitation graduallYstopped.
 |
| Fig. 5.(a-d)500-hPa geopotential height(black solid lines; dagpm),temperature(red dotted lines; ℃),wind barbs, and relative vorticitY(graYshading; 10-5s-1)averaged during each precipitation event during 14{24 June 2010. Bluesolid lines denote the 3-km topographYcontour.(e-h)850-hPa geopotential height(black solid curves; dagpm),wind(vectors), and water vapor flux(blue shading; m g kg-1s-1)at selected times of each precipitation event:(e)1800 UTC14 June,(f)0000 UTC 17 June,(g)1800 UTC 19 June, and (h)0000 UTC 24 June. Dark black lines denote shear line and green lines denote the YelloWRiver and the Yangtze River. |
At 700 and 850 hPa,the main weather systemswere the WPSH,the deep trough stretching southward from the North China vortex,shear lines near theYangtze River, and eastward-moving vortices alongthe shear line. In the first,third, and fourth events(Figs. 5e,5g,5h),southwest vortices were generatedaround the east of the plateau and moved eastwardalong the shear line(the vortices were originated fromthe Sichuan basin and its surrounding areas), and largewater vapor flux appeared south of the shear line,orover the vortex centers,or on the right side ahead ofthe vortex centers' moving direction. In the secondprocess(Fig. 5f),South China was located in frontof the deep trough that stretched southward from the North China vortex, and large water vapor flux occurred to the southeast of the trough tip.
Previous studies shoWthat the intensitYof theSouth Asian high,the generation and development ofTP vortices are closelYrelated to the TP's heatingconditions(Li et al., 2002; Wu et al., 2002). RecentlY,Li and Duan(2011)found that the diabaticheating over the TP modulates the behavior of theSouth Asian high to a considerable degree. When thediabatic heating is strong,the upper-level anticycloneis usuallYlocated over the western TP to the IranianPlateau,corresponding to a westward South Asian high,namelY,there occurs the "Iranian high mode."In contrast,when the heating is weak,the South Asianhigh is eastward,namelY,there appears the "Tibetanhigh mode." T o further studYthe impacts of the TP's heating effect on the weather systems and the persistent rainfall in southern China in June 2010,thefollowing numerical experiments are carried out.5. The numerical simulations
Comparing the simulated and observed cumulative rainfall distributions during 14-24 June(Figs. 3a and 3b),we find that the precipitation area,scope, and intensitYin the ensemble mean are consistent with theobserv ation. The simulation successfullYreproducesthe heavYrainfall centers in the northern Arabian Sea,northern BaYof Bengal,the SSP, and southern China.The main discrepancies between the simulation and observation are that the simulated maximum rainfallin southern China,southeast of the TP, and northernBaYof Bengal are stronger,heavYrainfall(> 500 mm)area is larger and more southeastward, and the precipitation over the Indian Peninsula is weaker than theobserv ations. For the four precipitation events oversouthern China,it is obvious that the simulation reproduces the observed rainfall distribution,with onlyslight differences in the intensitYor location of therainfall centers(Fig. 4).
For the upper-level atmosphere circulations(Figs.6a and 6b),the simulation successfullYreproduces thetime-averaged circulation and divergence at 200 hPa.The location and intensitYof the South Asian highare consistent with the observ ation,but the upperlevel divergence over southern China,particularlYoverthe South China coast,are stronger than the observ ation. This corresponds to the stronger rainfall overthe South China coast in the simulation(Figs. 3a and 3b). Comparing the simulated and observed circulation and relative vorticitYat 500 hPa(Figs. 6c and 6d),we find that the simulation reproduces theridge over the northern TP,the southern trough nearthe BaYof Bengal, and the WPSH,including their location and intensitY. The simulation also reproducesthe distribution characteristics of the relative vorticitY,including the positive vorticitYzone that stretchedeastward from the TP to the mid-lower reaches ofYangtze River. The observed relative vorticitYaveraged over 25°-35°N at 500 hPa(Fig. 7a)clearlYshowsthat positive vorticitYfrom the eastern TP propagatedeastward four times during 14-25 June and arrived at the East China Sea 2-3 days later,corresponding tothe simulated generation and development of low-levelvortices(Fig. 7b).
 |
| (a,b)Geopotential height(black solid lines; dagpm),temperature(red dotted line; ℃),wind barbs, and divergence(graYshading; 10-5s-1)at 200 hPa averaged during 14-24 June 2010, and (c,d)geopotential height(blacksolid curves; dagpm),wind barbs, and relative vorticitY(graYshading; 10-5s-1)at 500 hPa averaged during 14-24 June2010 from(a-c)ERA-interim and (b,d)the control experiment(CTL). Blue solid lines denote the 3-km topographycontour,graYlines denote coastal lines, and green lines denote the YelloWRiver and the Yangtze River. |
 |
| Fig. 7. Relative vorticitY(10-5s-1)at 500 hPa averaged over 25°-35°N from(a)ERA-interim,(b)CTL, and (c)SEN. |
The fourth event(22-24 June)had the strongestvortices, and is noWfurther analyzed. At 0600 UTC23 June(Fig. 8a),the vortices had alreadYformednear the Sichuan basin. At 1800 UTC 23 June(Fig. 8b),the vortices moved out of the basin and developed eastward. BY1800 UTC 24 June(Fig. 8d),thevortices had significantlYenhanced with their centerslocated south of the Yangtze River, and heavYrainfalloccurred to the south of the vortices' center. Comparing the simulated(Figs. 8e-h) and observed(Figs.8a-d)circulation at 700 hPa in the fourth event,itis obvious that the CTL experiment successfullYreproduces the generation and development of the TPvortices.
Similar to Figs. 5e-h,Figs. 9a-d shoWthe atmospheric circulation and water vapor flux at 850 hPafor selected times of each precipitation event in CTL and SEN. The ensemble simulations reproduce the observed main weather systems at 850 hPa,i.e.,theWPSH,the southern trough near the BaYof Bengal(Figs. 9c and 9d),the deep trough stretching southward from the North China vortex(Fig. 9b),the shear lines near the Yangtze River, and the eastward-movingvortices along the shear line(Figs. 9a,9c,9d). However,from the second to the fourth events,the simulated strong wind is located on the south and eastside of the observ ations; correspondinglY,the maximum water vapor flux is also more southward and eastward. This is likelYto cause the simulated heavyrainfall to occur to the south and east of the observ ation in southern China(Figs. 4b-d vs. Figs. 4f-h).Overall,the CTL successfullYreproduces the accumulated rainfall during the entire period and in each precipitation event. The CTL also reproduces the temporal evolution of the circulation and weather systemsas well as distributions of variables such as water vapor flux at 850 hPa,relative vorticitYat 500 hPa, and wind divergence at 200 hPa. Thus,bYcomparing theresults from CTL and SEN,we can discuss the influence of the TP's heating effects on the persistent heavyrainfall in southern China during June 2010.
 |
| Fig. 8. 700-hPa geopotential height(black solid curves; dagpm),wind barbs, and water vapor °ux(blue shading; m gkg-1s-1)during the fourth precipitation event at(a,e)0600 UTC 23 June,(b,f)1800 UTC 23 June,(c,g)0600 UTC24 June, and (d,h)1800 UTC 24 June 2010 from(a-d)ERA-interim and (e-h)CTL. GraYlines denote coastal lines,the YelloWRiver, and the Yangtze River. |
 |
| Fig. 9. As in Figs. 5e-h,but for(a-d)CTL and (e-h)SEN. |
There is a significant difference in the distribution of accumulated rainfall between CTL and SEN(Figs. 3b and 3c). In CTL(Fig. 3b),the heavYrainfall(> 500 mm)area is obviouslYlarger,with also strongercenters than that in SEN(Fig. 3c). The difference inprecipitation(Fig. 3d) and related significance test(Fig. 3e)shows as well that the rainfall in the heavyprecipitation center is stronger in CTL.
 |
| Fig. 10. Difference of surface sensible heat flux between the control and sensitivitYexperiments(CTL-SEN;Wm-2)averaged during 14-24 June 2010. Purple linesdenote the 1- and 3-km topographYcontours; black linesdenote the coastline,the Yangtze River, and the YellowRiver. |
Comparing the averaged surface sensible heat fluxin the two experiments during 14-24 June(figure omitted),we find that except for the western TP,the sensible heat flux is largelYpositive with its heating center over the central TP in CTL. However,in SEN,most of the plateau displays negative sensible heat flux. The difference between the two experiments(Fig. 10)shows that in CTL,the TP's heating effect significantlYincreases the surface sensible heat flux(byapproximatelY40-80 Wm-2),but the sensible heatflux decreases(bYapproximatelY1-20 Wm-2)ineastern China. Changes in the surface sensible heat flux over the TP and its surrounding areas maYhavechanged the atmospheric temperature,further alteredthe upper- and low-level circulations through thermalwind adjustment, and changed the water vapor flux,convergence and divergence as well as the precipitationin southern China.
At 500 hPa,the difference of temperature averaged during 14-24 June 2010(Fig. 11a)shows that theTP's heating effect increases the atmosphere temperature over the TP and its surrounding areas. The maximum temperature center is located near the centralTP or slightlYwest. According to the theorYof thermal wind,the temperature anomalYdistribution willstrengthen the upper-level anticyclone and the lowlevel cyclone. The difference between CTL and SENis consistent with the above theorY.
 |
| Fig. 11. Differences between the control and sensitivitYexperiments(CTL-SEN)averaged for 14-24 June 2010 of(a)temperature(solid red lines denote positive values, and solid blue lines denote negative values; ℃) and relative vorticity(color shading; 10-5s-1)at 500 hPa,(b)geopotential height(shading; dagpm) and wind(barbs)at 200 hPa. Purplelines denote the 3-km topographYcontour; graYlines denote the coastline,the Yangtze River, and the YelloWRiver. |
The difference in geopotential height and wind at200 hPa(Fig. 11b)shows that in CTL the northerlysignificantlYstrengthens over the central and easternTP,with an anticyclonic circulation over its west(thecenter located in northwestern TP) and a cyclonic circulation over its east. Moreover,in CTL,the geopotential height over the TP,BaYof Bengal, and East China coast is comparativelYhigher,but is lower inthe region between the east of the plateau and theeast coast. In CTL,the South Asian high at 200hPa is much stronger,larger, and more westward, and the corresponding high pressure ridge and trough ineastern China are also intensified. The northerlYinfront of the ridge is strengthened,leading to strongercold air intrusion southward. SimilarlY,the thermalwind induced bYthe TP's temperature increase willalso lead to enhanced low-level cyclonic wind aroundthe surrounding areas of the TP . The differences ingeopotential height and wind at 850 hPa(Fig. 12a)shoWthat in CTL the easterlYto the north of the TP and the southwesterlYto its south are both strengthened,which forms a cyclonic circulation. Moreover,in CTL,the geopotential height over the mid-lowerreaches of Yangtze River and to its south is significantlYlower than in SEN and is also accompaniedbYa cyclonic circulation anomalYthat corresponds tostronger southwest flows over the South China coast(conducive to water vapor transport to South China).The northerlYover the middle Yangtze River is alsoenhanced(i.e.,drY and cold air southward intrusionenhanced). Meanwhile,in CTL,the column integratedmoisture convergence above South China and Jiangnan coast increases(Fig. 12b),consistent with theenhanced precipitation in the heavYrainfall area.
 |
| Fig. 12. Di®erences between the control and sensitivitYexperiments(CTL-SEN)averaged during 14-24 June 2010of(a)geopotential height(shading; dagpm) and wind(barbs)at 850 hPa,(b)column water vapor flux convergence(shading; 10-6kg m-2s-1) and temperature at 850 hPa(red solid lines denote positive values and blue solid linesdenote negative values; ℃). GraYlines denote the 3-km topographYcontour,coastline,Yangtze River,YelloWRiver, and Huai River. |
In addition,the difference of relative vorticitYat500 hPa(Fig. 11a)shows that in CTL the positiverelative vorticitYzone from the central TP to the midlower Yangtze River is significantlYstronger than inSEN. The time-longitude distribution of the relative vorticitYaveraged between 25° and 35°N at 500 hPa(Figs. 7b and 7c)clearlYshows that during 14-25 Junethe intensitYof the eastward-moving positive vorticityin CTL graduallYgrows stronger than that in SENwith time.
BYcomparing the wind,geopotential height, and water vapor flux at 850 hPa between the two experiments at selected times of the four events(Fig. 9),wefind that in the first and second events(Figs. 9a,9b vs.9e,9f),the two experiments are relativelYconsistent,but in the third and fourth events(Figs. 9c,9d vs.9g,9h),there is a significant difference. In CTL,lowlevel vortices develop intenselYwhile there is almostno vortex formation in SEN. Consistent with previous studies,this studYconfirms that the TP's heatingeffect is in favor of the generation,development, and eastward-movement of the vortices over the TP and itsdownstream. In addition,this studYconfirms that thefeedback of latent heat can intensifYthe vortices and provide a favorable lifting mechanism for the verticalmovement of the air downstream.
T o illustrate the influence of the TP's heating effect on the horizontal and vertical circulation,we further analyze the vertical cross-section at 25°N,115°Ewhere the heavYrainfall center is located. The vertical circulations at 25°N in CTL and SEN(Figs.13a and 13b)are almost the same. The maximumsouthwest wind is located over 110°-120°E,i.e.,theheavYrainfall area,with strong upward motion. However,in CTL,the southerlies(Fig. 13d) and westerlies(Fig. 13c)as well as the upward motion are strongerthan in SEN. It is obvious that the TP's heating effect in the mid troposphere leads to the geostrophicwind changing with height on the south side of TP(Fig. 13c). The low-level westerlies and upper-leveleasterlies are strengthened,which is consistent withthe wind difference at 850 hPa(Fig. 12a) and 200hPa(Fig. 11b)on the south side of the TP . The differences in the vertical circulation,north wind, and temperature(Fig. 14c)between the two experimentsshoWthat in CTL the warm moist southerlYsouth of25°N is relativelYlarger. In addition,the cold and drynortherlYto the north and the upward motion overthe heavYrainfall area are much stronger in CTL,corresponding to the more intense rainfall in the precipitation center. Overall,the TP's heating effect leadsto significant enhancement of the southwesterlies overSoutheast China, and results in strengthening of thenortherlies from higher latitudes along the eastern TP and the upward motion over southern China,whichenhances precipitation over southern China.
 |
| Fig. 13.(a,b)Meridional wind speed(shading; m s-1) and circulation(vectors)along 25°N averaged for 14-24 June2010 in(a)CTL and (b)SEN.(c)Differences in the zonal wind(CTL-SEN; shading; m s-1) and the vertical circulation(vectors).(d)Differences in the meridional wind(CTL-SEN; shading; m s-1) and temperature(red and black solid linesdenote positive and negative values,respectively; ℃). |
 |
| Fig. 14.(a,b)Meridional wind speed(shading; m s-1) and vertical circulation(vectors)along 115°E averaged for14-24 June 2010 in(a)CTL and (b)SEN.(c)Di®erences in the meridional wind(CTL-SEN; shading; m s-1),verticalcirculation(vectors), and temperature(red and black solid lines denote positive and negative values,respectively; ℃). |
Previous studies shoWthat the TP's heating effectin summer is important to the low-level cyclonic circulation and upper-level anticyclonic circulation overthe TP and its surrounding areas(Wu and Liu, 2000;Wu et al., 2002). When the rainfall in South Chinais abnormallYlarge,anticyclonic and cyclonic circulation anomalies usuallYappear over the northwest ofthe TP and over the eastern TP to eastern China,respectivelY(Yang,2011). In this studY,the changes in circulation are consistent with previous studies. Moreover,we carrYout an ensemble of high-resolutionnumerical simulations and compare the precipitationprocesses in two sets of experiments to identitYtherole of the TP's heating effect. We find that the lowlevel vortices start to change significantlY5 to 6 daysfrom the beginning of the simulations. In the third and fourth precipitation events in CTL,vortices are generated near the Sichuan basin and develop eastward,but in SEN almost no vortices are found. This illustrates that the TP's heating effect favors the generation and development of vortices. We clearlYdemonstrate the main weather systems of each precipitationevent and their evolution during the persistent rainfallfrom a synoptic perspective,especiallYthe generation and eastward movement of the vortices. This revealsthe influence of the TP's heating effect,which is different from the previous climate studies.
7. Conclusions and discussion
In this studY,we first compare June 2008 and June 2010,the two strongest persistent rainfall yearsin southern China in recent years. We analyze thesimilarities and differences in rainfall distribution and large-scale circulations related to the persistent rainfall. F urther focus is placed on four heavYprecipitation events during 14-24 June 2010,through analyzing the rainfall distribution and the evolution ofmain weather systems in each event from the synopticperspective. Then,we carrYout an ensemble of fivemember convection-permitting simulations using theWRF model. The CTL experiment reproduces the observed surface precipitation,atmospheric circulation, and the main features of the weather systems. An ensemble sensitivitYexperiment(also with five members)is carried out with the surface albedo over the TP and its south slope artificiallYchanged to one to investigate the influence of the TP's heating effect onthe persistent heavYrainfall in southern China duringJune 2010. Main results are summarized as follows.
(1)During June 2008,the north of the TP and eastern China were in control of the ridge and troughat 500 hPa,respectivelY. The trough and ridge werestronger than normal with intensified cold and warmair activities. The heaviest rainfall was mainlYconcentrated in Guangdong Province and Guangxi Region inSouth China. June 2010 was characterized bYfrequentoccurrences of low-value systems in the middle and loWtroposphere from the TP to the lower reaches ofYangtze River. Compared with June 2008,June 2010had a significantlYintensified western Pacific subtropical high which led to more northward located low-levelanomalous wind convergence and rainb and s,with theheaviest rainfall centers in Guangdong,Guangxi,F ujian,Jiangxi, and Zhejiang.
(2)According to the rainfall distribution and theevolution of the atmosphere circulation,we divide14-24 June into four episodes: 14-15,16-18,19-21, and 22-24 June 2010. The accumulated precipitation of each of the four episodes displayed a ribbonor patchYdistribution. In the first event,the precipitation was mainlYlocated in South China,whilein the second,third, and fourth events the precipitation mainlYoccurred in Jiangnan and northern SouthChina. In the four events,water vapor came fromthe South China Sea and the BaYof Bengal, and thepositive relative vorticitYpropagated eastward fromthe eastern TP to the East China Sea. These characteristics corresponded to the frequent occurrencesof the eastward-moving shalloWtroughs at 500 hPa,the shear lines, and the eastward-moving vortices inthe lower troposphere. During the first three precipitation episodes,the South Asian high graduallyintensified,exp and ing and shifting towards the TP; at500 hPa,the mid- and high-latitude trough and ridgewere strengthened and the WPSH remained strong;in the mid- and lower troposphere,the warm and coldair flows converged over the mid-lower Yangtze River and in northern South China. In the fourth event,theSouth Asian high substantiallYweakened and shrank,the mid-level trough and ridge moved eastward,theWPSH retreated southeastward, and the precipitationgraduallYdissipated.
(3)An ensemble of five-member convectionpermitting simulations(CTL)with high resolution(4km)is carried out. The CTL successfullYreproducesthe accumulated rainfall during the entire period and in each precipitation episode. The area and intensityof the precipitation over South China are consistentwith the observ ations,except that in CTL the simulated heavYrainfall center was slightlYsoutheastward.The CTL also reproduces the upper-,mid-, and lowlevel circulations and the relev ant weather systems,including the location,intensitY, and evolution of theSouth Asian high,the mid- and high-latitude trough and ridge,the WPSH,the low-level shear line and vortices. The CTL also reproduces the observed distributions of variables such as water vapor flux,relativevorticitY, and wind divergence.
(4)The TP's heating effect(i.e.,strong surfacesensible heating)changes the temperature distributions of the atmosphere over the plateau and itssurroundings. The thermal wind adjustment consequentlYchanges atmospheric circulations and properties of synoptic systems from the lower to uppertroposphere. At 200 hPa,northerlies over the central and eastern TP are strengthened,with anticyclonic and cyclonic anomalies formed over the western and eastern plateau,respectively; the South Asianhigh intensifies and is located relativelYwestward.At 500 hPa,the positive vorticitYpropagations fromthe plateau to the downstream are enhanced signifi-cantlY,as well as the ridge and trough. The cyclonicwind anomalies over the middle of the Yangtze RiversignificantlYintensifYthe southwesterlYflows alongthe northwest side of the subtropical high. At 850hPa,the low-pressure vortices stronglYdevelop and move eastward. The southwesterlYlow-level jet tothe south of the vortices is intensified,transportingwarm and moist air toward South China. Meanwhile,the southward cold air intrusion from higher latitudesis also strengthened,cold and warm air convergenceis enhanced, and thus the moisture convergence and upward motion in South China are enhanced. Thesechanges increase the precipitation in South China.
It should be noted that this studYfocuses onthe persistent heavYrainfall in southern China duringJune 2010. In June of 2005,2008, and several yearsof the 1990s,persistent heavYrainfall also occurred.All of the events need to be analyzed and discussedindividuallYto determine whether our conclusions areof universal significance. Moreover,the results of ourstudYshoWthat the influence of the TP's heatingeffect on persistent heavYrainfall in southern Chinaare mediated via changes in the upper- and low-levelatmosphere circulation,main weather systems, and the generation and development of the low-level vortices over the east of the plateau(near the Sichuanbasin). The generation and development mechanismsof the low-level vortices could be further investigated.In addition,the heating effects of the main bodY and the southern slope of the TP(SSP)are investigatedtogether in this studY. More sensitivitYexperimentscould be designed to investigate the heating effectsover different sub-regions of the TP,such as the mainbodYof TP,the SSP,the north slope,the western and eastern TP,on the persistent heavYrainfall in southern China, and the associated physical mechanisms aswell.
Acknowledgments: The authors thank Dr.Zheng Yongjun at the Chinese AcademYof Meteorological Sciences(CAMS) and Dr. Rao Jian at theInstitute of Atmospheric Physics,Chinese AcademYofSciences for help running the WRF model. The ERA-interim data were downloaded from the ECMWF web-site(http://data-portal.ecmwf.int/).
| [1] | Boos, W. R., and Z. M. Kuang, 2010: Dominant control of the South Asian monsoon by orographic insula-tion versus plateau heating. Nature, 463, 218-223. |
| [2] | Chen Bomin, Qian Zhengan, and Zhang Lisheng, 1996: Numerical simulation of the formation and develop-ment of vortices over the Qinghai-Xizang Plateau in summer. Chinese J. Atmos. Sci., 20, 491-502. (in Chinese) |
| [3] | Chien, F. C., and B. J. D. Jou, 2004: MM5 ensem-ble mean precipitation forecasts in the Taiwan area for three early summer convective (Meiyu) seasons. Wea. Forecasting, 19, 735-750. |
| [4] | Coniglio, M. C., J. Correia, P. T. Marsh, et al., 2013: Verification of convection-allowing WRF model fore-casts of the planetary boundary layer using sounding observations. Wea. Forecasting, 28, 842-862. |
| [5] | Dee, D. P., S. M. Uppala, A. J. Simmons, et al., 2011: The ERA-Interim reanalysis: Configuration and perfor-mance of the data assimilation system. Quart. J. Roy. Meteor. Soc., 137, 553-597. |
| [6] | Du, J., S. L. Mullen, and F. Sanders, 1997: Short-range ensemble forecasting of quantitative precipitation. Mon. Wea. Rev., 125, 2427-2459. |
| [7] | Duan, A. M., M. R. Wang, Y. H. Lei, et al., 2012: Trends in summer rainfall over China associated with the Tibetan Plateau sensible heat source during 1980-2008. J. Climate, 26, 261-275. |
| [8] | Dudhia, J., 1989: Numerical study of convection ob-served during the winter monsoon experiment using a mesoscale two-dimensional model. J. Atmos. Sci., 46, 3077-3107. |
| [9] | Flohn, H., 1957: Large-scale aspects of the “summer monsoon” in South and East Asia. J. Meteor. Soc. Japan, 75, 180-186. |
| [10] | Grimit, E. P., and C. F. Mass, 2002: Initial results of a mesoscale short-range ensemble forecasting system over the Pacific Northwest. Wea. Forecasting, 17, 192-205. |
| [11] | Hahnd, D. G., and S. Manabe, 1975: The role of moun-tains in the South Asian monsoon circulation. J. Atmos. Sci., 32, 1515-1541. |
| [12] | He, H. Y., J. W. Mcginnis, Z. Song, et al., 1987: Onset of the Asian summer monsoon in 1979 and the effect of the Tibetan Plateau. Mon. Wea. Rev., 115, 1966-1995. |
| [13] | He Yu and Li Guoping, 2013: Numerical experiments on influence of Tibetan Plateau on persistent heavy rain in South China. Chinese J. Atmos. Sci., 37, 933-944. (in Chinese) |
| [14] | Huang, R. H., 1985: Numerical simulation of three-dimensional teleconnections in the summer circula-tion over the Northern Hemisphere. Adv. Atmos. Sci., 2, 81-92. |
| [15] | Joyce, R. J., J. E. Janowiak, P. A. Arkin, et al., 2004: CMORPH: A method that produces global precip-itation estimates from passive microwave and in-frared data at high spatial and temporal resolution. J. Hydrometeor., 5, 487-503. |
| [16] | Kain, J. S., S. J. Weiss, D. R. Bright, et al., 2008: Some practical considerations regarding horizontal resolu-tion in the first generation of operational convection-allowing NWP. Wea. Forecasting, 23, 931-952. |
| [17] | Kitoh, A., 2004: Effects of mountain uplift on East Asian summer climate investigated by a coupled atmosphere-ocean GCM. J. Climate, 17, 783-802. |
| [18] | Kong Qi, 2010: Analysis of atmospheric circulation and weather in June 2010. Meteor. Mon., 36, 120-125. (in Chinese) |
| [19] | Lean, H. W., P. A. Clark, M. Dixon, et al., 2008: Charac-teristics of high-resolution versions of the met office unified model for forecasting convection over the United Kingdom. Mon. Wea. Rev., 136, 3408-3424. |
| [20] | Li Fei and Duan Anmin, 2011: Variation of the Tibetan Plateau summer monsoon and its effect on the rain-fall and the circulation in Asia—A case study in 2008. Chinese J. Atmos. Sci., 35, 694-706. (in Chinese) |
| [21] | Li Guoping, Zhao Bangjie, and Yang Jinqing, 2002: A dy-namical study of the role of surface sensible heating in the structure and intensification of the Tibetan Plateau vortices. Chinese J. Atmos. Sci., 26, 519-525. (in Chinese) |
| [22] | Li and Liu Hongwu, 2006: A dynamical study of the role of surface heating on the Tibetan Plateau vor-tices. J. Trop. Meteor., 22, 632-637. (in Chinese) |
| [23] | Li Weiping, Wu Guoxiong, and Liu Hui, 2000: A numeri-cal simulation study of the impacts of surface albedo on the summer time North African subtropical high. Acta Meteor. Sinica, 58, 26-38. (in Chinese) |
| [24] | Liang Xiaoyun, Liu Yimin, and Wu Guoxiong, 2005: The impact of Qinghai-Xizang Plateau uplift on Asian general circulation in spring and summer. Plateau Meteor., 24, 837-845. (in Chinese) |
| [25] | Livneh, B., P. J. Restrepo, and D. P. Lettenmaier, 2011: Development of a unified land model for prediction of surface hydrology and land-atmosphere interac-tions. J. Hydrometeor., 12, 1299-1320. |
| [26] | Luo Siwei, Yang Yang, and Lu Shihua, 1991: Diagnostic analyses of a summer vortex over Qinghai-Xizang Plateau for 29-30 June 1979. Plateau Meteor., 10, 1-11. (in Chinese) |
| [27] | Luo and Yang Yang, 1992: A case study on numerical simulation of summer vortex over Qinghai-Xizang (Tibetan) Plateau. Plateau Meteor., 11, 39-48. (in Chinese) |
| [28] | Mlawer, E. J., S. J. Taubman, P. D. Brown, et al., 1997: Radiative transfer for inhomogeneous atmosphere: RRTM, a validated correlated-k model for the long-wave. J. Geophys. Res., 102, 16663-16682. |
| [29] | Morrison, H., G. Thompson, and V. Tatarskii, 2009: Im-pact of cloud microphysics on the development of trailing stratiform precipitation in a simulated squall line: Comparison of one-and two-moment schemes. Mon. Wea. Rev., 137, 991-1007. |
| [30] | Schwartz, C. S., J. S. Kain, S. J. Weiss, et al., 2009: Next-day convection-allowing WRF model guidance: A second look at 2-km versus 4-km grid spacing. Mon. Wea. Rev., 137, 3351-3372. |
| [31] | Skamarock, W. C., J. B. Klemp, J. Dudhia, et al., 2008: A description of the advanced research WRF version 3. NCAR Tech. Note NCAR/TN-4751STR, 113 pp. |
| [32] | Stensrud, D. J., and N. Yussouf, 2003: Short-range en-semble predictions of 2-m temperature and dew point temperature over New England. Mon. Wea. Rev., 131, 2510-2524. |
| [33] | Wan, R. J., and G. X. Wu, 2007: Mechanism of the spring persistent rains over southeastern China. Sci. China (Ser. D), 50, 130-144. |
| [34] | —-, B. K. Zhao, and G. X. Wu, 2009: New evidences on the climatic causes of the formation of the spring persistent rains over southeastern China. Adv. At-mos. Sci., 26, 1081-1087. |
| [35] | Wang, B., 1987: The development mechanism for Ti-betan Plateau warm vortices. J. Atmos. Sci., 44, 2978-2994. |
| [36] | Wang, Z. Q., A. M. Duan, and G. X. Wu, 2013: Time-lagged impact of spring sensible heat over the Ti-betan Plateau on the summer rainfall anomaly in East China: Case studies using the WRF model. Climate Dyn., 40, doi: 10.1007/s00382-013-1800-2. |
| [37] | Wang Xiaofang, Huang Huali, and Huang Zhiyong, 2011: The causation analysis of persistent heavy rain over southern China during May-June 2010. Meteor. Mon., 37, 1206-1215. (in Chinese) |
| [38] | Wu Guoxiong and Liu Yimin, 2000: Thermal adap-tation, overshooting, dispersion, and subtropical anticyclone. Part I: Thermal adaptation and over-shooting. Chinese J. Atmos. Sci., 24, 433-446. (in Chinese) |
| [39] | —-, Liu Xin, Zhang Qiong, et al., 2002: Progresses in the study of the climate impacts of the elevated heating over the Tibetan Plateau. Climatic Environ. Res., 7, 184-201. (in Chinese) |
| [40] | —-, —-, Wang Tongwei, et al., 2006: The influence of mechanical and thermal forcing by the Tibetan Plateau on Asian climate. J. Hydrometeor.-Special Section, 8, 770-789. |
| [41] | Xu, X. D., C. G. Lu, X. H. Shi, et al., 2010: Large-scale topography of China: A factor for the seasonal pro-gression of the Meiyu rainband? J. Geophys. Res., 115, D02110, doi: 10.1029/2009JD012444. |
| [42] | Yang Hui, 2011: Characteristics of precipitation in South China in June and atmospheric circulation analyses. Quaternary Research, 31, 81-87. (in Chinese) |
| [43] | Ye Duzheng and Gu Zhenchao, 1955: The influence of Tibetan Plateau on East Asian atmospheric circula-tion and the weather of China. Chinese Sci. Bull., 4, 29-33. (in Chinese) |
| [44] | —-and Gao Youxi, 1979: The Tibetan Plateau Meteo-rology. Science Press, Beijing, 278 pp. (in Chinese) |
| [45] | Yuan, F., W. Chen, and W. Zhou, 2012: Analysis of the role played by circulation in the persistent precipi-tation over South China in June 2010. Adv. Atmos. Sci., 29, 769-781. |
| [46] | Zhang Jijia, Xu Xiangde, and Miao Junfeng, 1995: A numerical experiment of the effect of anomalous thermal forcing of Tibetan Plateau ground surface on the formation of persistent heavy rain in summer over the Yangtze-Huaihe basin. Chinese J. Atmos. Sci., 19, 270-276. (in Chinese) |