 2014, Vol. 28
The Chinese Meteorological Society
Article Information
- LI Xiaolan, ZHANG Hongsheng. 2014.
- Soil Moisture Effects on Sand Saltation and Dust Emission Observed over the Horqin Sandy Land Area in China
- J. Meteor. Res., 28(3): 444-452
- http://dx.doi.org/10.1007/s13351-014-3053-3
Article History
- Received 2013-7-19;
- in final form 2014-3-27


Dust emission generated by wind erosion usuallyoccurs in many arid,semi-arid, and agricultural areasaround the world(Shao,2008). Mineral aerosols participatein many physical,chemical, and biogeologicalprocesses of the earth system(Shao et al., 2011). Dustparticles with diameters less than 20 μm(PM20)canremain suspended in the atmosphere for a long periodof time and be transported over a long distance.These particles play an important role in the climatesystem through their direct and indirect radiation effects(Sokolik and Toon, 1996; Rosenfeld et al., 2001;Yin et al., 2002; Ahn et al., 2007).
Saltation bombardment is well known as a majormechanism for dust emission(Gillette,1977; Gomes et al., 1990; Shao et al., 1993; Houser and Nickling, 2001;Sow et al., 2009). Dust emission flux is calculated fromstreamwise saltation flux in most dust emission models(e.g.,Shao et al., 1993; Marticorena and Bergametti, 1995; Alfaro and Gomes, 2001). The processesof s and saltation and dust emission are influenced bya great number of factors,such as atmospheric conditions,soil properties,l and surface characteristics, and so on. The threshold friction velocity,u*t,defined asthe minimum friction velocity(u*)to initiate the motionof surface particles,is determined by these factors(Belly,1964; Gillette et al., 1980,2004). Soil moistureis among the most critical factors for both s and saltation and dust emission processes as it modules theinter-particle and surface-particle cohesive forces actingon the dust particles(Ishizuka et al., 2008). Mostprevious studies indicate that wet soil conditions tendto increase the u*t values, and hence suppress salta-tion and dust emission(Chepil,1945; Ishizuka et al., 2005,2008,2009; Kimura et al., 2009; Sow et al., 2009). However,the effects of soil moisture on saltation and dust emission become very complex undernatural soil conditions. Park et al.(2010)proposedthat soil moisture has little effect on dust concentration,because the residence time of moisture in surfacesoil is relatively short in dust source regions. Li and Zhang(2012)also found that soil moisture contentat 5-cm depth did not show any obvious impacton the seasonal variation of dust concentration overthe Horqin S and y L and area of China from December2010 to November 2011,during which the soil moisturecontent ranged from 0.020 to 0.150 v v-1. Moreattention should be paid to this controversial problemby carrying on relative field observations.
In this study,observational data obtained froma s and storm monitoring station at the Horqin S and yL and area in China are used to comparatively investigatethe characteristics of s and saltation and dustemission processes during three dust events in 2010under different soil moisture conditions.2. Data and method
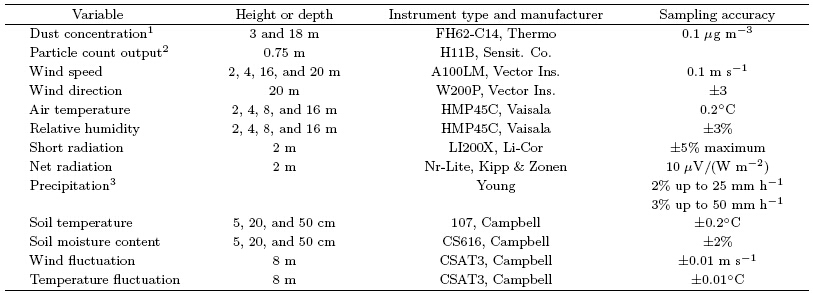
The experimental site is located at the HorqinS and y L and area in Inner Mongolia(42◦55'30.3''N,120◦41'1.9''E)(Fig. 1). The instruments are installedon a 20-m high monitoring tower. The micrometeorologicaldata include wind speed at 2-,4-,16-, and 20-m heights,air temperature and relative humidityat 2-,4-,8-, and 16-m heights,wind direction at20-m height,soil moisture content and temperature at5-,20-, and 50-cm depths, and precipitation rate atground surface. Dust(PM10)mass concentration at3- and 18-m heights and saltation activities of s and particles are simultaneously measured at 10-min sampleintervals. In addition,the dust mass concentrationof particles at different sizes(0.1 ≤ d ≤ 20 μm)at 3-mheight is measured by a 10-stage quartz crystal microbalance(QCM)cascade impactor(PC-2HX,CaliforniaMeasurements,Inc.). The size cutoff diametersfor each stage are 10,7,4,2.5,1.4,0.7,0.45,0.3,0.2, and 0.1 μm,respectively. Table 1 lists the instrument specifications and placements installed over the Horqinstation.
 |
| Fig. 1. Geographical location of the Horqin station. |
The profile data of wind speed and air temperatureare used to calculate friction velocity u*,basedon Monin-Obukhov similarity theory(Garratt,1992;Zhu and Zhang, 2010).
where κ(= 0.40)is von K´arm´an’s constant,U is thewind speed,θ is the potential temperature,z0 is theroughness length,L is the Obukhov length, and ψm and ψH are the surface layer stability correction functionsfor momentum and heat,respectively. Variableza is the observational height of the quantity a. Here,zu = 4 m,zθ1 = 2 m, and zθ2 = 4 m.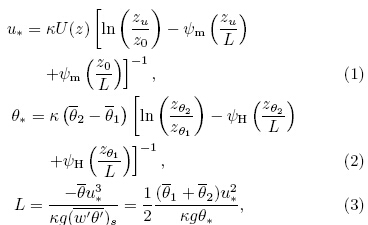
The value of z0 can be theoretically estimated byfitting wind speed profiles under neutral atmosphericconditions and set to the measure height when windspeed equals zero. Considering it is rare to observeneutral conditions,z0 can be computed by the leastsquarefitting method for wind speed profiles undernear-neural conditions,which are defined with the followingcriteria:(1)the wind speed at the 4-m heightis > 8 m s−1(Ishizuka et al., 2008);(2)|ΔT| between 2- and 4-m heights is < 0.2◦C; and (3)the wind directionsrange between 225◦ and 360◦,which prevailfor most dust events over the Horqin station. Here,z0 is estimated to be 0.75 mm. This value is reasonablefor a bare s and y field with little vegetation(Xian et al., 2002). The values of u*,θ*, and L are theniteratively calculated for every 10 min based on Eqs.(1)–(3)(Zhang et al., 2008).
 | ||
| 1 Dust mass concentration was obtained from a beta gauge operating at a flow rate of 1000 L h−1.2 H11B was used to record the saltation activities of particles with a diameter larger than 50 μm.3 Precipitation was measured by a tipping-bucket rain gauge with a resolution of 0.1 mm. | ||
Dust emission flux,F,can be computed by usingdust concentration gradient measurements with an assumptionthat the particles with aerodynamic diameters< 10 μm are light enough to follow air movementsperfectly(Gillette et al., 1972; Zhang et al., 2008; Sow et al., 2009).
where C is the dust(PM10)mass concentration,zc1 =3 m, and zc2 = 18 m. Variable ψc equals to ψH thatis the same as that in Eq.(2), and other variables arethe same as those in Eq.(1).3. Results3.1 Local dust emission events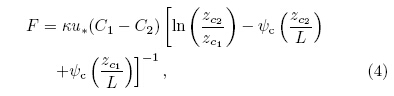
Figure 2 shows the variations of daily precipitationrate and soil moisture content(SMC)at 5-cm depth in May 2010. The surface soil was dry(SMC <0.075 v v-1)before 4 May. A precipitation event withthe maximum precipitation rate occurred on 5 May, and it was followed by an abrupt increase up to 0.112v v-1 in SMC. The values of SMC decreased graduallyduring the next few days,mainly due to the evaporationof soil moisture. The precipitation event on 18May contributed to the wet soil conditions on 19 May.Figure 2 indicates that two dust events took place inMay 2010: a severe dust storm(Event 1)under drysoil conditions(0.074 < SMC < 0.075 v v-1)on 2 May, and a less severe dust storm(Event 2)under wet soilconditions(0.090 < SMC < 0.094 v v-1)on 19 May.Another dust storm event(Event 3)on 27 November2010 was also selected as a case under very dry soilconditions(0.031 < SMC < 0.033 v v-1)for furtheranalysis.
Figure 3 shows the variations of dust concentrationat 3-m height and wind speed at 4-m height in thethree dust events. Before the breakout of the severedust storm on 2 May,the background dust concentrationwas smaller than 200 μg m-3. As the windspeed increased,the dust concentration increased at0800 BT(Beijing Time) and it reached the maximumof 953.1 μg m-3 at 0950 BT. After the wind speeddecreased,the dust concentration was reduced to itsbackground concentration at 1700 BT(Fig. 3a). Theother two dust events showed similar variations for local dust events that dust concentration increases(decreases)with the increase(decrease)of wind speed(Li and Zhang, 2011). Event 2 continued from 1000 to1600 BT on 19 May,with the maximum dust concentrationreaching 312.3 μg m-3 at 1440 BT(Fig. 3b).Event 3 lasted for 10 h,from 1200 to 2200 BT on 27November, and its first peak in dust concentration was452.1 μg m-3 at 1340 BT(Fig. 3c).
 |
| Fig. 2. Variations of daily precipitation rate and soil moisture content at 5-cm depth in May 2010. |
 |
| Fig. 3. Temporal variations of dust concentration at 3-m height(solid line) and wind speed at 4-m height(dashed line)in three dust events in 2010 under different soil conditions.(a)Event 1 on 2 May,(b)Event 2 on 19 May, and (c)Event3 on 27 November 2010. |
The start of a dust-emission period is defined asthe time when dust concentration begins to contin uously increase from its background level,while theend of the period is defined by the time of maximumdust concentration. Thus,the dust-emission period is0700–1000 BT in Event 1,1000–1440 BT in Event 2, and 1200–1340 BT in Event 3.
Figure 4 shows the saltation activities of s and particlesrepresented by the variations of the responsenumber(per 10 min)of a saltation detector(H11B,Sensit. Co.,USA) and the dust emission flux for thethree dust events. Note that the negative F values relatedto dust advection/deposition were ignored,e.g.,1200–1300 and 1700–1900 BT in Event 1(Fig. 4a).The negative F did not influence the dust-emissionperiods.
The saltation activities are found to be consistentwith the dust emission flux for the three dustevents. This supports the well-known conclusion thatthe saltation bombardment is one of the main mechanismsfor dust emission. However,it is interesting tonotice that although the dust emission flux is basicallyproportional to the saltation activities in an individualdust event,the proportionality between them isdifferent for different events,because it has changed and depends on soil moisture. For instance,the Sensitresponse numbers were less than 5 and the magnitudeof dust flux was about 30 μg m-2 s−1 in the dustemissionperiods of Events 1 and 3(Figs. 4a and 4c);while for Event 2,the saltation activities were muchstronger but the dust flux was smaller(F < 18 μgm-2 s−1). F was very small at the beginning period(0830–1400 BT)of Event 2 and increased rapidly inthe period of 1400–1500 BT after many saltating particlescontinuously collided with the surface(Fig. 4b),which is related to the soil crust at the surface underwet soil conditions.3.2 Meteorological conditions
Figure 5 displays the variations of wind direction and specific humidity for the three dust events.The wind direction changed suddenly from southwest(about 225◦)to northwest(about 325◦)at the beginningof the dust-emission period in Event 1,correspondingto the collapse of the inversion layer,whileit varied slowly in Event 2, and it had a small changeat 1200 BT in Event 3. However,the northwest windprevailed during the dust-emission periods of all the three dust events(Fig. 5a).
 |
| Fig. 4. As in Fig. 3,but for the response number(solid bar) and dust emission flux(solid line). |
 |
| Fig. 5. Temporal variations of(a)wind direction and (b)specific humidity at 4-m height in the three dust events underdifferent soil conditions. |
The specific humidity,q,was largest(q > 6.0 gkg-1)in Event 2 mainly due to the rainfall event. Thevalues of q were small in Event 1(2.0 < q < 4.5 gkg-1), and they were the smallest in Event 3(q < 2.0g kg-1)(Fig. 5b).3.3 Effect of soil moisture on u*t
Figure 6 shows the relationship between the frictionvelocity u* and dust concentration during thedust-emission periods in the three dust events. At thebeginning of the dust-emission period of each event,u*gradually increased but the values of dust concentrationremained small. When u* exceeded u*t,the dustconcentration increased rapidly. Similar to other definitionsused in other studies(Gillette and Ono, 2008;Sow et al., 2009; Yang et al., 2012),u*t is defined asthe value of u* when the dust concentration increasesby 20% for at least half an hour. Here,20% was definedin terms of the background dust concentration(Li and Zhang, 2011). The values of u*t were estimatedto be 0.40,0.50, and 0.34 m s−1 in Events 1,2, and 3,respectively. The dust concentrations were detectedat much lower levels under wet conditions than under dry conditions,despite the fact that higher u*(> 0.6 m s−1)was observed under the wet conditions.This result is consistent with many previous observations(Ishizuka et al., 2008),indicating that soil moisturecan constrain fine particles from being releasedinto the atmosphere.3.4 Effect of soil moisture on s and saltation
Figure 7 shows the variations of u* and the Sensit response number during the dust-emission periods ofthe three dust events. The strong and sustained saltationactivities were observed in Event 2 under wet conditions.For most of time,when u* had the same value,the observed Sensit response numbers were larger inEvent 2 than those in Events 1 and 3. The possiblereason is that dust particles adhered to s and particlesor aggregated together when the soil was wetted bythe rainfall event,which may provide more potentialsaltating particles than under dry conditions. It hasbeen observed that the increasing soil moisture canmove the peak of surface particle size distribution towardsa larger size(e.g.,Mikami et al., 2005; Ishizuka et al., 2008). Unfortunately,the surface s and particledistribution was not measured for these three events.
 |
| Fig. 6. Scatter plot of dust concentration and frictionvelocity u* during the dust-emission periods in the threedust events. |
 |
| Fig. 7. As in Fig. 6,but for friction velocity u* and Sensit response numbers. |
Figure 8 shows the variations of the dust emission flux F with u* in the dust-emission periods for thethree dust events. Although u* was larger under wetconditions,the dust emission was much weaker in contrastto the saltation process. This was probably becausethe binding forces between particles were enhancedunder wet conditions,so the saltation bombardmentwas not strong enough to overcome theseforces. Meanwhile,the higher air humidity in Event 2had a negative impact on dust emission(Ravi et al., 2006).
 |
| Fig. 8. As in Fig. 6,but for friction velocity u* and dustemission flux F. |
Using the micro-meteorological data and dust observations,the effects of soil moisture on the saltation and dust emission processes were studied duringthree local dust events in 2010 over the Horqin S and yL and area,i.e.,Event 1 on 2 May under dry soil conditions,Event 2 on 19 May under wet conditions, and Event 3 on 27 November under very dry conditions.The results confirmed that the increase of soil moisturecan increase the values of u*t and largely suppressdust emission flux. The saltation process wasinfluenced by both wind speed and soil moisture. Thesaltation intensity was stronger under wet soil conditions,which suggests that soil moisture can change thesurface particle size distribution and provide more potentialsaltating particles.
Figure 9 shows the distribution of relative ratio ofdust concentration in each particle size c(Ddi)(10 sizestages of 0.1–0.2,0.2–0.3,0.3–0.45,0.45–0.7,0.7–1.4,1.4–2.5,2.5–4.0,4.0–7.0,7.0–10.0, and 10.0–20.0 μm)to the total PM20 concentration c with particle diameterunder dry and wet soil conditions. With considerationof the dependence of the relative ratio c(Ddi)/con the width of each size bin ΔD or ΔlogD,the widthon a logarithmic coordinates dlogD was divided(nounit). The values of u*(about 0.6 m s−1)are close toeach other for the two QCM samples during the dustemissionperiods. It can be found that the suspendingdust particles in the atmosphere had a significant peakat 4.5–7.0 μm for both events. A secondary peak forfine particles at 0.2–0.3 μm occurred under dry soilconditions,but had not been detected under wet conditions.It indirectly supports that soil moisture canchange the soil particle size distribution.
 |
| Fig. 9. Size distributions of airborne dust concentrationunder dry and wet soil conditions,as measured by theQCM cascade impactor. |
Almost all physical processes related to winderosion are particle-size dependent. Surface soil sizedistribution under natural conditions greatly dependson wind conditions,local soil properties, and l and surfacecharacteristics(Westphal et al., 1987; Gomes et al., 1990; Alfaro et al., 1998) and is more or lessinfluenced by dust particles transported from otherregions(Zhang et al., 1998; Maring et al., 2003). Thethree dust events in this study have similar surfaceroughness length and wind speed,but very differentsoil moisture conditions. Soil moisture is assumed tohave significant impacts on the size distribution ofthe surface soil particles. Our observations providesome facts and reasonable explanations, and moreattentions should be paid to the size-dependent observationsin the future.
| Ahn, H., S.-U. Park, and L. Chang, 2007: Effect of direct radiative forcing of Asian dust on the meteorologi-cal fields in East Asia during an Asian dust event period. J. Appl. Meteor. Climatol., 46, 1655-1681, doi: 10.1175/JAM2551.1. |
| Alfaro, S. C., A. Gaudichet, L. Gomes, et al., 1998: Min-eral aerosol production by wind erosion: Aerosol particle sizes and binding energies. Geophys. Res. Lett., 25, 991-994, doi: 10.1029/98GL00502. |
| Alfaro, S. C., A. Gaudichet, L. Gomes, et al., 1998: Min-eral aerosol production by wind erosion: Aerosol particle sizes and binding energies. Geophys. Res. Lett., 25, 991-994, doi: 10.1029/98GL00502. |
| Belly, P. Y., 1964: Sand Movement by Wind. Tech. Rep. 1, US Army Coastal Engineering Research Center, 80 pp. |
| Chepil, W. S., 1945: Dynamics of wind erosion: 1. Na-ture of movement of soil by wind. Soil Sci., 60, 305-320. |
| Garratt, J. R., 1992: The Atmospheric Boundary Layer. Cambridge University Press, 52-53. |
| Gillette, D. A., 1977: Fine particulate emissions due to wind erosion. Trans. ASAE, 20, 890-897. |
| —-, I. H. Blifford, and C. R. Fenster, 1972: Measure-ments of aerosol size distributions and fluxes of aerosols on land subject to wind erosion. J. Appl. Meteor., 11, 977-987. |
| —-, J. Adams, A. Endo, et al., 1980: Threshold velocities for input of soil particles into the air by desert soils. J. Geophys. Res., 85(C10), 5621-5630. |
|
[11] Garratt, J. R., 1992: The Atmospheric Boundary Layer. Cambridge University Press, 52-53. |
| Gomes, L., G. Bergametti, G. Coudé-Gaussen, et al., 1990: Submicron desert dusts: A sandblasting pro-cess. J. Geophys. Res., 95(D9), 13927-13935, doi: 10.1029/JD095iD09p13927. |
| Houser, C. A., and W. G. Nickling, 2001: The emission and vertical flux of particulate matter < 10 μm from a disturbed clay-crusted surface. Sedimentology, 48, 255-267. |
| Ishizuka, M., M. Mikami, Y. Yamada, et al., 2005: An observational study of soil moisture effects on wind erosion at a gobi site in the Taklimakan Desert. J. Geophys. Res., 110, D18S03, doi: 10.1029/2004JD004709. |
| —-, —-, J. Leys, et al., 2008: Effects of soil moisture and dried raindroplet crust on saltation and dust emission. J. Geophys. Res., 113, D24212, doi: 10.1029/2008JD009955. |
| —-, —-, Y. Yamada, et al., 2009: Threshold friction velocities of saltation sand particles for different soil moisture conditions in the Taklimakan Desert. SOLA, 5, 184-187. |
| Kimura, R., L. Bai, and J. Wang, 2009: Relationship among dust outbreaks, vegetation cover, and sur-face soil water content. Catena, 77, 292-296. |
| Li, X., and H. S. Zhang, 2011: Research on thresh-old friction velocities during dust events over the Gobi Desert in Northwest China. J. Geophys. Res., 116(D20), doi: 10.1029/2010JD015572. |
| —-, and —-, 2012: Seasonal variations in dust con-centration and dust emission observed over Horqin Sandy Land area in China from December 2010 to November 2011. Atmos. Environ., 61, 56-65. |
| Maring, H., D. L. Savoie, M. A. Izaguirre, et al., 2003: Mineral dust aerosol size distribution change during atmospheric transport. J. Geophys. Res., 108(D19), doi: 10.1029/2002JD002536. |
| Marticorena, B., and G. Bergametti, 1995: Modeling the atmospheric dust cycle: 1. Design of a soil-derived dust emission scheme. J. Geophys. Res., 100, 16415-16430, doi: 10.1029/95JD00690. |
| Mikami, M., T. Aoki, M. Ishizuka, et al., 2005: Observa-tion of concentration distribution of desert aerosols in the south of the Taklimakan Desert, China. J. Meteor. Soc. Japan., 83, 31-43. |
| Park, S. -U., M. -S. Park, and Y. Chun, 2010: Asian dust events observed by a 20-m monitoring tower in Mongolia during 2009. Atmos. Environ., 44, 4964-4972. |
| Ravi, S., T. M. Zobeck, T. M. Over, et al., 2006: On the effect of moisture bonding forces in air-dry soils on threshold friction velocity of wind erosion. Sedimen-tology, 53, 597-609. |
| Rosenfeld, D., Y. Rudich, and R. Lahav, 2001: Desert dust suppressing precipitation: A possible desertifi-cation feedback loop. Proc. Natl. Acad. Sci. USA, 98, 5975-5980. |
| Shao, Y., M. R. Raupach, and P. A. Findlater, 1993: The effect of saltation bombardment on the entrainment of dust by wind. J. Geophys. Res., 98, 12719-12726. |
| Shao, Y., M. R. Raupach, and P. A. Findlater, 1993: The effect of saltation bombardment on the entrainment of dust by wind. J. Geophys. Res. 98, 12719-12726. |
| Ishizuka, M., M. Mikami, Y. Yamada, et al., 2005: An observational study of soil moisture effects on wind erosion at a gobi site in the Taklimakan Desert. J. Geophys. Res., 110, D18S03, doi: 10.1029/2004JD004709. |
| —-, M. R. Raupach, and P. A. Findlater, 1993: The effect of saltation bombardment on the entrainment of dust by wind. J. Geophys. Res., 98, 12719-12726. |
| —-, M. Ishizuka, M. Mikami, et al., 2011: Parameteri-zation of size-resolved dust emission and validation with measurements. J. Geophys. Res., 116, D08203, doi: 10.1029/2010JD014527. |
| Sokolik, I. N., and O. B. Toon, 1996: Direct radiative forcing by anthropogenic airborne mineral aerosols. Nature, 381, 681-683. |
| Sow, M., S. C. Alfaro, J. L. Rajot, et al., 2009: Size re-solved dust emission fluxes measured in Niger during 3 dust storms of the AMMA experiment. Atmos. Chem. Phys., 9, 3881-3891. |
| Westphal, D. L., O. B. Toon, and T. N. Carlson, 1987: A two-dimensional numerical investigation of the dynamics and microphysics of Saharan dust storms. J. Geophys. Res., 92(D3), 3027-3049, doi: 10.1029/JD092iD03p03027. |
| Xian, X., T. Wang, Q. Sun, et al., 2002: Field and wind-tunnel studies of aerodynamic roughness length. Bound. -Layer Meteor., 104, 151-163, doi: 10.1023/A:1015527725443. |
| Yang Xinghua, He Qing, M. Ali, et al., 2012: A field experiment on dust emission by wind erosion in the Taklimakan Desert. Acta Meteor. Sinica, 26, 241-249. |
| Yin, Y., S. Wurzler, Z. Levin, et al., 2002: Interactions of mineral dust particles and clouds: Effects on precipitation and cloud optical properties. J. Geo-phys. Res., 107(D23), AAC 19-1-AAC 19-14, doi: 10.1029/2001JD001544. |
|
[37] Zhang, X. Y., R. Arimoto, G. H. Zhu, et al., 1998: Concentration, size-distribution and deposition of mineral aerosol over Chinese desert regions. Tellus B, 50, 317-330. |
| Zhu Hao and Zhang Hongsheng, 2010: Estimation of the threshold friction velocities over various dust storm source areas in Northwest China. Acta Me-teor. Sinica, 24, 548-557. |