The Chinese Meteorological Society
Article Information
- BAI Lina, YU Hui, XU Yinglong, WANG Yuan. 2014.
- Mean Structure of Tropical Cyclones Making Landfall in Mainland China
- J. Meteor. Res., 28(3): 407-419
- http://dx.doi.org/10.1007/s13351-014-3060-4
Article History
- Received November 13, 2013;
- in final form March 14, 2014
2 National Meteorological Center, CMA, Beijing 100081;
3 Key Laboratory of Mesoscale Severe Weather of Ministry of Education, Nanjing University, Nanjing 211102
The l and fall process of tropical cyclones(TCs)isan important research topic because l and falling TCsusually damage coastal areas through severe winds, intense rainfall, and hazardous storm surges, resultingin numerous casualties and great economic losses. Observationalstudies(Powell, 1987; Powell and Houston, 1998; Blackwell, 2000; Chan et al., 2004) and numericalsimulations(Tuleya et al., 1984; Wong and Chan, 2007; Ramsay et al., 2009)have shown that the differentforcing of l and and ocean creates strong asymmetricstructures within TCs. These asymmetries mayaffect not only the intensity and motion of TC(Montgomery and Kallenbach, 1997; Wang, 2002; Wong and Chan, 2006; Szeto and Chan, 2010; Chambers and Li, 2011), but also its precipitation distribution and wind gusts(Powell, 1987; Powell and Houston, 1998). Therefore, underst and ing the kinematic and thermodynamicstructures of TCs that form during the TCl and fall process is vital to improvement of TC forecasting and warning.
Numerous observational studies and numericalsimulations have documented the differences in thewind distributions of TCs before and after l and fall asa result of increased roughness over l and . Tuleya and Kurihara(1978)indicated that the contrasting roughnessbetween l and and sea generates a quasi-steadyconvergence(divergence), along with negative(positive)relative vorticity zones along the coastline wherethe flow is onshore(offshore). Powell(1987)emphasizedthat wind asymmetry is caused by the combinedeffects of roughness variations between l and and sea, environmental flow in the background, and flow translation. Kepert(2006a, b)studied hurricanesGeorges and Mitch and noted the differencesbetween the asymmetric structure produced by thel and fall process and motion-induced asymmetry. Forinstance, the motion-induced asymmetry is discontinuous and much stronger than the asymmetry inducedby l and fall. Wong and Chan(2007)simulated the prel and fall, l and fall, and post-l and fall wind distributionsof TCs and concluded that the asymmetry of surfacewind in the pre-(post-)l and fall position is relatedto the acceleration(deceleration)of the flow over thesea(l and ). Ramsay et al. (2009)simulated TC Larry, and their results support the findings of earlier studies, which state that frictional convergence in the boundarylayer is significant in determining asymmetricalstructures of TCs.
Another important process is the entrainment ofdry and cool air into TC circulation. Studies(Tuleya and Kurihara, 1978; Powell, 1987)suggested thatlosses in oceanic heat and moisture source cool themiddle levels of the TC circulation, in combinationwith the advection of dry air from l and ; subsequently, TC intensity reduces. Knupp et al. (2006)reportedthat before TC Gabrielle l and ed, stratiform rain overthe l and established a mesoscale region of cool air(2001). Rebecca and Gray(2005)derived the strongasymmetry of the l and falling Hurricane Bonnie(1998), which depicts that the equivalent potential temperaturein the southern portion of the eyewall decreases, the air in the right-rear quadrant is cool, and the inflowof the circulation center in the southeast is strong.
Observing the detailed structure of a TC is challenging; thus, most previous investigations are in theform of case studies of individual storms. Nevertheless, the variability in the TC structure is in no doubtgreat, and no single TC can represent a generic cyclone. Therefore, a study that examines the generalfeatures of l and falling TCs with multiple cases ishighly desirable. The current study aims to obtain thegeneric kinematic and thermodynamic characteristicsof TCs that have made l and fall in mainl and China, along with the evolution of these characteristics in thel and fall process. Section 2 details the dataset used inthis study. After analyzing the sounding data, the resultsabout the kinematic structure of l and ing TCs arepresented in Section 3. Observations of the thermodynamicstructures of these TCs are analyzed in Section4. The study is then summarized and discussed inSection 5. 2. Data and method2. 1 Data
TC intensity and location data from 1998 to 2009are extracted from the Typhoon Yearbook producedby the Shanghai Typhoon Institute of the China MeteorologicalAdministration. The latitude, longitude, minimum central pressure, and maximum surface windspeed are available every 6 h, along with l and fall time and location. The direction of TC movement is determinedby the change in location every 12 h. This studyconsiders only the TCs that make l and fall over mainl and China, and those TCs that are not captured byany sounding data after l and fall are excluded. A totalof 73 TCs(including tropical depressions)from 1998to 2009 are examined. For TCs that make l and fallmore than once, only the initial l and fall is considered.
Surface data are gathered from 740 basic weatherstations across mainl and China. The sounding dataare collected from the sounding stations of the WorldWeather Watch Global Observing System, including120 upper-air sounding stations in China(Fig. 1). Thesounding data are obtained twice daily at 11 st and ardpressure levels. Two sets of sounding data are usedin this study. The first dataset contains data from1950 onward, with location of the sounding balloonat the pressure level similar to that of the balloonat surface level. The other dataset provides informationon the floating balloon at each pressure levelfrom April 2003 onward. The TCs l and falling fromJune to September account for 87. 5% of all the TCsthat l and ed in mainl and China from 2004 to 2009. Wecalculate the drift distances of sounding balloons at200 hPa from June to September of 2004–2009(see Fig. 2). The results show that the average drift distanceof the balloons over the area in which TCs typicallyl and (south of 32◦N and east of 105◦E)is lessthan 20 km. The average drift distance at each pressurelevel is also computed(Fig. 3). It is found thatthe floating distance increases with pressure, and themaximum drift distance is 25 km at 100 hPa. Thisstudy focuses on examining the average distributionof variables(wind speed, temperature, and humidity)at each 100-km radius from the TC center, thus thedrift distance of approximately 20 km has little effecton our results. To maximize the TC samples, we adoptthe first sounding dataset.
 |
| Fig. 1. Spatial distribution of the sounding stations. |
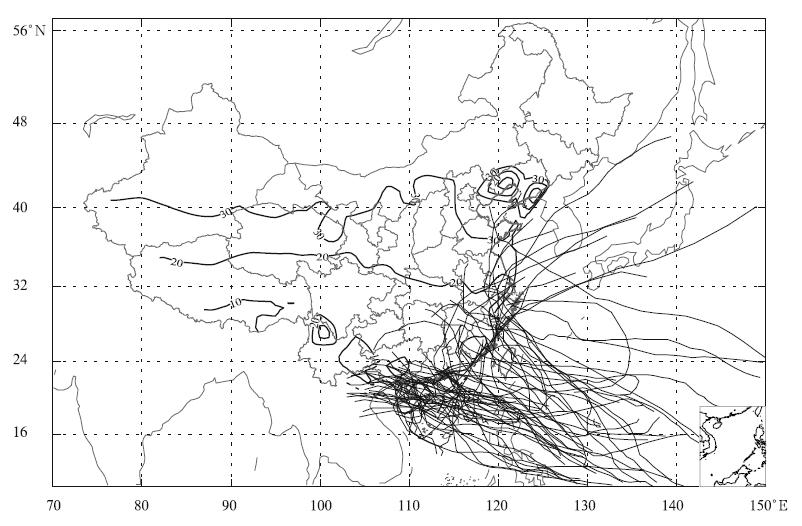 |
| Fig. 2. Average floating distances of the sounding balloons during June–September of 2004–2009 at 200 hPa. Boldblack lines indicate the drift distances, whereas thin black lines denote the tracks of l and falling TCs. |
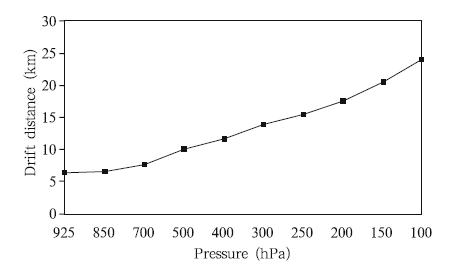 |
| Fig. 3. Average drift distances of sounding balloons inthe typical TC l and falling area(south of 32◦N and east of105◦E)during June–September of 2004–2009. |
Obtaining sufficient sounding data to analyze thedynamical and thermodynamic structures of an individualTC is impossible; thus, most data from TCsat various time periods must be composited to determinethe meaningful characteristics of their generickinematic and thermodynamic structures. Figure 4 shows the horizontal locations of all the sample datarelative to the TC center during certain periods at925 hPa. After discarding the sounding balloon driftingeffect, the TC center locations at various pressurelevels are similar to that at the surface level. Giventhe coarse distribution of samples, the variables areaveraged azimuthally over the annular zones at each100-km radius from the TC center. In this study, wegroup the sounding data every 12 h according to thesnapshot time of the TC l and fall. Meanwhile, the surfacecenter of the TC at the observation time of thesounding data, namely, at 0000 and 1200 UTC, wasderived from the Typhoon Yearbook.
 |
| Fig. 4. Scatter diagrams of the samples at 925 hPa at(a)0–12 h before l and fall, (b)0–12 h after l and fall, (c)12–24 hafter l and fall, and (d)24–36 h after l and fall. The direction of zero degree indicates the direction of TC movement. |
Figure 5 shows the azimuthal mean wind speeds ofall the sounding samples composited during the period0–24 h before l and fall and 0–72 h after l and fall. Thenumbers of samples at each level higher than 925 hPaare nearly equal at the same radius, although they aresmaller at 1000 hPa. The number of samples increaseswith the increase in radius. The maximum wind speedis 17. 1 m s−1 at 850 hPa and the radius is 100–200km. Wind speed decreases at heights above 850 hPa and with radial distances farther than 100 km. Thismaximum wind near the top of the boundary layerhas been observed in many previous studies(Franklin et al., 2003; Kepert, 2006a, b; Bell and Montgomery, 2008), which differs from the typical boundary layerunder non-hurricane conditions(Zhang et al., 2011).
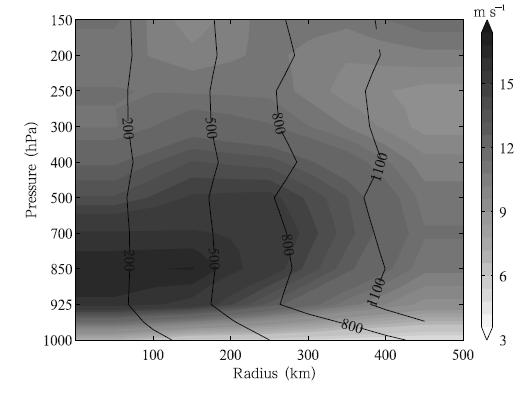 |
| Fig. 5. Composite radius-pressure cross-section of azimuthalmean wind speeds(shaded; m s−1) and samplesizes(contours)from 0–24 h before l and fall to 0–72 h afterl and fall. The shaded values are interpolated from theaverage wind speed at each 100-km radius. |
Similar values are derived at 0–12 h before l and fall and 0–12 h, 12–24 h, and 24–36 h after l and fall(Fig. 6). After l and fall, the wind speed in the entirestructure decreases, so is its horizontal/vertical gradient. At 0–12 h after l and fall, the maximum wind speeddecreases sharply from 27. 7 to 17. 6 m s−1; however, the location remains within the 100-km radius at 850hPa. At 12–24 h after l and fall, the maximum windspeed reduces to 2. 1 m s−1, and the center locationshifts to the radius between 100 and 200 km. At 24–36 h after l and fall, the maximum wind speed movesoutward farther from 300 to 400 km and upward to700 hPa. This expansion of the location of maximumwind speed is also observed after the l and falls of Andy(8209) and Sepat(0709)(Chen, 1984; Li et al., 2009).
 |
| Fig. 6. Composite radius-pressure cross-sections of azimuthalmean wind speeds(shaded; m s−1) and samplesizes(contours)at(a)0–12 h before l and fall, (b)0–12 hafter l and fall, (c)12–24 h after l and fall, and (d)24–36 hafter l and fall. The shaded values are interpolated from theaverage wind speed at each 100-km radius. |
For comparison, evolution of the mean verticalprofiles of horizontal wind at each 100-km radius isdepicted in Fig. 7. At below 500 hPa, the mean horizontalwind within the radius of 100 km decreasesmost significantly after l and fall and is mostly stablebeyond 300 km. However, the horizontal wind at eachradius begins to decay as time goes by. The windwithin the 200-km radius starts to weaken within 12h after l and fall, whereas those within the 200–300-km and 400–500-km radii begin to deteriorate at 12 and 24 h post-l and fall, respectively.
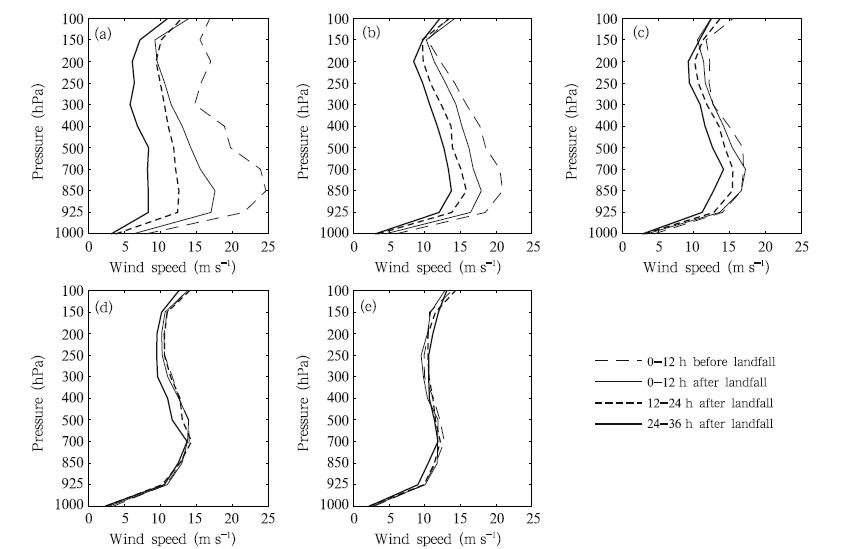 |
| Fig. 7. Evolution of the mean vertical profiles of horizontal wind at radii of(a)0–100, (b)100–200, (c)200–300, (d)300–400, and (e)400–500 km during TC l and fall. |
Distributions of the height of maximum windspeed(hvm)across the sounding data are given inFig. 8. At 0–12 h before l and fall, mean hvm increaseswhen the radius increases within 400 km and decreases slightly beyond this threshold(Fig. 8). Thisstructure is also theorized and observed previously(Kepert, 2001; Schwendike and Kepert, 2008; Zhang et al., 2011). Mean hvm similarly increases after theTC l and fall, but the rise is slightly gentler at 24–36h after l and fall. During l and fall, mean hvm withinthe 100-km radius increases(795 and 704 hPa at 0–12 h before and 24–36 h after l and falls, respectively). Within 24 h after l and fall, mean hvm beyond the 100-km radius changes minimally. Although hvm is widelydistributed from 925 to 500 hPa, more than half ofthe samples are located at 850 and 925 hPa within the100-km radius.
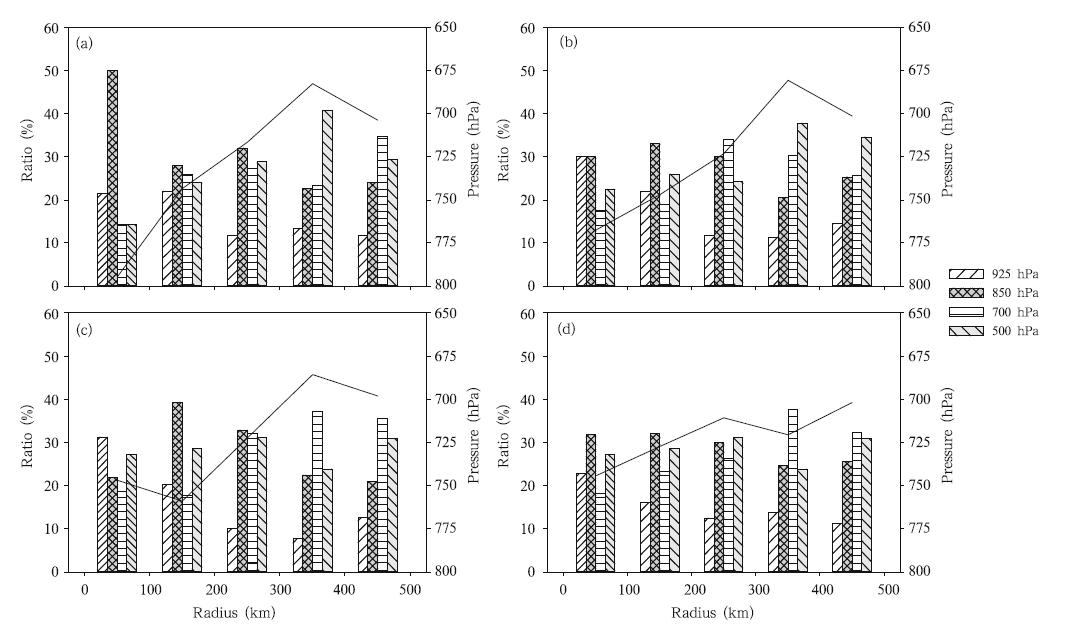 |
| Fig. 8. Distributions of the height of maximum wind speed(hvm)of all the sounding data in each 100-km radius at(a)0–12 h before l and fall, (b)0–12 h after l and fall, (c)12–24 h after l and fall, and (d)24–36 h after l and fall. The bars(with y-axis labels on the left)indicate the value of Numlev/Numall at each 100-km radius, where Numlev denotes thefrequency of hvm for all sounding data and Numall refers to the number of sounding samples. The black lines(y-axislabels on the right)correspond to mean height. |
Substantial azimuthal asymmetries are often presented in the TC wind fields, and these asymmetriesvary with height in terms of amplitude and phase(Marks et al., 1992). To compute the azimuthal average, the asymmetric structure may be divided into fourquadrants according to the center and the movementdirection of the TC, namely, the left-front, right-front, left-rear, and right-rear quadrants.
Due to lack of data coverage over the ocean, onlythe wind distributions in the four quadrants followingTC l and fall are shown in Fig. 9. The maximumwind speed at each pressure level(except 925 hPa)isobserved in the right quadrants because TC translationenhances the wind on the right side and reducesthe wind on the left side. The maximum winds areclosest to the TC center in the left-front quadrant and farthest in the right-rear quadrant. Wong and Chan(2007)simulated the wind distribution of a TC near itsl and fall, and found that the post-l and fall radial inflowis weak on the right/rear-right side, and the onshoreflow was generated by the maximum wind at a largeradius. During l and fall, the asymmetric structure ofthe wind field may be the result of the combined effectsof l and -sea roughness, environmental flow in thebackground, and TC translation(Powell, 1987).
In the left-front quadrant, gale-force winds(>17. 1 m s−1)are situated at the shallow area between850 and 925 hPa within the 100-km radius. In theright-front quadrant, broad and strong winds with theforce of a moderate gale(> 13. 8 m s−1)are producedin the deep layers. These winds are located between925 and 400 hPa within a radius ranging from 100 to400 km. However, only the wind at 850 hPa within aradius between 100 and 200 km achieves gale force. Inthe left-rear quadrant, the winds are all weaker than13. 8 m s−1. In the right-rear quadrant, the gale-forcewinds distribute between 850 and 700 hPa at a locationhigher than those of the winds in other quadrants. Broad and deep winds with the force of a moderategale spread in this area. The broadest area is located500 km from the TC center at 700 hPa, and the deepestarea is situated between 925 and 300 hPa withinthe 100–200-km radius.
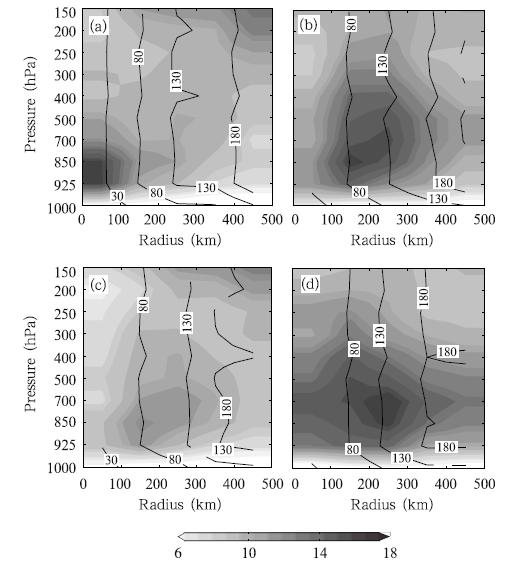 |
| Fig. 9. Composites radius-pressure cross-sections of azimuthalmean wind speeds(shaded; m s−1) and samplesizes(contours)in the(a)left-front, (b)right-front, (c)left-rear, and (d)right-rear quadrants after l and fall. Theshaded values are interpolated from the average wind speedat each 100-km radius. |
The composite radius-pressure cross-sections ofaverage temperature anomalies(Ta)before and afterl and fall are shown in Fig. 10. Ta is relative to thetemperature that is azimuthally and radially averagedbased on a radius ranging from 500 to 600 km. At 0–12 h before l and fall, positive Ta within the 100-km radiusis mainTained through a layer whose depth rangesfrom 100 hPa down to 700 hPa. Between 400 and 200hPa, a significant positive anomaly(Ta > 2℃)is observed. After l and fall, the depth of the warm core isslightly shallower, with a positive value ranging from150 to 700 hPa. However, the extent of the significantanomaly decreases sharply from 400 to 250 hPa at 0–12 h after l and fall and remains at 250 hPa at 12–24 hafter l and fall. At 24–36 h after l and fall, the positiveTa in the entire TC circulation is less than 2℃.
 |
| Fig. 10. Radius-pressure cross-sections of azimuthalmean temperature anomalies(shaded; ℃) and samplesizes(contours)at(a)0–12 h before l and fall, (b)0–12 hafter l and fall, (c)12–24 h after l and fall, and (d)24–36 hafter l and fall. The shaded values are interpolated from theaverage temperature anomalies at each 100-km radius. |
At 0–12 h before l and fall, the maximum Ta is2. 94℃ at 250 hPa within a 100-km radius. Afterl and fall, Ta and its horizonTal gradient decrease significantlyat above 500 hPa. At 24 h after l and fall, the location of the maximum Ta remains at 250 hPawithin 100 km; however, the magnitude of the maximumTa decreases with time, especially within 12 hafter l and fall(Fig. 10). After 24 h, the warm coreof the TC is insignificant, and the location of maximumTa shifts to a radius between 100 and 200 km. Meanwhile, the trends of the maximum positive Tawithin 100–300-km radius contradict those of the maximumpositive Ta within the 100-km radius. The maximumTa within 100–200-km(200-300-km)radius increasesfrom 1. 17℃(0. 88℃)at 0–12 h before l and fallto 1. 79℃(1. 42℃)at 24–36 h after l and fall.
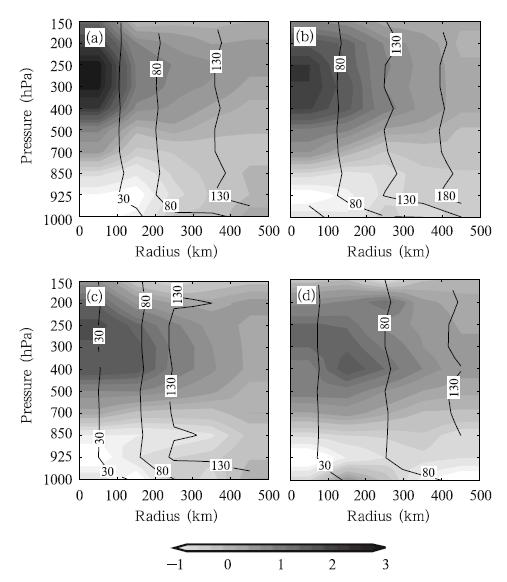
The distributions of Ta across different quadrantsat 24 h after l and fall are displayed in Fig. 11. Notethat the warm TC core is insignificant 24 h postl and fall. In the four quadrants, the positive Ta withinthe 100-km radius maintains through a layer withdepth ranging from 100 to 700 hPa. The significantanomaly within the 100-km radius is deeper in the left and right-front quadrants within 200–400 and 250–300hPa, respectively. The maximum Ta in the left-frontquadrant is larger than those in other quadrants atincreased heights(3. 11℃ at 250 hPa within a 100-kmradius), whereas the maximum magnitude of Ta in theleft-rear quadrant is the smallest. In the right-rearquadrant, the warmest Ta is located within the 100–200-km but not the 100-km radius as in other quadrants.
 |
| Fig. 11. Composite radius-pressure cross-sections of azimuthalmean temperature anomalies(shaded; ℃) and sample sizes(contours)in the(a)left-front, (b)right-front, (c)left-rear, and (d)right-rear quadrants at 24 h afterl and fall. The shaded values are interpolated from the averagetemperature anomalies at each 100-km radius. |
The composite radius-pressure cross-sections ofthe average relative humidity(RH)before and afterl and fall are shown in Fig. 12. The air near lowpressurelevels within a small radius is wetter thanthat at higher-pressure levels at a larger radius bothpre- and post-TC l and fall. At 0–12 h before l and fall, the layers of wet air with RH ≥ 60% become shallowwith the extension of the radius upward to 250 hPawithin 100 km. The layers deepen to 500 hPa at the500-km radius. After l and fall, the ratio of the changewith radius is smaller because the wet air layers withRH ≥ 60% are much shallower within the 100-km radiusbut change minimally beyond the 100-km radius. At 24–36 h after l and fall, the depth of the wet air layerswith RH ≥ 60% extends upward to 400 hPa fromthe surface within the 100-km radius.
 |
| Fig. 12. Radius-pressure cross-sections of azimuthalmean RH(shaded; %) and sample sizes(contours)at(a)0–12 h before l and fall, (b)0–12 h after l and fall, (c)12–24h after l and fall, and (d)24–36 h after l and fall. The shadedvalues are interpolated from the average RH at each 100-km radius, and the bold solid lines indicate RH = 60%. |
At 0–12 h before l and fall, the maximum RH is94. 2% within the 100-km radius at 850 hPa. Afterl and fall, the location of the maxima shifts downwardto 1000 hPa. The maximum values are 92. 9%, 94. 2%, and 95. 6% at 0–12, 12–24, and 24–36 h after l and fall, respectively.
After TC l and fall, the air is much drier within250–200 hPa, which is the location of the warm core, than at the other levels within the 100-km radius. However, this phenomenon is not evident before l and fallpossibly because of the low-resolution data. BeforeTC l and fall, the warm Ta at 250 hPa extends toa large radius(Fig. 10a)that can be recognized bythe sounding daTa; whereas the dry air generated bythe subsidence within the eye covers a much smallerarea. After TC l and fall, the warm and dry cores areclearly observed because the warm Ta and the eye exp and outward.
The layers of wet air with RH ≥ 60% stretch upwardfrom 1000 to 400 hPa in the front quadrantswithin the 100-km radius. These layers are shallowerthan those in the rear quadrants(Fig. 13). In theright-rear quadrant, the layers of wet air with RH ≥90% extend upward to 700 hPa within the 100-km radius, which is much deeper than those in other quadrants. In this quadrant, the maximum RH is 95. 2%, which is larger than the maxima in other quadrants.
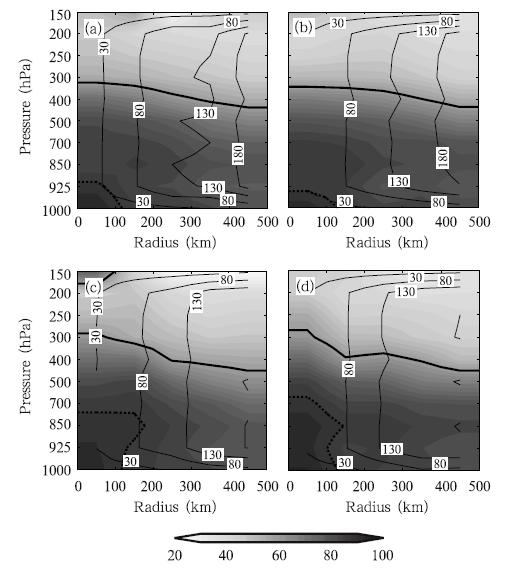 |
| Fig. 13. Composite radius-pressure cross-sections of azimuthalmean RH(shaded; %) and sample sizes(contours)in the(a)left-front, (b)right-front, (c)left-rear, and (d)right-rear quadrants after l and fall. The shaded values areinterpolated from the average RH anomalies at each 100-km radius, the bold solid lines indicate RH = 60%, and the bold dashed lines refer to RH = 90%. |
Virtual potential temperature(θv)is an essentialvariable to characterize vertical stability and to determinethe height of the boundary layer(Stull, 1991; Kumar et al., 2010). The variable θv is calculatedas in Stull(1991). In this study, we define the thebase of the stable layer(hθv)as the lowest level withdθv/dz ≥ 3 K km−1. This level is Taken as the mixedlayer depth by Zeng et al. (2004). The lowest levelat 1000 hPa is replaced by the above-surface heightz = 10 m in our computation of the vertical lapse rateof θv.
Mean hθv generally increases with radius(Fig. 14), which is consistent with the hvm trend. In contrast, θv distribution differs significantly from thatof hvm. First, mean θv varies from 922 to 860hPa during l and fall and is shallower than hvm withineach radius. This finding is consistent with the observationalstudy by Zhang et al. (2011)based on thedata from the global positioning system dropsondes, it is also in agreement with the model results of Ma etal. (2013). In a large radius, the differences betweenthe means of θv and hvm can be observed. Second, distributions of θv are highly concentrated, with over3/4 of the samples located at 925 hPa after l and fall. Third, the trend of the mean θv within the 100-kmradius contradicts that of hvm, which decreases from893 hPa at 0–12 h before l and fall to 919 hPa at 24–36h after l and fall. This variation may be caused by theirdifferent definitions. The winds at low levels decreasemore than those at higher levels because of surfacefriction such that the height of the maximum windspeed increases after TC l and fall. After l and fall, thebase height of the stable layer decreases as convectiveactivities in TCs weaken.
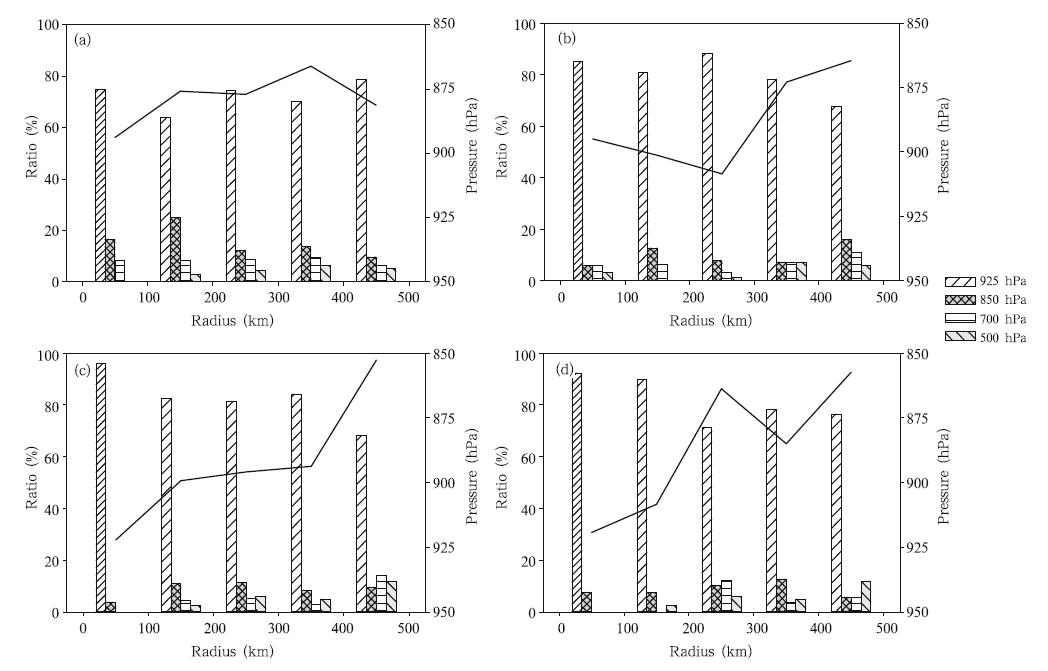 |
| Fig. 14. Distributions of the base height of the stable layer defined as the lowest level of dθv/dz ≥ 3 K km−1 at(a)0–12 h before l and fall, (b)0–12 h after l and fall, (c)12–24 h after l and fall, and (d)24–36 h after l and fall. The bars(withy-axis labels on the left)indicate the ratio of the number of times the base of a stable layer was observed at each pressurelevel to all the samples at each 100-km radius, and the black lines(y-axis labels on the right)denote the mean height. |
This study examines the distribution and evolutionof the wind, temperature, and humidity associatedwith TCs making l and fall in mainl and China, based on sounding data from 1998 to 2009.
Given the evolution of wind and temperatureanomaly distributions every 12 h during TC l and fall, we propose a general sequence of TC decay(Fig. 15). At 0–12 h after l and fall, the maximum positive anomaliesof wind and temperature decrease sharply; however, the locations remain unchanged. At 12–24 h afterl and fall, the warm core remains within 100 km, butthe maximum wind speed moves outward to a large radius. After 24 h, the maximum wind speed and temperatureanomalies both move farther away from theTC center. This process indicates that the maximumspeed of low-level wind initially exp and s after l and fall. As a result, the high-level warm core is damaged.
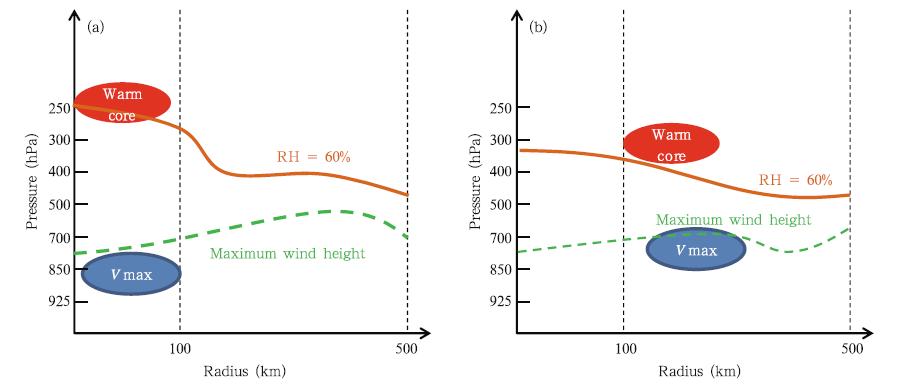 |
| Fig. 15. Conceptual model for the TC structure at(a)0–12 h before l and fall and (b)24–36 h after l and fall. |
After l and fall, azimuthal asymmetries in the windfield are observed. For insTance, the maximum windspeed at each level(except at 925 hPa)is in the rightquadrant, and it remains closest to the TC center inthe left-front quadrant. By contrast, it is farthest inthe right-rear quadrant. Some previous studies(e. g., Powell, 1987)reported that the asymmetric structureof the TC wind field during l and fall may be generatedby the combined effects of differences in l and -searoughness, environmenTal flow in the background, and TC translation. These findings suggest that we mustconsider not only the deterioration of the entire windstructure when forecasting the wind distributions ofTC after l and fall, but also the asymmetries of windspeed according to radial disTance, azimuthal position, and time period after l and fall.
The height of the boundary layer is an essentialparameter that controls the extent of the turbulentfluxes and the energy transport from the surface layerto the free atmosphere(Stull, 1991; Noh et al., 2003). With sounding daTa, the height of the boundary layercan be estimated based on the height of the maximumwind speed and the base of the sTable layer. Althoughthe resolution of the sounding daTa used inthis study is too low to determine the precise depth ofthe boundary layer, the distributions of hvm and hθvas calculated by using the sounding daTa share similarfeatures in the height of the boundary layer, accordingto previous studies(e. g., Zhang et al., 2011). For example, the means of hvm and hθv decrease withthe closeness of the radius to the TC center within400 km. These means drop off slightly outside the400-km radius(Zhang et al., 2011). Other studies(e. g., Kepert, 2001)indicated that the increases inhvm with radius may be related to the increase in roTationalsTability toward the center, whereas subsidencewarming may reduce hvm at a large radius(Kepert, 2010). Meanwhile, the mean of hvm increases withinthe 100-km radius during the l and fall process, and theopposite is true for the mean of hθv. This variationmay be the result of their different definitions. Thewinds at low levels decrease more than those at higherlevels because of surface friction such that the heightof the maximum wind speed increases after l and fall. After l and fall, the convective activities in TCs weaken, which reduces the base height of the sTable layer.
These results infer the characteristics of the meankinematic and thermodynamic structures of TCs makingl and fall in the mainl and of China. However, furtherstudies are required. First, the daTa used in thisstudy are not fine enough; thus, case studies shouldbe conducted on deTailed TC structures using otherobservation daTa(i. e., Doppler radar daTa). Second, we should consider the similarities in the compositionof TCs given sufficient samples, such as size, intensity, and location.
| [1] | Bell, M. M., and M. T. Montgomery, 2008: Observed structure, evolution, and potential intensity of cate-gory 5 Hurricane Isabel (2003) from 12 to 14 Septem-ber. Mon. Wea. Rev., 136, 2023-2036. |
| [2] | Blackwell, K. G., 2000: The evolution of Hurricane Danny (1997) at landfall: Doppler-observed eyewall re-placement, vortex contraction/intensification, and low-level wind maxima. Mon. Wea. Rev., 128, 4002-4016. |
| [3] | Chambers, C. R. S., and T. Li, 2011: The effect of Hawaii's big island on track and structure of trop-ical cyclones passing to the south and west. Mon. Wea. Rev., 139, 3609-3627. |
| [4] | Chan, J. C. L., K. S. Liu, S. E. Ching, et al., 2004: Asymmetric distribution of convection associated with tropical cyclones making landfall along the South China coast. Mon. Wea. Rev., 132, 2410-2420. |
| [5] | Chen Ruishan, 1984: Analysis of the features of Typhoon Andy (8209) track, intensity change and its influ-ence of Fujian Province after its landing on Taiwan. Marine Sci. Bull., 3, 17-26. (in Chinese) |
| [6] | Franklin, J. L., M. L. Black, and K. Valde, 2003: GPS dropwindsonde wind profiles in hurricanes and their operational implications. Wea. Forecasting, 18, 32-44. |
| [7] | Kepert, J. D., 2001: The dynamics of boundary layer jets within the tropical cyclone core. Part I: Linear theory. J. Atmos. Sci., 58, 2469-2484. |
| [8] | —-, 2006a: Observed boundary layer wind structure and balance in the hurricane core. Part I: Hurricane Georges. J. Atmos. Sci., 63, 2169-2193. |
| [9] | —-, 2006b: Observed boundary layer wind structure and balance in the hurricane core. Part II: Hurricane Mitch. J. Atmos. Sci., 63, 2194-2211. |
| [10] | —-, 2010: Slab-and height-resolving models of the trop-ical cyclone boundary layer. Part II: Why the sim-ulations differ. Quart. J. Roy. Meteor. Soc., 136, 1700-1711, doi: 10.1002/qj.685. |
| [11] | Knupp, K. P., J. Walters, and M. Biggerstaff, 2006: Doppler profiler and radar observations of boundary layer variability during the landfall of tropical storm Gabrielle. J. Atmos. Sci., 63, 234-251. |
| [12] | Kumar, M., C. Mallik, A. Kumar, et al., 2010: Evalua-tion of the boundary layer depth in semi-arid region of India. Dyn. Atmos. Oceans, 49, 96-107. |
| [13] | Li Ying, Qian Chuanhai, and Chen Lianshou, 2009: A study on the eyewall expansion of Typhoon Sepat (2009) during its landfall process. Acta Meteor. Sinica, 67, 799-810. (in Chinese) |
| [14] | Ma Zhanhong, Fei Jianfang, Huang Xiaogang, et al., 2013: Evaluation of the ocean feedback on height characteristics of the tropical cyclone boundary layer. Acta Meteor. Sinica, 27, 910-922, doi: 10.1007/s13351-013-0611-z. |
| [15] | Marks, F. D., Jr., R. A. Houze, Jr., and J. F. Gamache, 1992: Dual-aircraft investigation of the inner core of Hurricane Norbert. Part I: Kinematic structure. J. Atmos. Sci., 49, 919-942. |
| [16] | Montgomery, M. T., and R. J. Kallenbach, 1997: A the-ory for vortex Rossby-waves and its application to spiral bands and intensity changes in hurricanes. Quart. J. Roy. Meteor., 123, 435-465. |
| [17] | Noh, Y., W. G. Cheon, S. Y. Hong, et al., 2003: Im-provement of the K-profile model for the planetary boundary layer based on large eddy simulation data. Bound.-Layer Meteor., 107, 401-427. |
| [18] | Powell, M. D., 1987: Changes in the low-level kinematic and thermodynamic structure of Hurricane Alicia (1983) at landfall. Mon. Wea. Rev., 115, 75-99. |
| [18] | —-, and S. H. Houston, 1998: Surface wind fields of 1995 hurricanes Erin, Opal, Luis, Marilyn, and Roxanne at landfall. Mon. Wea. Rev., 126, 1259-1273. |
| [19] | Ramsay, H. A., L. M. Leslie, and J. D. Kepert, 2009: A high-resolution simulation of asymmetries in severe Southern Hemisphere tropical cyclone Larry (2006). Mon. Wea. Rev., 137, 4171-4187. |
| [20] | Rebecca, S., and M. B. Gray, 2005: Low-level kinematic, thermodynamic, and reflectivity fields associated with Hurricane Bonnie (1998) at landfall. Mon. Wea. Rev., 133, 3243-3259. |
| [21] | Schwendike, J., and J. D. Kepert, 2008: The boundary layer winds in hurricanes Danielle (1998) and Isabel (2003). Mon. Wea. Rev., 136, 3168-3192. |
| [22] | Stull, R. B., 1991: Static stability—An update. Bull. Amer. Meteor. Soc., 72, 1521-1529. |
| [23] | Szeto, K. C., and J. C. L. Chan, 2010: Structural changes of a tropical cyclone during landfall: β-plane simu-lation. Adv. Atmos. Sci., 27, 1143-1150. |
| [24] | Tuleya, R. E., and Y. Kurihara, 1978: A numerical simu-lation of the landfall of tropical cyclones. J. Atmos. Sci., 35, 242-257. |
| [25] | —-, M. A. Bender, and Y. Kurihara, 1984: A simula-tion study of the landfall of tropical cyclones. Mon. Wea. Rev., 112, 124-136. |
| [26] | Wang, Y. Q., 2002: Vortex Rossby waves in a numeri-cally simulated tropical cyclone. Part II: The role in tropical cyclone structure and intensity change. J. Atmos. Sci., 59, 1239-1262. |
| [27] | Wong, M. L. M., and J. C. L. Chan, 2006: Tropical cy-clone motion in response to land surface friction. J. Atmos. Sci., 63, 1324-1337. |
| [27] | —-, and —-, 2007: Modeling the effects of land-sea roughness contrast on tropical cyclone winds. J. Atmos. Sci., 64, 3249-3264. |
| [28] | Zeng, X. B., M. A. Bruke, M. Y. Zhou, et al., 2004: Marine atmospheric boundary layer height over the eastern Pacific: Data analysis and model evaluation. J. Climate, 17, 4159-4170. |
| [29] | Zhang, J. A., R. F. Rogers, D. S. Nolan, et al., 2011: On the characteristic height scales of the hurricane boundary layer. Mon. Wea. Rev., 139, 2523-2535. |
 2014, Vol. 28


