 2014, Vol. 28
The Chinese Meteorological Society
Article Information
- XU Liangtao, ZHANG Yijun, WANG Fei, ZHENG Dong. 2014.
- Simulation of the Electrification of a Tropical Cyclone Using the WRF-ARW Model:An Idealized Case
- J. Meteor. Res., 28(3): 453-468
- http://dx.doi.org/10.1007/s13351-014-3079-6
Article History
- Received December 17, 2013;
- in final form March 11, 2014


2 College of Earth Science, University of Chinese Academy of Sciences, Beijing 100049
The results indicate that the TC eyewall generally exhibits an inverted dipole charge structure with negative charge above the positive. In the intensification stage, however, the extremely tall towers of the eyewall may exhibit a normal tripole structure with a main negative region between two regions of positive charge. The outer spiral rainband cells display a simple normal dipole structure during all the stages. It is further found that the differences in the charge structure are associated with different updrafts and particle distributions. Weak updrafts, together with a coexistence region of different particles at lower levels in the eyewall, result in charging processes that occur mainly in the positive graupel charging zone (PGCZ). In the intensification stage, the occurrence of charging processes in both positive and negative graupel charging zones is associated with strong updraft in the extremely tall towers. In addition, the coexistence region of graupel and ice crystals is mainly situated at upper levels in the outer rainband, so the charging processes mainly occur in the negative graupel charging zone (NGCZ).
1. Introduction
As a devastating weather system,the tropicalcyclone(TC) and its dynamical and microphysicalcharacteristics have long been of interest. In recent years,space-borne lightning detectors and theglobal/regional lightning location network have provided new data for the research on TCs. Observational studies have shown that the spatial distributionof lightning activity in TCs has a unique feature: astrong maximum near the outer rainb and s(210–290-km radius),a weak maximum in the eyewall region, and a minimum in 80–100 km outside the eyewall (Molinari et al., 1994,1999).
At the same time,it is found that lightning activity is associated with the formation and developmentof TCs. Lightning may be used as an indicator of TCformation in the Northeast Pacific and Atlantic regions (Price et al., 2007; Leary and Ritchie, 2009). Inaddition,there is a relationship between TC intensitychange and lightning activity,in particular the lightning in the eyewall region (Pan et al., 2010; Thomas et al., 2010). The increase in eyewall lightning can occur 24 h ahead of a TC reaching maximum intensity (Price et al., 2009). The outbreak of eyewall lightning sometimes precedes or occurs in the rapid intensificationstage of TCs (Squires and Businger, 2008; DeMaria et al., 2012; Zhang and Zhou, 2013). Moreover,it has been suggested that lightning activity is related tothe movement of TCs (Corbosiero and Molinari, 2002;Zhang et al., 2012).
The charge structure is the bridge between lightning activity and the dynamical and microphysicalcharacteristics of TCs. The charge structure in TCsis influenced by vortex dynamics and microphysics (Houze,2010),while any lightning occurs relative tothe charge structure. Hence,to further underst and the relationship between lightning activity and the internal structure of TCs,it is necessary to examine thebridging role of the charge structure.
At present,there is relatively little research on theelectrification and charge structure of TCs. Black and Hallett(1999)presented observations of the verticalelectric field of TCs and pointed out that an inverteddipole charge structure dominates in the eyewall. Thisis,to a great extent,due to the weak updraft in theeyewall. The graupel particles at the levels from 0 to–5℃ and the low liquid water content(LWC)providethe conditions for positive charging of graupel and negative charging of ice crystals,leading to the inverteddipole structure. As observations are limited to altitudes below the –15℃level(limit of the aircraft),itis difficult to infer a charge structure above that level.Molinari et al.(1994)suggested formation of a dipolewith normal sign but outward tilting along the sloping eyewall. However,Fierro et al.(2011)suggesteda normal tripole structure in the eyewall based on ananalysis of the rapid intensification of Hurricane Ritausing total lightning and narrow bipolar events(NBE)data.
Owing to difficulty in observing the charge structure of TCs,studies on the electrification and chargestructure of TCs have been carried out with numerical models incorporating electrification and dischargeprocesses (Fierro et al., 2007,2013; Fierro and Reisner, 2011). The results mainly showed a tripole chargestructure in TCs. Fierro et al.(2007)simulatedthe electrification of an idealized TC with the noninductive charge separation scheme of Saunders and Peck(1998)(SP98) and obtained a normal tripolestructure in the eyewall and a simple dipole structurein the spiral rainb and s. Fierro and Reisner(2011)simulated the rapid intensification of a hurricane by usinga cloud model and indicated that the eyewall is characterized by an inverted tripole structure with a positivecharge region s and wiched between two negative chargeregions.
Fierro et al.(2013)introduced the SP98 noninductive charge separation process and a lightningparameterization into the National Severe Storms Laboratory(NSSL)two-moment microphysical scheme ofthe Advanced Research Weather Research and Forecasting(WRF-ARW)model (Skamarock et al., 2008). The results showed a normal tripole structure in theeyewall of Hurricane Rita. In the upper cloud region,ice crystals and snow take up positive charge and thesmall amount of graupel particles take up negativecharge. In the middle region,the particles are mainlygraupel,which charges negatively,as well as small colliding ice particles with positive charge. In the lowerregion,particles mainly charge positively while ice and snow charge negatively. This kind of charge structure is conducive to the occurrence of negative cloudground(CG)lightning.
Previous results,including observations and simulations,do not agree with each other. They also donot consider the changes in the charge structure of TCsat different stages of TC evolution. Outbreaks of eyewall lightning occur in the rapid intensification stage,while there is little lightning in the quasi-steady stage (Samsury and Orville, 1994). There fore,the chargestructure of the TC should vary at different stages. Onthe other h and ,the clouds in the eyewall and the rainb and are influenced by the dynamics of the inner-corevortex to varying degrees. Therefore,several intriguing questions naturally arise: What is the evolution ofthe charge structure of TCs at different stages,particularly the intensification and quasi-steady stages?What differences in the charge structure are there between the cells in the eyewall and spiral rainb and s?
The evolution of the charge structure of the TC,including the eyewall and outer spiral rainb and cells,issimulated in this work. Although the charge structureof TCs has been simulated in idealized and real casesin previous studies,simulations using different microphysical and charge separation schemes are essential to further improving our underst and ing (Fierro and Reisner, 2011). The WRF-ARW model is also usedhere,but with the non-inductive charge separationscheme based on the work of Gardiner et al.(1985) and Ziegler et al.(1991). The electrification scheme and a new simple bulk discharge parameterization (Xu et al., 2012)are incorporated into the Milbr and t twomoment scheme.
The remainder of this paper is organized as follows. A detailed description of the model is given inSection 2. In Section 3,the idealized test and modelsetup are introduced. Based on the simulation,Section 4 presents the differences in electrification and charge structure of TCs during the intensification and quasi-steady stages, and a picture of the evolution ofthe charge structure of TCs is presented,together withprevious simulated and observed results. Finally,themajor findings of the study are discussed and summarized in sections 5 and 6,respectively.2. Description of the model
The numerical experiments are conducted withthe WRF-ARW model version 3.4.1 developed by theNCEP/NCAR. The model is fully compressible and non-hydrostatic.2.1 Microphysical parameterization
The Milbr and t two-moment microphysical parameterization (Milbr and t and Yau, 2005a,b)adaptedfrom WRF version 3.2.1 is used in this study. Thisscheme was introduced into the WRF model in 2010 and includes detailed microphysical processes. Six hydrometeor categories are included in the scheme: clouddroplets,ice crystals,rain,snow,graupel, and hail.The two-moment scheme provides the mixing ratio forwater vapor and it can provide both the mixing ratio and number concentration of the other six hydrometeors. Explicit electrification and discharge are implemented in this scheme.
To compute the electrical variables,seven globalmicrophysical variables are introduced into the WRFmodel: the charge density of cloud droplets,ice crystals,rain,snow,graupel,hail, and the total chargedensity(or net charge density). These seven variableswill be computed as microphysical prediction variablesfollowing the other microphysical variables. The vertical electric field and gridpoint flash number are diagnosed variables.2.2 Charge conservation
The particle charge density(ρx)of each hydrometeor is calculated as follows (Altaratz et al., 2005):
The first two terms on the right h and side of the equation represent the advection and turbulent transportof the charge,which can be calculated by followingthe hydrometeors in the model. The third term onthe right h and side represents sources and sinks of thecharge,including charge separation and charge loss bythe discharge process. Charge transfer between different particles due to transformation between particlesis also considered in this term. We assume that thereis no charge transfer involved in evaporation and condensation. The last term on the right h and side represents the charge change caused by sedimentation ofthe particles. The total charge density at each gridpoint is equal to the sum of the charge densities of allthe hydrometeors.2.3 Non-inductive charge separation
The model considers the non-inductive chargeseparation between graupel and ice crystals,graupel and snow, and hail and ice crystals. The noninductive charging rate(∂ρxy/∂t)is calculated as follows (Mansell et al., 2005; Tan,2006):
where Dx and Dy represent the diameters of the colliding particles; |Vx−Vy| is the fall velocity differencebetween the two charging particles;Ecolli is the collision efficiency of the colliding particles; Exy is thecollection efficiency,which is the product of Ecolli and Eagg(fraction aggregated by graupel or hail);nx and nyare number concentrations of the particles; and δQis the representative separated charge per rebounding collision. Equation(2)can be re-written as follows (Mansell et al., 2005; Tan,2006): whereβis the force coefficient when the charge transfer is calculated at low temperature,as given by Mansell et al.(2005), and NCLxyis the numberconcentration collection rate between the particles.The separated charge(δQ)can be calculated by theGardiner–Ziegler(GZ)scheme (Gardiner et al., 1985;Ziegler et al., 1991),which is based on the laboratoryexperiment by Jayaratne et al.(1983),as follows: wherekis a proportionality factor,Di represents thediameter of ice crystal or snow,δv is the differencein mass-weighted terminal fall speed between different particles,δLis a parameter related to liquid watercontent, and f(τ)is a function of reversal temperature and environment temperature. The calculation ofδL and reversal temperature is given in Eqs.(5) and (7),respectively,as modified by Tan(2006)based on theexperiment by Pereyra et al.(2000): where LWC is the liquid water content, and qc is thecloud water mixing ratio. The functionf(τ)is givenby Ziegler et al.(1991)as follows: whereτ=(−21/Tr)(T−273.16)is the scaled temperature, and Tr is the reversal temperature (Tan,2006): Note that the reversal temperature(Tr)usedinthisstudy is different from that used by Ziegler et al.(1991). The reversal temperature determines the signof charge transfer when graupel(or hail)collides withthe ice and snow. The new scheme(Fig. 1)specifiesthe reversal temperature under conditions of low liquid water content,while the graupel(hail)would take on a negative charge directly under conditions of lowliquid water content in the scheme used by Ziegler etal.(1991). The graupel would charge positively whenbounced-off ice crystals in the regions where reversaltemperature is smaller than environment temperature,while the ice crystals would charge with opposite polarity. These regions can be defined as positive graupelcharging zones(PGCZ),while the regions where reversal temperature is greater than environment temperature can be defined as negative graupel charging zones(NGCZ).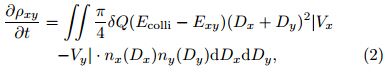


 |
| Fig. 1. Non-inductive charge separation sign-reversalcurve used in the present study. The signs represent thepolarity of charge taken by the graupel(or hail)in thenon-inductive scheme. |
Inductive charge separation results from the collision between different particles in the presence of anambient electric field. In this paper,the inductivecharge separation between graupel and cloud, and hail and cloud,is calculated as follows (Ziegler et al., 1991):
where the subscriptsx and c represent graupel(orhail) and cloud droplets,respectively;Dx and Dc arethe characteristic diameters of graupel(or hail) and cloud droplets,respectively;nx and nc are the numberconcentrations of graupel(or hail) and cloud droplets,respectively;Vxis the mass-weighted mean fall speedof graupel(or hail); Γ(x)is the complete gamma function; n0x is the number concentration intercept forgraupel(or hail);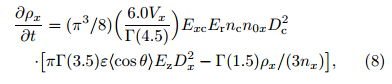
The change in particle charge density that resultsfrom the sedimentation of hydrometeors is also considered here. The sedimentation of the particle chargedensity is calculated by an equation similar to thatfor the sedimentation of hydrometeors (Milbr and t and Yau, 2005a):
where ρairis the density of air and VNXis the terminalfall speed of particles.2.6 Lightning parameterization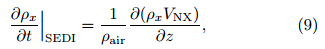
A bulk lightning parameterization (Xu et al., 2012)is used in this paper. When the particle chargedensity is obtained from the calculation,the electricalpotential(Φ)can be calculated by the Poisson equation:
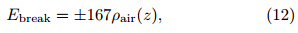
whereρ represents the total charge density at thegridpoint and ε is the electrical permittivity of air(8.8592×10⁻¹² Fm-1). The electrical field can becalculated bywhereEis the electric field. Equation(10)is solvedby successive over-relaxation,with the boundary conditions at the bottom and top set to zero in our model.The discharge initiation threshold(defined asEbreak)is the height-varying electric field,as follows (Marshall et al., 1995):whereρair(z)is the(non-dimensional)air density varying with height. The unit of Ebreakis kV m-1.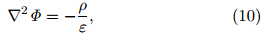

The grid flash number(FN)is counted on the ground grid only. If the value of the vertical electricfield at one gridpoint directly above a ground gridpointexceedsEbreak,the model will reduce the charge density at the gridpoint where the absolute electric fieldexceeds 30 kVm-1(defined as Eend)by 20%. Thedischarge scheme is one dimensional,so only the gridsin the vertical direction of the initiate grid are judgedfor reducing charge, and one flash will be recorded forthe corresponding ground gridpoint. The dischargeprocess is calculated independently for each groundgridpoint. If adjacent ground gridpoints all record aflash at the same time,the flash number will increasein each ground gridpoint,even though they may beconsidered as the same flash. In the mesoscale model,the time step is usually more than 10 s and the discharge can occur many times; therefore,for every timestep,up to 12 discharges are permitted in this simulation. The limitation of the number of discharges issensitive to the time step.
At each time step,the microphysical scheme firstcalculates the charging, and the transfer and sedimentation of charge density. Then,the electric field is calculated. Lastly,the discharge process is applied and the scheme advances to the next time step.
The lightning code explicitly solves for the electricfield in the one-dimensional scheme,so only the vertical electric field can be given by the model. But,thelightning code herein has the Message Passing Interface(MPI)capability to allow for larger mesoscale simulation exceeding the day scale, and it can be used inthe real-time simulation. The lightning scheme couldefficiently reduce the charge and restrain the increaseof the maximum electric field. In a squall line case,thepredicted distribution of lightning density is similar tothat of the observed CG lightning density. Please referto Xu et al.(2012)for detail.
The model coupled with the electrical processes isreferred to as the WRF-Electric model(WRF-Elec).The charge density of the different hydrometeor particles and diagnosed grid flash number can be simulatedby WRF-Elec.3. Idealized case and model setup
An idealized tropical cyclone,em−tropical−cyclo- ne,is used in this study. This is a three-dimensionaldefault idealized case in version 3.4.1 of the WRFARW model.
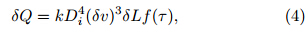
The initial vortex is weak and axisymmetric(Fig. 2), and is specified by an analytic equation from Rotunno and Emanuel(1987). The vortex is placed inthe center of the domain, and is in hydrostatic and gradient wind balance with the maximum wind speedat the lowest model level. This low-level vortex has ahorizontal radius of 412.5 km and a maximum windspeed of 15 m s-1at a radius of 82.5 km. The initialhorizontally homogeneous environment is specified viavertical profiles of the Jordan mean hurricane sounding (Jordan,1958). An f-plane centered at 20°Nisemployed in this model with a constant sea surfacetemperature(SST)of 28℃.
 |
| Fig. 2. The initial vortex in the center of domain 1,witha maximum wind speed of 15 m s-1at the radius of 82.5km and a size of 412.5 km. Sea level pressure(hPa; solidlines)contours: 986 to 990 by 2 hPa. |
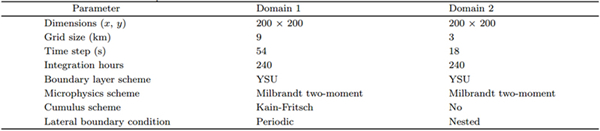
The two domains both have a mesh size of 200×200,with horizontal grid resolutions of 9 and 3 km,respectively. The vertical grid spacing is 1.25km with the model top at 25 km. Domain 2 is located in the center of domain 1, and both are staticnests. The physical options include the Milbr and t twomoment microphysical parameterization with electrical processes,the Kain-Fritsh cumulus scheme (Kain,2004), and the YSU(Yonsei University)planetaryboundary layer scheme (Hong et al., 2006). The lateral boundary conditions are periodic. No cumulus parameterization is used in the 3-km mesh. The defaultradiation scheme is specified in the idealized model.The two meshes are integrated for 240 h with a timestep of 54 s in the coarse domain and 18 s in the innerdomain; see Table 1 for more details.4. Results4.1 Overview of the tropical cyclone
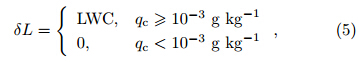
Figure 3 shows the time evolution of the minimum sea level pressure(MSLP) and maximum windspeed of the simulated TC in domain 1. The processesof TC development include the spin-up and initial organization,the intensification stage,the quasi-steadystage, and the TC weakening with oscillation of intensity. The MSLP can reach 920 hPa and the maximumwind speed is 85 m s-1at the mature stage. Foursnapshots corresponding to different stages of the simulated TC are shown in Fig. 3. Letters a(t =90h) and b(t = 108 h)denote the intensification stage ofthe TC,while c(t= 156 h) and d(t= 168 h)indicatethe quasi-steady stage. The horizontal displacementof the TC is very slow,so the TC is always locatedwithin the scope of domain 2. The eyewall can beclearly identified from the simulated combined radarreflectivity at different times in domain 2(Fig. 4).The eyewall shrinks in the intensification stage. The spiral rainb and is sometimes relatively loose(Figs. 4a and 4b), and sometimes has a distinct b and structure(Figs. 4c and 4d). The eyewall lightning in TCs generally occurs in the rapid intensification stage ratherthan in the quasi-steady stage. Lightning activity isdifferent in the eyewall and the outer spiral rainb and region. The charge structure of the eyewall and theouter spiral rainb and cell in different stages of the TCis analyzed in the next section in order to investigatethe relationship between the evolution characteristicsof charge structure and lightning activity, and the processes driving the evolution.
 |
| Fig. 3. Time evolution of the minimum sea level pressure(MSLP; hPa; red line) and maximum azimuthal windspeed(m s-1; blue line)of the simulated TC. The lettersa(t=90h),b(t= 108 h),c(t= 156 h), and d(t= 168h)represent four different times that are analyzed in thefollowing section. |
 |
| Fig. 4.Simulated combined reflectivity(dBZ)in domain 2 at(a)t=90h,(b)t= 108 h,(c)t= 156 h, and (d)t=168 h. The red and blue lines indicate the location of the vertical cross-section of the majority of the plots in this study. |
Figures 5a–d show the total charge density in thevertical cross-sections along the red lines marked inFig. 4. The charge structure of eyewall cells is different at different stages. In the TC intensification stage(Figs. 5a and 5b),there is an inverted dipole structurein some eyewall cells with a negatively charged regionabove a positively charged one. However,some cellsin the eyewall show a normal tripole structure with abroad negative region between two regions of positivecharge. In the quasi-steady stage(Figs. 5c and 5d),the negative charge region of the eyewall is widespread and the cells only show the inverted dipole structure.Black and Hallett(1999)also suggested that the inverted dipole structure dominates in the eyewall ofTCs. The widespread negative charge region and theinverted dipole and normal tripole structures would beconducive to the occurrence of negative CG lightning (Black and Hallett, 1999; Fierro et al., 2013),which isconsistent with the polarity of CG lightning observedin the eyewall region of TCs (Lyons and Keen, 1994). The formation of the TC charge structure can be affected by the dynamical and microphysical characteristics.
The difference in charge structure is firstly dueto the difference in updrafts. The updraft in the eyewall is generally weak,even in the intensification stage.However,there are some extremely tall towers(knownas convective burst cells)in the eyewall region during the rapid intensification stage,which are characterized by the tripole charge structure. Figures 6a and 6b show that the vertical velocity of cells withtripole structure may reach 14 m s-1,while in thequasi-steady stage(Figs. 6c and 6d),the updraft inthe eyewall cells is much weaker(<5ms-1). Notethat although the updraft in the eyewall cell can reachvery high altitudes(Fig. 6a),strong updrafts are always found in the region between levels of 0 and –20℃above the melting level.
 |
| Fig. 5. Vertical cross-sections of total charge density(nC m-3; shaded)at(a)t=90h,(b)t= 108 h,(c)t= 156 h, and (d)t= 168 h along the red lines of Figs. 4a–d; and (e)t=90h and (f)t= 156 h along the blue lines of Figs. 4a and 4c. The horizontal lines represent the isotherm lines of –20℃,–10℃(dashed line), and 0℃(solid line). The solidline with “5” represents the contour line of 5 dBZ. |
 |
| Fig. 6. As in Fig. 5,but for vertical velocity(m s-1; shaded) |
Graupel and ice crystals play an important rolein the electrification, and their charge density is theprimary component of the total charge density. Thecharge carried by hail,snow,cloud, and rain is smallerthan that of graupel and ice in this simulation(figure omitted). In a recent TC observational study,Reinhart et al.(2014)demonstrated that the microphysical environments consisting of graupel,verysmall ice particles, and supercooled water are favorable for non-inductive charging. Figures 7a–d and 8a–d show vertical distributions of the mixing ratio and the charge density of graupel and ice at different times.Widespread ice crystals are mainly located at the topof the clouds,with some in the layer from 0 to –20℃.The distribution of graupel is concentrated and it isfound lower than the ice. In the strong updraft region,as shown in Figs. 7a and 7b,the graupel canbe lifted into a higher position,resulting in the coexistence of graupel and ice in the middle and upperatmosphere(Figs. 7a,7b,8a, and 8b). In the eyewall cells during the quasi-steady stage,the graupeloccurs generally between 0 and –20℃(Figs. 7c and 7d), and graupel and ice coexist mainly at the middlelevel. From Figs. 5 and 9,it can also be found thatthe electrically active region mainly accompanies theabundant LWC region.
Different dynamical and microphysical conditionsmay affect the particle charge polarity and value,thereby affecting the charge structure. The noninductive scheme plays the leading role in this simulation,especially the charge separation between graupel and ice crystals,while the electrification due to theinductive scheme is weak. The results given by Takahashi(1978)have shown that the collisions betweenriming graupel and lighter ice crystals exchanged asufficient amount of charge per collision to account forthe observed electric field. The graupel and ice chargedensity at different stages is therefore analyzed in order to underst and the formation of the charge structure of the eyewall.
First,we consider the particle charge compositionof the tripole structure in the eyewall. The graupeltakes a negative charge at the upper level and a positive charge at the middle level(Figs. 7a and 7b),while the ice crystals are oppositely charged(Figs. 8a and 8b). The sign of the particle charge is determined by the environment temperature and reversal temperature which is affected by the LWC when graupel collides with ice. The LWC(Figs. 9a and 9b)above the –13.8℃level is not large enough(<1gm-3)to affect the reversal temperature. Therefore,the –13.8℃level could be considered as the reversal temperature level. The NGCZ is above thereversal temperature level(HRTL) and PGCZ is below the HRTL. These results indicate that the charging process occurs above and below the HRTL at thesame time. The sign of the particle charges is consistent with the tripole results simulated by Fierro et al.(2013).
 |
| Fig. 7. As in Fig. 5,but for graupel mixing ratio(g kg-1; shaded) and charge density of graupel(nC m-3;redcontoursof±0.1,±0.2,±0.3, and ±0.5 nC m-3). Solid lines indicate positive values and dashed lines indicate negative values. |
 |
| Fig. 8. As in Fig. 7,but for ice mixing ratio(g kg-1; shaded) and charge density of ice(nC m-3;redcontours). |
The particle charge distribution of the inverteddipole charge structure is simpler than that of thetripole structure. Att = 156 h and t = 168 h(Figs.7c,7d,8c, and 8d),the graupel particles only chargepositively and the ice crystals only charge negatively.Each hydrometeor particle takes one polarity. Thisindicates that the non-inductive graupel-ice chargingprocess only occurs in PGCZ. This is due to the weakupdraft and the relatively low position of the coexistence region of graupel and ice in the eyewall,asseen in observations (Black and Hallett, 1999). TheLWC(Figs. 9c and 9d)in the –10 to –20℃layer istoo low(<0.5 g m-3)to lift the PGCZ,so the graupel becomes positively charged when ice crystals arebounced off,as the particle collisions occur below the–13.8℃level.
 |
| Fig. 9. As in Fig. 5,but for liquid water content(g m-3; shaded). |
The results of Fierro et al.(2007)showed a nor-mal tripole structure in the eyewall and they considered that the simulated updraft is stronger than theobservations. The results of our study suggest thatonly extremely tall towers have updrafts strong enoughto generate the tripole structure. Fierro et al.(2011)analyzed the rapid intensification stage of HurricaneRita using lightning and NBE data. They capturedthe simultaneous occurrence of negative CG lightningat the lower level and positive NBE at the upper level.Positive NBEs are produced between a main negativecharge layer and upper positive charge layers (Wu et al., 2012). Therefore,it can be inferred that normaltripole charge structures occur in eyewall cells. Theseobserved and simulated tripole results support different aspects of our simulations. In turn,our simulations help to underst and recent results from observations and other simulations.
From the positions of the region of maximumcharge density(Fig. 5a) and maximum vertical velocity(Fig. 6a),we can see that the maximum totalcharge densities occur at the same time as the maximum vertical velocities,but they are separated spatially. The maximum vertical velocity occurs at a position with very low total charge density. In observations,the lightning hole(lightning-free region)is alsoassociated with the strong updraft in thunderstorms (Zhang et al., 2004). 4.3 Outer b and cell electrification at different stages of TC evolution
Figures 5e and 5f show the total charge density inthe vertical cross-sections along the blue lines markedin Fig. 4. The charge structure in the outer spiralrainb and displays the same structure in all stages: a dipole with positive charge above the negative. Thecross-sections of the vertical velocity(Figs. 6e and 6f)show that the convective cells in the spiral rainb and sgenerally have the greatest vertical velocity(>12 ms-1). In some cells,the center region of greatest vertical velocity is mainly located at the upper level(Fig. 6e).
Distributions of hydrometeors(Figs. 7e,7f,8e, and 8f)show that widespread ice crystals are mainlylocated at the upper level and that graupel canreach the upper level,transported by the updraft. Themajor region of coexistence of graupel and ice is inthe upper level. Under these conditions,the graupelmainly charges negatively and the ice crystals chargepositively(Figs. 7e,7f,8e, and 8f). This indicates thatcharging only occurs in NGCZ while in the extremelytall eyewall cells,charging occurs in both NGCZ and PGCZ. From Eq.(7),it is inferred that if the environmental temperature of collision position is lower,theLWC needed for charge sign reversal is higher. Figure 9f shows that the LWC between –10 and –20℃level ishigh(>1gm-3),which would easily make the graupelcharge positively,but the graupel also charges negatively. We can further infer that the collision positionis relatively high.
Although the extremely tall towers in the eyewall and the cells in the spiral rainb and both have strongupdraft,the total charge density is different in thetwo types of convective cell. This is because the coexistence regions of ice and graupel are at differentheights. In the simulation by Fierro et al.(2007),theeyewall cells show a normal tripole and the cells in therainb and s show the simple normal dipole. The chargestructure of the spiral rainb and s is consistent with thepresent results.5. Discussion
The electrification of TCs is influenced by vortex dynamics. The differences in the dynamical and microphysical features between the eyewall and outerspiral rainb and s lead to different charge structures.In particular,the eyewall cells show different chargestructures at different stages. Only one case is analyzed in this study,but a picture of the evolution ofthe electrification and charge structure of TCs can beinferred from the results.
The simple discharge parameterization is oneshortcoming of this study. A one-dimensional discharge scheme is used and the scheme cannot reproduce the branched pathways of lightning. Flashes atneighboring gridpoints may belong to the same flashbut they have been considered as isolated flashes. Thedischarge scheme can lead to errors in the lightningparameterization but it can reduce the charge successfully. A simple discharge scheme also means that thecomputation is very efficient. A relatively complexdischarge scheme was used by Fierro et al.(2013), and their discharge scheme was implemented in a separate module in the model. The discharge schemeused in our study is incorporated in the microphysical scheme. If the WRF-Elec is to be used for predicting lightning,a proper discharge scheme wouldbe needed. Developing adequate parameterizations oflightning in mesoscale weather models is one of theimportant goals of atmospheric electricity in the nearfuture (Qie,2012).
There are many two-moment microphysical parameterizations in the WRF-ARW, and many chargeseparation schemes. The charge structure could beaffected by our choice of microphysical and chargingschemes. The present study is based on just one non-inductive charge separation and microphysical scheme.Hence,future studies employing different schemes areplanned.
In the simulation of an idealized TC by Fierro etal.(2007),the charge structure was a normal tripolein the eyewall,while in our simulation the eyewall cellshows an inverted dipole in the quasi-steady stage.Other than the different non-inductive schemes used inthe two cases,the difference of the simulated strengthof updraft may be the main reason. Strong updrafts(>10 m s-1)can support a deep mixed-phase layercontaining abundant supercooled water,which is conducive to TC electrification (Black and Hallett, 1999). The observational study by Reinhart et al.(2014)further proved that strong updrafts of 10–20 m s-1are afavorable factor for TC electrification.
Given that lightning mainly occurs in the deepconvective cells,the internal deep convective structureof TCs might be deduced from lightning data (Fierro et al., 2011). Assimilation of lightning data could beused to improve the initial structure of TCs. In thisstudy,the distribution and strength of the updraft and microphysical characteristics determine the electrification. Strong electrification accompanies the outbreakof eyewall lightning corresponding to the strong updraft. Cells in the outer spiral rainb and with a normaldipole structure correspond to strong updrafts and thecoexistence of different particles at upper levels. Thissuggests a relationship between the lightning data and TC cell structure. It is evident that the updraft is separated from the strong electrification region, and thisrepresents an obstacle to establishing the relationshipbetween lightning and vertical velocity.
The eyewall in our simulation is definite and strong,while the spiral rainb and is relatively looseat times. One possible reason is that the eyewall is too strong to restrain the development of the rainb and ; this may be related to the initial vortex. Thereis strong vortex advection in TCs and charge can betransported by the advection. Therefore,the chargedensity in one cross-section does not result only fromthe local charging process but also from the advection,which can also affect the charge structure.6. Summary
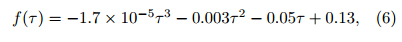
Inductive and non-inductive electrificationschemes and a bulk discharge parameterization areintroduced into the Milbr and t two-moment microphysical scheme in the WRF-ARW model. The modelwith electrical processes,referred to as WRF-Elec,isable to simulate the charge density and electric field inthe cloud. An idealized TC is simulated based on theWRF-Elec model. The evolution of the electrificationof the TC is analyzed first, and then the electricalstructures of the cells in the eyewall and outer spiral rainb and s are compared. This study makes anattempt to illustrate the evolution of the charge structure of TCs(Fig. 10). The results of this study canunify most of the previous observations and simulations.
 |
| Fig. 10. Evolution of the charge structure of a TC duringdifferent stages of the TC development |
The cells in the eyewall have different chargestructures in different stages. In the intensificationstage,the general cell has an inverted dipole structure,but the extremely tall tower cells with strongupdraft can display a normal tripole structure. In thequasi-steady stage,the cells only show an inverteddipole structure. Cells in the outer spiral rainb and have a similar structure in all stages of the TC. Thenormal dipole structure dominates in the cells withrelatively strong updraft in the rainb and . The noninductive graupel-ice mechanism plays a leading rolein the electrification.
In the intensification stage,the updraft is strongin the extremely tall towers in the eyewall. Thisstrong vertical velocity at the middle and upper levels of the atmosphere leads to strong electrificationboth in positive and negative graupel charging zones.Large particles like graupel take a negative charge atthe upper level and a positive charge at the middlelevel. The small particles take on the opposite sign ofcharge at the middle and upper levels. As a result,the tripole structure,with a negative charge regionbetween two positive charge regions,appears. Extremely tall towers with strong electrification accompany the outbreak of eyewall lightning and these towers are coincident with storm intensification (Kelley et al., 2004). In the quasi-steady stage,the extremelytall towers disappear and the graupel cannot be transported to the upper level. The weak updraft and lowheight of the coexistence region of graupel and ice crystals in the eyewall induce charging processes that occurmainly in the PGCZ. Under this weak updraft condition,the intensity of electrification weakens and lightning in the eyewall is rare.
The convective cell in the spiral rainb and is different from the cell in the eyewall. The cell in the spiralrainb and generally has a strong updraft but the coexistence region of graupel and ice crystals is mainlylocated at the upper level. Electrification is strongin the NGCZ,leading to a simple normal dipole structure. Because the cell in the spiral rainb and has strongvertical velocity in all stages of TC evolution,the lightning mainly occurs in the outer spiral rainb and s.
An idealized TC is simulated in this study whosestructure is influenced by the rather artificial conditions. The evolution of the charge structure of TCsunder more realistic conditions will be analyzed and simulated in a future study by employing WRF-Elec.This more realistic simulation could be verified by observations,which would further help to underst and thecharge structure of TCs.
Acknowledgments.The authors thank Dr.Milbr and t in Environment Canada for guidance onusing the two-moment microphysical scheme. We also thank Drs. Ting Wu and Xi Cao for constructive suggestions. Finally,the authors thank the two anonymous reviewers for their valuable comments.
| Altaratz, O., T. Reisin, and Z. Levin, 2005: Simulation of the electrification of winter thunderclouds using the three-dimensional Regional Atmospheric Modeling System (RAMS) model: Single cloud simulations. J. Geophys. Res., 110(D20), D20205, doi: 10.1029/2004JD005616. |
| Black, R. A., and J. Hallett, 1999: Electrification of the hurricane. J. Atmos. Sci., 56, 2004-2028. |
| Corbosiero, K. L., and J. Molinari, 2002: The effects of vertical wind shear on the distribution of convection in tropical cyclones. Mon. Wea. Rev., 130, 2110-2123. |
| DeMaria, M., R. T. DeMaria, J. A. Knaff, et al., 2012: Tropical cyclone lightning and rapid intensity change. Mon. Wea. Rev., 140, 1828-1842. |
| Fierro, A. O., L. Leslie, E. Mansell, et al., 2007: A highresolution simulation of microphysics and electrification in an idealized hurricane-like vortex. Meteor. Atmos. Phys., 98, 13-33. |
| —-, and J. M. Reisner, 2011: High-resolution simulation of the electrification and lightning of Hurricane Rita during the period of rapid intensification. J. Atmos. Sci., 68, 477-494. |
| —-, X.-M. Shao, T. Hamlin, et al., 2011: Evolution of eyewall convective events as indicated by intracloud and cloud-to-ground lightning activity during the rapid intensification of hurricanes Rita and Katrina. Mon. Wea. Rev., 139, 1492-1504. |
| —-, E. R. Mansell, D. R. MacGorman, et al., 2013: The implementation of an explicit charging and discharge lightning scheme within the WRF-ARW model: Benchmark simulations of a continental squall line, a tropical cyclone, and a winter storm. Mon. Wea. Rev., 141, 2390-2415. |
| Gardiner, B., D. Lamb, R. L. Pitter, et al., 1985: Measurements of initial potential gradient and particle charges in a Montana summer thunderstorm. J. Geophys. Res., 90(D4), 6079-6086. |
| Hong, S.-Y., Y. Noh, and J. Dudhia, 2006: A new vertical diffusion package with an explicit treatment of entrainment processes. Mon. Wea. Rev., 134, 2318-2341. |
| Houze, R. A., 2010: Clouds in tropical cyclones. Mon. Wea. Rev., 138, 293-344. |
| Jayaratne, E. R., C. P. R. Saunders, and J. Hallett, 1983: Laboratory studies of the charging of soft-hail during ice crystal interactions. Quart. J. Roy. Meteor. Soc., 109, 609-630. |
| Jordan, C. L., 1958: Mean soundings for the West Indies area. J. Meteor., 15, 91-97. |
| Kain, J. S., 2004: The Kain-Fritsch convective parameterization: An update. J. Appl. Meteor., 43, 170-181. |
| Kelley, O. A., J. Stout, and J. B. Halverson, 2004: Tall precipitation cells in tropical cyclone eyewalls are associated with tropical cyclone intensification. Geophys. Res. Lett., 31, L24112, doi: 10.1029/2004GL021616. |
| Leary, L. A., and E. A. Ritchie, 2009: Lightning flash rates as an indicator of tropical cyclone genesis in the eastern North Pacific. Mon. Wea. Rev., 137, 3456-3470. |
| Lyons, W. A., and C. S. Keen, 1994: Observations of lightning in convective supercells within tropical storms and hurricanes. Mon. Wea. Rev., 122, 1897-1916. |
| Mansell, E. R., D. R. MacGorman, C. L. Ziegler, et al., 2005: Charge structure and lightning sensitivity in a simulated multicell thunderstorm. J. Geophys. Res., 110(D12), D12101, doi: 10.1029/2004JD005287. |
| Marshall, T. C., M. P. McCarthy, and W. D. Rust, 1995: Electric field magnitudes and lightning initiation in thunderstorms. J. Geophys. Res., 100(D4), 7097-7103. |
| Milbrandt, J. A., and M. K. Yau, 2005a: A multimoment bulk microphysics parameterization. Part I: Analysis of the role of the spectral shape parameter. J. Atmos. Sci., 62, 3051-3064. |
| —-, and M. K. Yau, 2005b: A multimoment bulk microphysics parameterization. Part II: A proposed three-moment closure and scheme description. J. Atmos. Sci., 62, 3065-3081. |
| Molinari, J., P. K. Moore, V. P. Idone, et al., 1994: Cloud-to-ground lightning in Hurricane Andrew. J. Geophys. Res., 99, 16665-16676. |
| —-, —-, and —-, 1999: Convective structure of hurricanes as revealed by lightning locations. Mon. Wea. Rev., 127, 520-534. |
| Pan, L., X. Qie, D. Liu, et al., 2010: The lightning activities in super typhoons over the Northwest Pacific. Sci. China (Earth Sci.), 53, 1241-1248. |
| Pereyra, R. G., E. E. Avila, N. E. Castellano, et al., 2000: A laboratory study of graupel charging. J. Geophys. Res., 105(D16), 20803-20812. |
| Price, C., Y. Yair, and M. Asfur, 2007: East African lightning as a precursor of Atlantic hurricane activity. Geophys. Res. Lett., 34, L09805. |
| —-, M. Asfur, and Y. Yair, 2009: Maximum hurricane intensity preceded by increase in lightning frequency. Nat. Geosci., 2, 329-332. |
| Qie, X., 2012: Progresses in the atmospheric electricity researches in China during 2006-2010. Adv. Atmos. Sci., 29, 993-1005. |
| Reinhart, B., H. Fuelberg, R. Blakeslee, et al., 2014: Understanding the relationships between lightning, cloud microphysics, and airborne radar-derived storm structure during Hurricane Karl (2010). Mon. Wea. Rev., 142, 590-605. |
| Rotunno, R., and K. A. Emanuel, 1987: An air-sea interaction theory for tropical cyclones. Part II: Evolutionary study using a nonhydrostatic axisymmetric numerical model. J. Atmos. Sci., 44, 542-561. |
| Samsury, C. E., and R. E. Orville, 1994: Cloud-to-ground lightning in tropical cyclones: A study of hurricanes Hugo (1989) and Jerry (1989). Mon. Wea. Rev., 122, 1887-1896. |
| Saunders, C. P. R., and S. L. Peck, 1998: Laboratory studies of the influence of the rime accretion rate on charge transfer during crystal/graupel collisions. J. Geophys. Res., 103, 13949-13956. |
| Skamarock, W. C., J. B. Klemp, J. Dudhia, et al., 2008: A Description of the Advanced Research WRF version 3, NCAR/TN-475+STR, 113 pp. |
| Squires, K., and S. Businger, 2008: The morphology of eyewall lightning outbreaks in two category 5 hurricanes. Mon. Wea. Rev., 136, 1706-1726. |
| Takahashi, T., 1978: Riming electrification as a charge generation mechanism in thunderstorms. J. Atmos. Sci., 35, 1536-1548. |
| Tan Yongbo, 2006: Numerical simulation of relationship of lightning discharge with the space charge and potential distribution in thundercloud. Ph. D. dissertation, Univ. of Sci. and Tech. of China, 173 pp. (in Chinese) |
| Thomas, J. N., N. N. Solorzano, S. A. Cummer, et al., 2010: Polarity and energetics of inner core lightning in three intense North Atlantic hurricanes. J. Geophys. Res., 115(A3), A00E15, doi: 10.1029/2009JA014777 |
| Wu, T., W. S. Dong, Y. J. Zhang, et al., 2012: Discharge height of lightning narrow bipolar events. J. Geophys. Res., 117(D5), D05119, doi: 10.1029/2011JD017054. |
| Xu Liangtao, Zhang Yijun, Wang Fei, et al., 2012: Coupling of electrification and discharge processes with WRF model and its preliminary verification. Chinese J. Atmos. Sci., 36, 1041-1052. (in Chinese) |
| Zhang, W., Y. Zhang, D. Zheng, et al., 2012: Lightning distribution and eyewall outbreaks in tropical cyclones during landfall. Mon. Wea. Rev., 140, 3573-3586. |
| —and Zhou Xiuji, 2013: Lightning activity and precipitation characteristics of Typhoon Molave (2009) around its landfall. Acta Meteor. Sinica, 27, 742-757. |
| Zhang, Y., Q. Meng, P. R. Krehbiel, et al., 2004: Spatial and temporal characteristics of VHF radiation source produced by lightning in supercell thunderstorms. Chinese Sci. Bull., 49, 624-631. |
| Ziegler, C. L., D. R. MacGorman, J. E. Dye, et al., 1991: A model evaluation of noninductive graupelice charging in the early electrification of a mountain thunderstorm. J. Geophys. Res., 96(D7), 1283312855. |