 2014, Vol. 28
The Chinese Meteorological Society
Article Information
- ZHAO Wenjing, ZHANG Ning, SUN Jianning. 2014.
- Spatiotemporal Variations of Cloud Amount over the Yangtze River Delta, China
- J. Meteor. Res., 28(3): 371-380
- http://dx.doi.org/10.1007/s13351-014-3064-0
Article History
- Received September 2, 2013;
- in final form September 2, 2013


Clouds are a crucial factor in local and regionalclimate change. They modulate the earth’s radiation budget and the hydrologic cycle (R and all and Tjemkes, 1991). Meanwhile,different cloud types always produce different climate effects and can also reflect different atmospheric conditions. Thus,it is important to investigate the long-term change not onlyin total clouds but also in different cloud types.
In recent decades,many observational studieshave focused on the analyses of clouds over China.Using surfaceobservations, Kaiser(1998)found a decrease in the annual mean total cloudiness over Chinabetween 1951 and 1994. Li et al.(2004)studied thespatial distribution and seasonal variation of differenttypes of clouds over China based on the ISCCP(International Satellite Cloud Climatology Project)satellite data and surface observations from 1990 to 1998.Endo and Yasunari(2006)examined the long-termtrends of the low-level cloud frequencies and low-levelcloud amounts over China with surface observationsfrom 1971 to 1996. At the same time,much attentionhas also been paid to the relationships between thespatiotemporal variation of clouds and other climateparameters. Kaiser(2000)discussed the relationshipbetween the total cloudiness and other meteorologicalvariables over China,including station pressure,relative humidity, and water vapor pressure. Liang and Xia(2005) and Qian et al.(2006)pointed out that decreasing trends are found in both the cloudiness and solar radiation over China, and the cause for decreas ing radiation over China is probably increasingaerosols but not cloudiness. Warren et al.(2007)analyzed the variations of cloudiness and cloud typesbased on surface observations from 1971 to 1996, and discussed the anthropogenic influence on clouds.They considered the effect of smoke aerosols on cloudamount nonnegligible.
Though many previous studies have focused oncloud amount or cloud frequency over all of China,this paper focuses on a specific area,the Yangtze RiverDelta(YRD),China. YRD is the largest urban agglomeration area in China(Fig. 1b),which covers anarea of 110800 km2,with a population of more than97 million. With rapid urbanization,a series of human activities have likely caused local climate changein this area,such as the urban heat isl and (UHI)effect (Zhang N. et al., 2010) and changes in solar radiation absorption (Zhang et al., 2004). Few investigations have tried to research long-term cloud changesover this area,although clouds are closely related tothe surface energy balance,solar radiation,precipitation, and so on. This study analyzes the spatiotemporal characteristics of multi-layered cloud amountsover the YRD,by using the NOAA’s Advanced VeryHigh Resolution Radiometer(AVHRR)Pathfinder Atmospheres Extended(PATMOS-x)monthly averagecloud amount records from 1982 to 2006.
 |
| Fig. 1.(a)Topographic height and the analysis area(the black rectangle enclosed area).(b)L and covers in the analysisarea,from MODIS observations in 2005. The black and red rectangular areas indicate urban area and cropl and area,respectively,which are also mentioned in Fig. 6. NJ: Nanjing; CZ: Changzhou; WX: Wuxi; SZ: Suzhou; SH: Shanghai;HZ: Hangzhou. |
The NOAA-AVHRR PATMOS-x is a projectto derive long-term surface and atmospheric climaterecords(cloud,aerosol,surface, and radiometric)fromroughly 30 yr of data from NOAA’s AVHRR(including AVHRR/2 and AVHRR/3)onboard the Polar Operational Enrironmental Satellite(POES)spacecraftfrom 1981 to present. The POES system includes amorning satellite with equator crossing times at approximately 0700(descending orbit) and 1900(ascending orbit)local solar time(LST), and an afternoonsatellite with the equator crossing times at approximately 0200(descending orbit) and 1400(ascendingorbit)LST,thus providing global coverage 4 times aday. From the average of all data from afternoon and morning satellite retrievals,an approximate daily and monthly mean is calculated. Monthly averaged cloudamount data retrieved from PATMOS-x version 4 witha 0.5-degree spatial resolution are analyzed in thisstudy, and the cloud types are defined by the cloudtop pressure (Rossow and Schiffer, 1999)as shown inTable 1. Note that before 1992 there was no morningdata included in PATMOS-x,so the monthly averagedcloud amounts are simply the average of the afternoonsatellite records before 1992. A comparison betweenthe data from only the afternoon satellite observations and both morning and afternoon observations during 1992–2006(Fig. 2)shows that the observationsfrom two satellites and one afternoon satellite consistwell on the variations of the annual mean data series,although there is a bias of 1%–3% sky cover incloud amount. Similar characteristics are also foundin four seasons(figure omitted). In order to considera longer observation series,the whole time series ofcloud amount(1982–2006)are examined and analyzedin this paper, and the differences between the datasetsbefore and after 1992 are considered as an intervention impact on the trend detection (Weatherhead et al., 1998).

 |
| Fig. 2. Annual mean cloud amounts(% sky cover)of(a)total cloud,(b)high-level cloud,(c)mid-level cloud, and (d)low-level cloud,from both morning and afternoon satellites retrievals(line with asterisks) and from only the afternoonsatellite retrievals(line with triangles). |
The Clouds from AVHRR Extended(CLAVRx)algorithms are used to detect PATMOS-x clouds (Pavolonis and Heidinger, 2004; Pavolonis et al., 2005;Heidinger and Pavolonis, 2009). The global cloudamounts from CLAVR-x agree well with other established satellite-derived cloud climatologies (Thomas et al., 2004), and have been widely used in current research of cloud changes (Clement et al., 2009;Tang et al., 2012). It should be noticed that thereare some limitations in passive remote sensing observations compared with the active remote sensing (Kennedy et al., 2010; Xi et al., 2010). For theCLVAR-x approaches that can estimate opaque cloudswell,there is difficulty in uniquely detecting thin cirrus and small clouds(not filling the sensor field ofview) (Nieman et al., 1993; Heidinger and Pavolonis, 2009). However,the approaches can detect multilayered cloud only in situations where thin and highclouds are situated over low,thick clouds (Pavolonis and Heidinger, 2004). This paper focuses on thetrends/tendencies of cloud amounts rather than theaccurate cloud amount values when considering theuncertainties in observation methods.
In this study,a linear regression analysis is performed to analyze the variation in cloud. Tiao et al.(1990) and Weatherhead et al.(1998)pointed out thatthe precision of linear trend estimate is strongly influenced by the autocorrelation of the noise and intervention in the data series,such as when an instrumentis changed at a specific time. Given that there is apermanent shift in the data series in 1992,we considera trend model as follows (Weatherhead et al., 1998).
wheret=1,2,···,T(T= 25 is the number of years);Yt is the cloud amount series; Xt = 1982,1983,···,2006;ais a constant term; bis the trend;cUtis a meanlevel shift term accounting for the intervention impactat the specific timet =T0(in this study T0 = 11,corresponding toXt = 1992):Ut =0(t<T0),Ut =1(t≥T0). The noise termNt is assumed as a first-orderautoregressive [AR(1)]: Nt =ρNt−1+εt,where ρisthe autocorrelation coefficient and εtis the white noisewith mean zero and common variance. Regression coefficientsa,b, and care estimated by the method ofgeneralized least squares(GLS) and detailed processes and corresponding discussions were presented well in Weatherhead et al.(1998).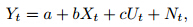
A commonly used criterion is adopted to test thesignificance of trends: a real trend is indicated at the95% confidence level when  ,where
 isthe estimator of b and
  is the uncertainty of trendestimate(st and ard deviation of). It is found thatthe trend estimate and its uncertainty are strongly influenced by the level shift term in the trend model.The level shift term will not only increase the uncertainty of the trend estimate but also modify its value:
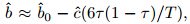 where
where  isthe estimator ofc, and 0 is the trend estimate in thetrend model without considering the level shift term(c= 0). In addition,the confidence level
  is substantially reduced when including the level shift termin the trend model.
Low-level clouds should be more sensitive to local l and surface conditions than higher clouds. Thus,we focus on the time-space distributions of the lowlevel cloud amount in summer and try to examine ifl and -surface heterogeneity has any influence on localclouds.3. Results
The monthly variations of cloud amounts are illustrated in Fig. 3. The total cloud amount peaksin June and then gradually decreases from summerto winter with a minimum in December. High-levelclouds occur most frequently from March to October and have a similar monthly variation with total clouds.The mid-level cloud amount peaks during the wintermonths and reaches a minimum in summer. The variation of low-level clouds is weak and the value fromAugust to October is slightly greater than the othermonths.
 |
| Fig. 3. Monthly mean cloud amounts during the period1982–2006,averaged over the Yangtze River Delta. |
Annual and seasonal changes of cloud amountsaveraged over the YRD are analyzed by using thelinear regression analysis(Fig. 4). Here,trends areconsidered statistically significant when the confidenceinterval is greater than 95%; otherwise,the temporal variations are considered as tendencies (Dong et al., 2010). For the annual mean cloud amounts(Fig. 4a),the averages of total and high-,mid-, and lowlevel cloud amounts during the studying period are63%,32%,15%, and 19%,respectively. The annual mean total clouds increased in the 1980s,peakedin the 1990s, and then dramatically decreased in 2000,with a decreasing tendency for the past 25 years; and this variation agrees well with the result of surface observations (Yuan and Tang, 2007). The annual meanhigh-level cloud amount has a statistically significantdecreasing trend of –2.2% sky cover per decade,whichplays a major role in the decrease of the total cloudamount. The annual mean mid-level clouds have thelowest frequency of occurrence and are the least invariant. The annual mean low-level cloud amount hasa unique increasing tendency of 0.8% sky cover perdecade.
 |
| Fig. 4.Time series and linear trends of(a)annual and (b–e)seasonal mean cloud amount from 1982 to 2006,averagedover the Yangtze River Delta. Thick lines indicate trends with significance at the 95% confidence level.(b)Spring:March,April, and May(MAM);(c)Summer: June,July, and August(JJA);(d)Autumn: September,October, and November(SON);(e)Winter: December,January, and February(DJF). |
Variations of seasonal mean cloud amounts areillustrated in Figs. 4b–e. High-level clouds have decreasing tendencies throughout the year while thelow-level cloud amount in summer shows a continuedgrowth,with the increasing trend of 3.0% sky coverper decade at the 95% confidence level(Fig. 4c).
The spatial distributions of linear trends in lowlevel cloud amount during summer are shown in Fig. 5a. The low-level cloud amount increases over the entire YRD and it is notable that the increasing trendover and around most urban areas is higher with relative maxima centers emerging west of Shanghai(SH).The lower trend values are located over Tai Lake witha water area of 2500 km2 and mountain areas coveredby forest(southwest of YRD). Meanwhile,this relativegrowth directly results in a smaller decrease of totalcloud amount over most urban areas(Fig. 5b: fromSH to northwest of Changzhou(CZ)). Additionally,the decrease extent of the high-level cloud amount issmaller over the southwest of the YRD(figure omitted) and therefore,the total cloud amount also has asmaller decreasing tendency over the mountain areas(Fig. 5b).
 |
| Fig. 5.Trends of summer mean(a)low-level and (b)total cloud amount for 1982–2006(interval: 0.4% sky coverper decade). The red contour lines indicate increasing trends and blue contour lines indicate decreasing trends. Theshaded areas indicate urban areas. NJ: Nanjing; CZ: Changzhou; WX: Wuxi; SZ: Suzhou; SH: Shanghai; HZ: Hangzhou.Trends of low-level clouds are at the 95% confidence level for most of the study areas while trends of total clouds are notsignificant for any areas. |
By further exploring the low-level cloudiness variations over different l and covers,we compare the differences of low-level cloud amounts in summer betweenurban agglomerations(black rectangular areas in Fig. 1b) and the adjacent rural areas including cropl and (red rectangular areas in Fig. 1b),Tai Lake, and forest,respectively(Fig. 6). Because the observationresolution(0.5°)is greater than the size of most citiesin this area, and the urban l and cover exp and ed dramatically in this analysis period,it is hard to obtainobservation data over a pure urban area. In our study,the urban cover fraction over each PATMOS-x grid iscalculated with 1-km resolution MODIS l and use data(Fig. 1b), and the urban-dominant grids(which meansa grid with urban cover fraction greater than 50%)areused to represent the trend for urban agglomerations.As for the cropl and area,it also includes some urbanl and use,such as small-size towns or cities, and theurban cover fraction over the selected cropl and areais less than 20% in our analysis. It is clearly evident that the low-level cloud amount increased overurban agglomerations at a faster rate than that overnon-urban areas. The increasing rate over urban agglomerations is much greater than those over bodiesof water and forest, and it is also greater than thatover the cropl and area. The trend over the cropl and is close to that over the urban area. There may betwo potential reasons: 1)the urban-dominant gridsused in our analysis usually include cropl and , and viceversa; 2)the selected cropl and areas are near urban agglomerations(Fig. 1b) and the influence of urbanization has a regional-scale impact in this area,asdemonstrated by previous studies(e.g.,Zhang N. et al., 2010). Further studies with higher resolution observations and state-of-the-art numerical modeling areneeded for a better explanation on this phenomenon.
 |
| Fig. 6.Changes of low-level cloud amount in summer over(a)urban agglomeration(black rectangular areas in Fig. 1b),(b)cropl and (red rectangular areas in Fig. 1b),(c)Tai Lake, and (d)forest areas. Thick lines indicate trends atthe 95% confidence level. |
The cloud process is very complex and impactedby many factors such as moisture,cloud condensationnuclei(CNN), and thermal excitation,especially whenconsidering the adequate water vapor supply from theoceans and densely vegetated l and cover in the YRD insummer. The key factors of cloud processes are relatedto CCN and thermal excitation. The CCN concentration increases due to the air pollutant release overurban area, and its impact on clouds is very uncertain. A large number of studies based on observations and models indicate that high concentrations of fineaerosol particles could increase cloud coverage by increasing the concentration of cloud droplets that notonly suppress rainfall in warm cloud but also augmentthe cloud top albedo (Rosenfeld, 1999,2000; Givati and Rosenfeld, 2004; Teller and Levin, 2006; Khain et al., 2008; Small et al., 2011). Other studies also findthat aerosols could reduce cloud cover as well: for example,hydrophilic aerosols may enhance precipitationin the ice phase and reduce the cloud cover (Lohmann,2002); absorbing aerosols(black carbon)could heatthe atmosphere by absorbing solar radiation,whichresults in reduced cloud formation and abbreviationof cloud lifetime (Ackerman et al., 2000; Small et al., 2011). All the previous studies show that the effectsof aerosols on cloud amount tend to be more on theglobal scale rather than regional or urban scales.
The most probable mechanism of the low-levelcloud increasing over the YRD in summer is thesurface heating excitation,especially when this areais currently undergoing rapid urbanization. Urbaninduced modifications in natural clouds may well bedue to the following causes (Cotton and Pielke, 2007):1)increases in anthropogenic aerosols effects; 2)theurban thermal effect on low-level convection and circulation; 3)increased low-level convergence downwindof the urban area caused by greater surface roughness; 4)changes of low-level atmospheric moisture content. In summer,the moisture is transported from theEast China Sea to the YRD under the prevailing wind(southeast wind) and the strongest UHI effect also appears in summer over the YRD (Du et al., 2007; ZhangK. X. et al., 2010),which may explain why the relative growth of low-level cloudiness over urban areas ismore remarkable during summer.
Many observational studies have proved that theapparent intensity increase of UHI over the YRD reflects the tendency of clusters of urban centers to forma large regional heat isl and (Chen et al., 2006; Du et al., 2007). Table 2 shows the heat isl and intensity ofthree typical cities during summer. It is found thatthe UHI intensity has dramatically increased since the1990s over all the three cities, and the correlation coefficient between the UHI intensity of Shanghai and thelow-level cloudiness over Shanghai is 0.57(p= 0.003).

Variations of seasonal and annual mean cloudamounts of different cloud types(including total cloud,high-level cloud,mid-level cloud, and low-level cloud)were examined and analyzed over the Yangtze RiverDelta(YRD),China,for the period 1982–2006 byusing a linear regression analysis. For the monthlyvariations,both total and high-level cloud amountspeak in June and reach a minimum in December. Incontrast,mid-level clouds have a peak during wintermonths and reach a minimum in summer while lowlevel clouds vary weakly throughout the year. Theannual averages of total,high-,mid-, and low-levelcloud amounts are 63%,32%,15%, and 19%,respectively. A decrease tendency in annual mean totalcloud amount is found,which is mainly driven by thedecreases of high-level clouds throughout the year.Mid-level cloud amounts occur least and remain invariant throughout the year,while the annual meanlow-level cloud increase is mainly caused by the significantly increasing trend in low-level cloud amountduring the summer.
In particular,the spatial and temporal variations of total and low-level cloud amounts in summer were further analyzed. Trends in the low-levelcloud amount during summer have conspicuous localdifferences: low-level cloud amount over urban agglomeration areas rises much faster than that overthe adjacent non-urban areas. This relative growthdirectly leads to a smaller decreasing tendency of thetotal cloud amount as observed over most urban areas(–0.4% sky cover per decade)than that over othernon-urban areas(–1.2% to –4% sky cover per decade).
In this study,we just provide the spatiotemporal characteristics of cloud amount over the YRD, and try to infer the possible urbanization thermal effect onthe low-level cloud. Given the complexity of the cloudphysical progresses,higher resolution observations and numerical simulations will be needed to verify the urbanization effect on clouds, and further quantitativeresearch is warranted to detect more examples of theseeffects.
Acknowledgments. We are grateful to theanonymous reviewers for their valuable comments.
| Ackerman, A. S., O. B. Toon, D. E. Stevens, et al., 2000: Reduction of tropical cloudiness by soot. Science, 288, 1042-1047, doi: 10.1126/science.288.5468.1042. |
| Chen, L. X., W. L. Li, W. Q. Zhu, et al., 2006: Sea-sonal trends of climate change in the Yangtze Delta and its adjacent regions and their formation mechanisms. Meteor. Atmos. Phys., 92, 11-23, doi: 10.1007/s00703-004-0102-y. |
| Clement, A. C., R. Burgman, and J. R. Norris, 2009: Observational and model evidence for positive lowlevel cloud feedback. Science, 325, 460-464, doi: 10.1126/science.1171255. |
| Cotton, W. R., and R. A. Pielke, 2007: Human Impacts on Weather and Climate. Cambridge University Press, New York, 330 pp. |
| Dong, X., B. Xi, K. Crosby, et al., 2010: A 10 year clima-tology of arctic cloud fraction and radiative forcing at Barrow, Alaska. J. Geophys. Res., 115(D17), D12124, doi: 10.1029/2009JD013489. |
| Du, Y., Z. Q. Xie, Y. Zeng, et al., 2007: Impact of urban expansion on regional temperature change in the Yangtze River Delta. Journal of Geographical Sciences, 17, 387-398, doi: 10.1007/s11442-007-0387-0. |
| Endo, N., and T. Yasunari, 2006: Changes in low cloudiness over China between 1971 and 1996. J. Climate, 19, 1204-1213, doi: 10.1175/JCLI3679.1. |
| Givati, A., and D. Rosenfeld, 2004: Quantifying precipitation suppression due to air pollution. J. Appl. Meteor., 43, 1038-1056, doi: 10.1175/1520-0450(2004)043<1038%3AQPSDTA>2.0.CO%3B2. |
| Heidinger, A. K., and M. J. Pavolonis, 2009: Gazing at cirrus clouds for 25 years through a split window. Part I: Methodology. J. Appl. Meteor. Climatol., 48, 1100-1116, doi: 10.1175/2008JAMC1882.1. |
| Kaiser, D. P., 1998: Analysis of total cloud amount over China, 1951-1994. Geophys. Res. Lett., 25, 3599-3602, doi: 10.1029/98GL52784. |
| —-, 2000: Decreasing cloudiness over China: An updated analysis examining additional variables. Geophys. Res. Lett., 27, 2193-2196, doi: 10.1029/2000GL011358. |
| Kennedy, A. D., X. Q. Dong, B. K. Xi, et al., 2010: Evaluation of the NASA GISS Single-Column Model simulated clouds using combined surface and satellite observations. J. Climate, 23, 5175-5192, doi: 10.1175/2010JCLI3353.1. |
| Khain, A. P., N. BenMoshe, and A. Pokrovsky, 2008: Factors determining the impact of aerosols on surface precipitation from clouds: An attempt at classification. J. Atmos. Sci., 65, 1721-1748, doi: 10. 1175/2007JAS2515.1. |
| Li, Y., R. Yu, Y. Xu, et al., 2004: Spatial distribution and seasonal variation of cloud over China based on ISCCP data and surface observations. J. Meteor. Soc. Japan, 82, 761-773, doi: 10.2151/jmsj.2004.761. |
| Li Qiang, Zhou Suoquan, Xiang Liang, et al., 2009: The analysis on temporal-spatial characters of urban agglomeration island effect in Hangzhou Bay. Bulletin of Science and Technology, 25, 395-418. (in Chinese) |
| Liang, F., and X. A. Xia, 2005: Long-term trends in solar radiation and the associated climatic factors over China for 1961-2000. Ann. Geophys., 23, 2425-2432, doi: 10.5194/angeo-23-2425-2005. |
| Lohmann, U., 2002: A glaciation indirect aerosol effect caused by soot aerosols. Geophys. Res. Lett., 29, 11-1-11-4, doi: 10.1029/2001GL014357. |
| Nieman, S. J., J. Schmetz, and W. P. Menzel, 1993: A comparison of several techniques to assign heights to cloud tracers. J. Appl. Meteor., 32, 1559-1568, doi: 10.1175/1520-0450(1993)032<1559: ACOSTT>2.0.CO;2. |
| Pavolonis, M. J., and A. K. Heidinger, 2004: Daytime cloud overlap detection from AVHRR and VIIRS. J. Appl. Meteor., 43, 762-778, doi: 10.1175/2099.1. |
| —-, —-, and T. Uttal, 2005: Daytime global cloud typing from AVHRR and VIIRS: Algorithm description, validation, and comparisons. J. Appl. Meteor., 44, 805-826, doi: 10.1175/JAM2236.1. |
| Qian, Y., D. P. Kaiser, L. R. Leung, et al., 2006: More frequent cloud-free sky and less surface solar radiation in China from 1955 to 2000. Geophys. Res. Lett., 33, L01812, doi: 10.1029/2005GL024586. |
| Qiu Xinfa, Gu Lihua, Zeng Yan, et al., 2008: Study on urban heat island effect of Nanjing. Climatic Environ. Res., 13, 807-814. (in Chinese) |
| Randall, D. A., and S. Tjemkes, 1991: Clouds, the earth's radiation budget, and the hydrologic-cycle. Global and Planetary Change, 90, 3-9, doi: 10.1016/0921-8181(91)900633. |
| Rosenfeld, D., 1999: TRMM observed first direct evidence of smoke from forest fires inhibiting rainfall. Geophys. Res. Lett., 26, 3105-3108, doi: 10.1029/1999GL006066. |
| —-, 2000: Suppression of rain and snow by urban and industrial air pollution. Science, 287, 1793-1796, doi:10.1126/science.287.5459.1793. |
| Rossow, B. R., and R. A. Schiffer, 1999: Advances in understanding clouds from ISCCP. Bull. Amer. Meteor. Soc., 80, 2261-2287, doi: 10.1175/1520-0477(1999)080<2261:AIUCFI>2.0.CO;2. |
| Small, J. D., J. H. Jiang, H. Su, et al., 2011: Relationship between aerosol and cloud fraction over Australia. Geophys. Res. Lett., 38, L23802, doi: 10.1029/2011GL049404. |
| Tang, Q. H., G. Y. Leng, and P. Y. Groisman, 2012: European hot summers associated with a reduction of cloudiness. J. Climate, 25, 3637-2644, doi: 10.1175/JCLI-D-12-00040.1. |
| Teller, A., and Z. Levin, 2006: The effects of aerosols on precipitation and dimensions of subtropical clouds: A sensitivity study using a numerical cloud model. Atmos. Chem. Phys., 6, 67-80, doi: 10.5194/acp-6-67-2006. |
| Thomas, S. M., A. K. Heidinger, and M. J. Pavolonis, 2004: Comparison of NOAA's operational AVHRRderived cloud amount to other satellite-derived cloud climatologies. J. Climate, 17, 4805-4822, doi: 10.1175/JCLI-3242.1. |
| Tiao, G. C., G. C. Reinsel, D. M. Xu, et al., 1990: Effects of autocorrelation and temporal sampling schemes on estimates of trend and spatial correlation. J. Geophys. Res., 95(D12), 20507-20517. |
| Warren, S. G., R. M. Eastman, and C. J. Hahn, 2007: A survey of changes in cloud cover and cloud types over land from surface observations, 1971-96. J. Climate, 20, 717-738, doi: 10.1175/JCLI4031.1. |
| Weatherhead, E. C., G. C. Reinsel, G. C. Tiao, et al., 1998: Factors affecting the detection of trends: Statistical considerations and applications to environmental data. J. Geophys. Res., 103(D14), 17149-17161. |
| Xi, B., X. Dong, P. Minnis, et al., 2010: A 10 year climatology of cloud cover and vertical distribution derived from both surface and GOES observations over the DOE ARM SGP Site. J. Geophys. Res., 115(D12), D12124, doi: 10.1029/2009JD012800. |
| Yuan Changhong and Tang Jianping, 2007: Regional climatic response of Jiangsu to global warming. |
| Journal of Nanjing University (Natural Sciences), 43, 655-669. (in Chinese) |
| Zhang, K. X., R. Wang, C. C. Shen, et al., 2010: Temporal and spatial characteristics of the urban heat island during rapid urbanization in Shanghai, China. Environ. Monit. Assess., 169, 101-112, doi: 10.1007/s10661-009-1154-8. |
| Zhang, N., Z. Q. Gao, X. M. Wang, et al., 2010: Modeling the impact of urban ization on the local and regional climate in Yangtze River Delta, China. Theor. Appl. Climatol., 102, 331-342, doi: 10.1007/s00704-010-0263-1. |
| Zhang, Y. L., B. Q. Qin, and W. M. Chen, 2004: Analysis of 40 year records of solar radiation data in Shanghai, Nanjing and Hangzhou in eastern China. Theor. Appl. Climatol., 78, 217-227, doi: 10.1007/s00704-003-0030-7. |