 2014, Vol. 28
The Chinese Meteorological Society
Article Information
- LIU Yunyun, LI Weijing, ZUO Jinqing, HU Zeng-Zhen. 2014.
- Simulation and Projection of the Western Pacific Subtropical High in CMIP5 Models
- J. Meteor. Res., 28(3): 327-340
- http://dx.doi.org/10.1007/s13351-014-3151-2
Article History
- Received 2013-10-19;
- in final form 2014-2-16


2 Climate Prediction Center, NCEP/NWS/NOAA, College Park 20740, USA
Western Pacific subtropical high(WPSH)is oneof the most important atmospheric circulation systemsover East Asia. Its variability in the location and intensityhas important impacts on the summer rainfallanomaly over China(Xu et al., 2001; Tao and Wei, 2006). Abundant moisture from the tropical oceanstransports to eastern China through the southerly flowfrom its western boundary,then converges with thecold air from the high latitude and conforms the front,causing rain belts at the northwestern margin of theWPSH and hot and drought summer under its coveredarea(Han and Wang, 2007). Clearly,its interannualvariability causes droughts and floods over EastChina(Wu et al., 2002),while its interdecadal variabilitymodulates the drought and flood pattern overEast Asia(Hu,1997; Xiong,2001). Liu et al.(2013)noted that the biennial component of the WPSH inintensity and zonal position also has the obvious interdecadaltransition in the late 1970s,with larger amplitudesduring the recent 30 years. As a result,greatattention has been given to variations of WPSH onthe interannual and interdecadal timescales,since underst and ingthe variations will help us to improve theforecast of summer climate anomaly in East Asia.
To simulate and project climate change,climatemodel becomes one of the main quantitative tools now.Due to a lot of uncertainties and biases in the climatemodels and in order to improve model simulations,the Coupled Model Intercomparison Project(CMIP)has been proposed by the World Climate ResearchProgram(WCRP). The last phase of CMIP(CMIP5)involves about 30 climate modeling groupsaround the world,aiming to advance our knowledge ofclimate variability and climate change and projection, and to provide simulations for evaluation in the IPCCFifth Assessment Report(AR5)(Taylor et al., 2012).Compared with the models used in the previous phaseof CMIP simulations(such as CMIP3),most modelsin CMIP5 have been improved in many aspects,includingphysical processes and coupled carbon cycle.Thus,it will be interesting to assess the performanceof CMIP5 models in the simulation of WPSH meanstate and variability. Also,it is meaningful to projectthe possible changes of WPSH under different climatewarming scenarios in the future.
In this work,the capacities of 26 CMIP5 modelsin simulating WPSH are evaluated from variousaspects based on a set of reconstructed indices thatdescribe the WPSH objectively(Liu et al., 2012). Itis expected to provide some valuable information forthe model development and improvement in the futureby comparisons between the simulations and observations, and among the models. Finally,the models withgood performance are identified and selected to projectthe possible evolution of WPSH in the future,whichis expected to provide implication for future trends ofthe East Asian summer climate over China. 2. Data and CMIP5 models
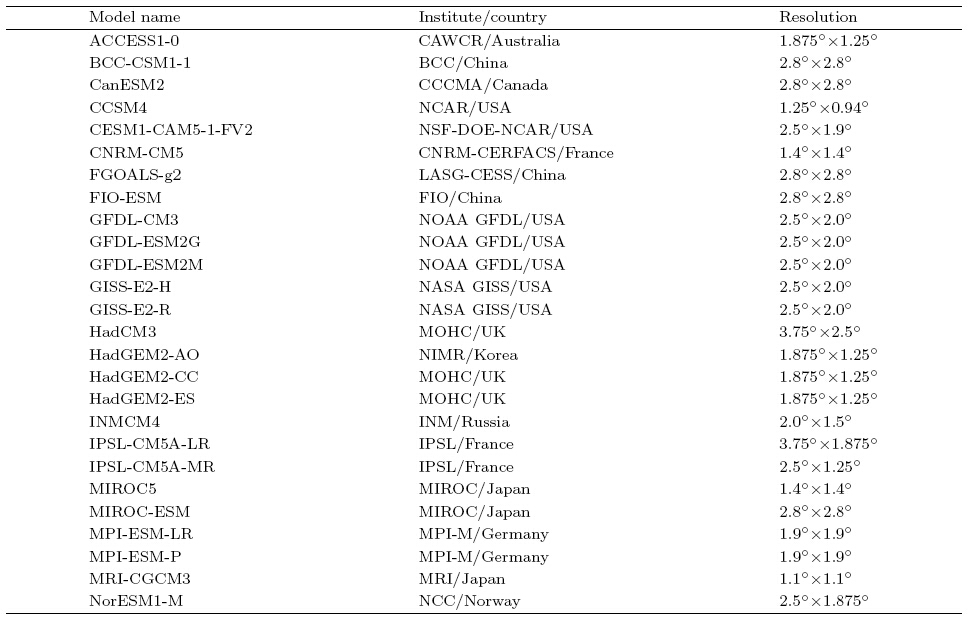
Table 1 gives the basic description of the 26 coupledclimate models participating in CMIP5. Thesimulation data used in this study include the datafrom two groups of model runs.(1)Historical runs,which are initiated from an arbitrary point of a quasiequilibriumcontrol run and integrated longer than 156yr(1850–2005). The historical run is forced by timeevolvinggreenhouse gases,ozone,aerosols, and a solar constant that are consistent with the observations, and for the first time,time-evolving l and cover/l and use pattern is included(Taylor et al., 2012).(2)Futureclimate change projection runs,which are forcedwith three typical representative concentration pathways(RCPs),i.e.,RCP2.6,RCP4.5, and RCP8.5. Everyemission scenario has a set of specified concentrationof greenhouse gases,aerosols and other chemistrygases, and l and cover/l and use pattern(Moss et al., 2010; Xin et al., 2012).
Atmospheric monthly reanalysis(Kalnay et al., 1996)provided by NCEP/NCAR and the ExtendedReconstructed SST dataset(ERSSTv3b)(Smith et al., 2008)from NOAA are used in this study. Hereafterwe refer to these observation-based datasets as observations.The analysis period of the historical runs and observations is from 1951 to 2005, and the period ofthe future projection runs is from 2006 to 2099. Themodel output atmospheric fields are interpolated tothe regular grids with a horizontal resolution of 2.5°× 2.5°, and SST fields are interpolated to the regulargrids with a horizontal resolution of 2° × 2° for facilitatingthe comparison among CMIP5 models.
Normally,WPSH is represented in the weatherchart as the region surrounded by the contour of 5880gpm at 500-hPa level within 10°–45°N,110°E–180°.In order to quantitatively describe the variation ofWPSH in the intensity and position,the monthlyWPSH indices are computed based on NCEP/NCARreanalysis,including the area,intensity,ridge line, and western boundary indices(Liu et al., 2012). It is wellknown that WPSH is strongest in summer,with significantimpacts on the summer rainfall over East Asia(Nitta and Hu, 1996; Wu et al., 2002). Therefore,wewill examine the WPSH in summer(June,July, and August)in terms of its spatial distribution,amplitudevariation, and interdecadal and interannual variations,while the entire time series of the monthly data is usedonly in power spectrum analysis.
To assess the model’s ability in simulating currentclimate,Taylor diagram(Taylor,2001)is usedto centralize multi-model related information. Thecorrelation coefficient between the model simulations and observations represents the model’s capability tosimulate climatic variability in the concerned region.The root-mean-square error(RMSE)indicates deviationof the model from the observations(the closerto zero the RMSE is,the higher simulation capabilitythe model has). The st and ard deviation ratio ofmodel simulation relative to the observation indicatesthe model’s ability in simulating the amplitude of variability.These three assessment indicators displayed ina Taylor diagram can reflect the overall performanceof the model. Therefore,Taylor diagram is used inthis study to evaluate the 26 CMIP5 models,whereboth the self-correlation coefficient and the st and arddeviation of the observations are 1, and RMSE is 0. 3. Climatology of WPSH 3.1 Spatial distribution
According to the definition of WPSH,the simulatedgeopotential height(H500) and zonal wind fieldsat 500 hPa(u500)by CMIP5 are examined first.Note that the model biases present in the spatial pattern,coverage,as well as intensity of WPSH relativeto the observations(Fig. 1). The simulated H500in CCSM4,CESM1-CM5, and FIO-ESM models isstronger than the observations,with a larger coveragearea surrounded by the 5880-gpm contour. In theother CMIP5 models,however,the simulated H500 ismuch weaker than the observations,without the 5880-gpm isoline over the subtropical western Pacific insummer when WPSH is seasonally strongest in the observation;even no 5840-gpm isoline presents at H500in HadGEM2-CC and IPSL-CM5A-LR models. Furthermore,the simulation of u500 = 0 m s−1 is notgood as well(figure omitted). Most of the models failto capture the position of the WPSH ridge line exceptthree models which reproduce the 5880-gpm contour.It is also noted that the simulated easterly wind belton the south of WPSH is much weaker than the observation.This is consistent with the overall weak WPSHsimulated by these models.
 |
| Fig. 1. Climatological means of H500 in summer from the observation(NCEP/NCAR reanalysis) and CMIP5 modelsimulations. Light and dark shaded areas denote H500 larger than 5840 and 5880 gpm,respectively. |
Systematic errors usually exist in the simulatedatmospheric circulation in current global atmosphereoceancoupled models(also known as the model climatedrift; Sun and Ding, 2008; Huang and Qu, 2009;Feng and Li, 2012). These biases in simulating theWPSH are common in most state-of-the-art GCMs,implying a challenge in simulating and predicting summerclimate variability over East Asia(Zhang and Chen, 2011a,b). Considering that the intensity and spatial pattern of WPSH are influenced by the thermalanomalies from underlying surface,especially thesea surface temperature(SST)in the tropical Pacific and Indian Ocean(Nitta,1987; Huang and Sun, 1994;Nitta and Hu, 1996; Wu et al., 2002),we plot theobserved and simulated climatological tropical SST insummer and the model biases relative to the observationsin Fig. 2. The result shows that the SST in bothtropical Pacific warm pool and Indian Ocean is above28℃ in summer,which is favorable to the maintenanceof the WPSH. However,compared to the observations,the simulated regions surrounded by the contourof SST = 28℃ in most CMIP5 models are muchsmaller,indicating cold biases in the tropical IndianOcean and Pacific warm pool. This consists with theunderestimated H500 over the western Pacific in thesimulations. Nevertheless,the three models(CCSM4,CESM1-CAM5, and FIO-ESM),which have producedrealistic H500,also reproduce the SSTs in the tropicalIndian and Pacific oceans with smaller cold biases.These results may suggest a connection in simulatingthe spatial distribution of tropical SST and in simulatingthe WPSH.
 |
| Fig. 2. Climatological mean of SST(contours; ℃)in summer from the observation(ERSSTv3b) and CMIP5 modelsimulations,with the model biases shaded. The contour interval is 2℃. The red line is isoline of 28℃. |
The Taylor diagram of the climatological H500over the western Pacific in summer compared to theobservation(Fig. 3a)shows that the simulations of thespatial pattern of H500 are similar to the observation,with the correlation coefficient above 0.96,even 0.99in 5 models. RMSEs of all models are within 1 gpm.The high correlations and small RMSEs indicate goodsimulations of the spatial distribution of H500 over thewestern Pacific. It is also noted that the amplitude ofH500 is also well captured,with st and ard deviationof the models ranging from 0.6 to 1.6 gpm. Figure 3b is the Taylor diagram of the simulated climatologicalu500. All of the correlation coefficients with theobservation are above 0.90,RMSEs are less than 0.5m s−1, and the st and ard deviations are from 0.5 to1.5 m s−1,which imply decent performances of the 26CMIP5 models in capturing the spatial distribution and amplitude of u500.
 |
| Fig. 3. Taylor diagrams of(a)simulated climatological H500 and (b)u500 over the western Pacific in summer comparedto the observation. REF indicates the reference value of 1. The radial distance of the model code pointing from theorigin is the st and ard deviation ratio of the model relative to the observation. The correlation coefficient of spatialpattern between model and observation is shown by the cosine of the azimuthal angle of model code point, and theirroot-mean-square error is given by the distance of model code pointing from the REF. |
We note that although there are significant modelbiases in simulating H500 and u500(Fig. 1),possiblyassociated with cold SST biases in the tropical Indian and Pacific oceans(Fig. 2),the spatial pattern and variability of H500 and u500 over the western Pacificare well reproduced in all of the 26 CMIP5 models(Fig. 3). To correct the climatology biases in the simulations,the simulated climatology of H500 and u500from all of the models is replaced by that from theobservations. In other words,all the model outputsare calibrated to the same climatic state, and then superimposedwith each model’s own variability of H500 and u500. For example,the calibration of H500 for amodel(the same in u500)is:
where hmodel represents an H500 simulation value froma specified model,hmodel represents the model climatologyof H500, and hncep denotes the climatology ofH500 from the observation. In the following,the verificationof WPSH is based on the outputs from climatologycalibrated runs. 4. Variability of WPSH 4.1 WPSH indices
To characterize the variability of WPSH in intensity and position objectively,Fig. 4 shows the 9-yr running mean time series of the WPSH indices,includingthe area,intensity,ridge line, and westernboundary indices from both observation and calibratedmodel simulations. The observation curvesshow that the area and intensity indices of WPSH increasesignificantly and the western boundary indexdecreases after the late 1970s,i.e.,WPSH becomesstronger and more westward-extending during the recent30 years. Such an interdecadal shift of WPSH hasalso been noted in previous works(Hu,1997; Huang et al., 2006; Zhao et al., 2007; Liu and Ding, 2012). Interestingly,there is a slightly downward trend in theobserved ridge line index(Fig. 4c),suggesting thatWPSH slightly shifts southward after the late 1970s,consistent with Nitta and Hu(1996) and Hu(1997).
 |
| Fig. 4. Time series of the WPSH indices in summer from the observation(thick black line) and calibrated modelsimulations(thin colored lines)for the period from 1951 to 2005.(a)Area index,(b)intensity index,(c)ridge line index, and (d)western boundary index. The thick blue line is the ensemble mean of the 26 CMIP5 models. |
Compared with the observations,all the calibratedmodel results capture the interdecadal shift ofWPSH in the late 1970s. In these simulations,theobserved greenhouse gases,ozone,aerosols, and solarconstant, and the variability of l and cover are alltaken into account in the models(Taylor et al., 2012).Thus,it is suggested that these external forcing factorsmay have played an important role in causing theinterdecadal variability of WPSH,although the internalvariability of the atmospheric circulation over thewestern Pacific may also be influenced by the localatmosphere-ocean interaction(Wang et al., 2005; Zhu and Shukla, 2013). 4.2 Interdecadal variability of WPSH in spatialpattern
To display visually the interdecadal shift ofWPSH in its spatial pattern,distributions of the contoursof H500 = 5880 gpm and u500 = 0 m s−1 averagedin two periods of 1951–1960 and 1996–2005 arecomputed and compared(Fig. 5). During the periodof 1951–1960,WPSH is relatively weaker and eastward,with the observed 5880-gpm contour between 20° and 30°N, and its western boundary no more than140°E(Fig. 5a). The observed ridge line is near 25°N,with a northeastern-southwestern direction(Fig. 5c).Most of the calibrated simulations are able to reproduceWPSH,i.e.,the 5880-gpm contour,much betterthan the model results before climatology calibration(Fig. 1). Unfortunately,there are still 10 models failingto capture the 5880-gpm contours. Compared withsimulation of the 5880-gpm contour line,the ridge linesof WPSH are better simulated,except near the coastl and of China of about 115°E.
 |
| Fig. 5. Distributions of the contour of(a,b)H500 = 5880 gpm and (c,d)u500 = 0 m s−1 averaged in(a,c)1951–1960 and (b,d)1995–2005 from the observation(thick black line) and calibrated model simulations(thin colored lines). |
In the period of 1996–2005,WPSH becomesstronger and more westward,the area of the observedWPSH increases,with its southern and northern bordersextending to 18° and 32°N, and the westernboundary to 135°E(Fig. 5b). The calibrated modelresults well simulate the interdecadal shift of WPSH.The area and intensity indices of WPSH increase significantlyrelative to the period of 1951–1960 in themodel simulations(Figs. 5b and 5d). 4.3 Linear trend and st and ard deviation ofWPSH indices
In order to quantitatively assess the capabilitiesof the CMIP5 models in simulatingWPSH indices,lineartrends of each WPSH index from all the CMIP5models are calculated,except for the ridge line index(trend too small)(see Fig. 6). The observed resultsshow that the linear ascending trend of WPSH area and intensity indices are more than 20% per decade, and the trend of the western boundary is –2.7% perdecade,at the significance level of 0.01. Compared tothe observations,all the models well simulate the tendencyof enhancing and westward extension of WPSHduring 1951–2005,but with large quantitative differences.Some are larger than the observation in the intensityofWPSH,such as IPSL-CM5A-LR and GFDLESM2G,while others are weaker than the observations,such as GFDL-CM3 and HadGEM2-ES. Takingall the three WPSH indices into account,it is foundthat the simulations of nine models,i.e.,CESM1-CAM5-1-FV2,CNRM-CM5,FGOALS-g2,FIO-ESM,HadCM3,HadGEM2-CC,MIROC-ESM,MPI-ESMP, and NorESM1-M,are better than others in capturingthe linear trend of WPSH indices.
 |
| Fig. 6. Linear trend coefficients of the WPSH indices in summer from the observation(black bar) and CMIP5 modelsimulations(grey bars)for the period 1951–2005.(a)Area index,(b)intensity index, and (c)western boundary index. |
The st and ard deviation of WPSH indices can beused to measure the capability of the models in simulatingthe interannual variability of WPSH. Figure 7 shows the simulated st and ard deviation ratio of theWPSH indices relative to the observations. The closer to 1 the ratio is,the better to simulate the interannualvariability of WPSH indices the model is. Thegrey bars in Fig. 7 denote the accumulated distancebetween the ratios of these four WPSH indices and the reference value of 1. The smaller the accumulateddistance is,the closer to observations the simulatedWPSH index is,which provides a measurement of themodel performance in simulating the overall feature ofWPSH. It is noted that most of the st and ard deviationratios of the calibrated simulations to the observations are larger than the reference value,indicating an overestimationof the amplitudes of WPSH indices in themodels. GFDL-ESM2M,MIROC5, and INMCM4models have relatively poor simulations in the interannualvariability of WPSH,because of the too large accumulatedratios in the GFDL-ESM2M and MIROC5, and the too small one in INMCM4. According toFig. 7,it is found that six models: ACCESS1-0,CanESM2,CNRM-CM5,FGOALS-g2,IPSL-CM5AMR, and MIROC-ESM,perform relatively better.
 |
| Fig. 7. St and ard deviation ratios of the simulated WPSH indices relative to the observation. The grey bars are theaccumulated distance of the st and ard deviation ratio of the four WPSH indices from the reference value of 1. The smallerthe grey bar is,the closer to the observation the simulated result is. |
The interannual variability is another importantfeature to describe the characteristics of WPSH. Figure 8 shows the power spectrum of the monthly WPSHintensity index in the entire analysis period from theobservation and 26 CMIP5 models. Considering thatseasonal variability of WPSH is more significant thanother timescales,a low-pass filter is firstly used to removethe seasonal variability(cycle of 11 months)fromthe raw data for highlighting the interannual signals.
 |
| Fig. 8. Power spectra(red solid line)of the monthly WPSH intensity index from the observation and CMIP5 modelsimulations. Blue dashed line indicates the 0.05 significance level of the red noise test. |
It is known that significant tropospheric biennialoscillation(TBO)exists over the East Asian monsoonregion on interannual timescales(Nitta and Hu, 1996). Being one of the dominant members of theEast Asian monsoon system,WPSH has a TBO componenton the interannual timescale as well(Liu et al., 2013). The observation shows that there are twointerannual periods,i.e.,the quasi-four-year(36–60-month) and the quasi-biennial-year(24–36-month)period, and both pass the 0.05 significance level of the rednoise test. The period of the quasi-biennial variationis consistent with the TBO component of WPSH and the monsoon rainfall in China(Chang and Li, 2000;Chang et al., 2000; Ding,2007). The power spectrain the CMIP5 model simulations exhibit obvious differencesfrom each other on the interannual timescales(Fig. 8). To some extent,only ACCESS1-0,GFDLCM3,HadGEM2-CC, and HadGEM2-ES can captureboth the quasi-four-year period and the TBO period.
Comparison of the 26 CMIP5 model simulationswith the observations shows that most of the simulatedH500 values in the western subtropical Pacificregion are weaker than observation, and even the calibratedresults of some models still fail to capturethe spatial and temporal characteristics of WPSH.According to the overall simulations of the distributionsof SST,H500, and u500, and the quantitativeassessment of the WPSH indices,it is noted thatCNRM-CM5,FGOALS-g2,FIO-ESM,MIROC-ESM, and MPI-ESM-P models are better than others. Dueto the unavailability of the MPI-ESM-P model for the RCP scenarios,the ensemble mean results of the fourmodels(CNRM-CM5,FGOALS-g2,FIO-ESM, and MIROC-ESM)are selected to project the evolution ofWPSH in the future under different RCP scenarios. 5. Possible changes of WPSH in different RCPscenarios
To investigate the possible changes of WPSH underthree typical RCP scenarios in the 21st century,long-term integration (2006–2099) of H500 and u500 from the four selected models is averaged firstly asthe climatological state, and then the anomaly of eachmodel is added to calculate the time series of theWPSH indices; an approach similar to that in Section2.2. Next,the 9-yr running mean of WPSH indicesfrom 2006 to 2099 under different RCP scenarios fromthese four models’ ensemble mean is used to projectthe possible changes of WPSH in the future. It isnoted that all the simulated area,intensity, and westernboundary indices of WPSH display significantlyinterdecadal variations in the different RCP scenarios(Fig. 9).
 |
| Fig. 9. Nine-yr running mean of the WPSH indices in summer from 2006 to 2099 under different RCP scenarios fromfour CMIP5 models’ ensemble mean.(a)Area index,(b)intensity index,(c)ridge line index, and (d)western boundaryindex. Shaded areas represent one st and ard deviation from the multi-model mean. |
Under the RCP2.6 scenario,both the WPSH area and intensity increase and extend westward obviously.After 2050,the linear trends of the WPSH area,intensity, and western boundary indices gradually approachzero. The linear ascending trends of WPSHunder the RCP4.5 scenario are similar to those underthe RCP2.6,but the period of significant growthlasts until about 2070, and then the growth trendsweaken. Similar long-term variations of WPSH showup with faster growth in the period and a relativelysmaller trend in the latter period under the RCP8.5scenario. Interestingly,the western boundary indexof WPSH maintains at 90°E since the late 2050s. Infact,the most western boundary of the 5880-gpm contourextends westward to the west of 90°E after thelate 2050s. In that case,the definition of the westernboundary of WPSH is limited as 90°E(Liu et al., 2012).
Overall,WPSH enlarges,strengthens, and extends westward under different RCP scenarios,withthe largest linear growth trend projected in RCP8.5,weakest in RCP2.6, and in between in RCP4.5. Theridge line of WPSH has no obvious long-term trendin the three RCP scenarios. These results have implicationsfor the attribution and projection of climatechanges in East Asia in using the CMIP5 model output. 6. Summary and discussion
The performances of 26 coupled climate modelsparticipating in the Coupled Model IntercomparisonProject Phase 5(CMIP5)in the simulation of thepresent-day temporal variability and spatial patternof the WPSH are assessed. Then,the ensemble meanof four selected models is used to project the futurepossible changes of WPSH under three typical representativeconcentration pathways(RCPs). The resultsare as follows.
(1)The intensity of WPSH is underestimated inmost CMIP5 model simulations,which may be associatedwith colder SST biases in the tropical Indian and western Pacific oceans in the models. Nevertheless,spatial distribution and variability of H500 and u500are reasonably captured. To eliminate the impact ofthe model climatology biases,the model climatology isreplaced with that of NCEP/NCAR reanalysis,whichmakes the model results more realistic, and withoutany change in temporal variability.
(2)The climatology-calibrated model results reproducethe observed interdecadal shift of WPSH(enhancement and westward extension after the late1970s). According to overall assessment of the WPSHindices,it is identified that CNRM-CM5,FGOALSg2,FIO-ESM,MIROC-ESM, and MPI-ESM-P havebetter performances than other models in simulatingthe WPSH.
(3)The selected models’ simulations suggest thatWPSH will enlarge,strengthen, and extend westwardunder the three RCP scenarios,with the highest lineargrowth trend projected in RCP8.5,in between in RCP4.5, and weakest in RCP2.6. The simulated ridgeline of WPSH has no obvious long-term trend in thescenarios.
It is easily noticed that the model defaults,suchas the systemic biases in the western subtropical regions,may affect the credibility of these projections.Thus,it is necessary to explore the reasons resultingin the biases as well as their connection with thecold biases of the models in the tropical Indian and western Pacific oceans. It is also an interesting topicto examine possible changes of the East Asian summerrain belt under the projection of strengthening and westward extending WPSH associated with theincreasing concentration of greenhouse gases in thefuture. Furthermore,the mechanism for the projectedenhancing and westward-extending WPSH under theglobal warming scenarios is also worthy of furtheranalysis.
Acknowledgments. Many thanks to thesupport of the National Innovation Team of ClimatePrediction of the China Meteorological Administration.Thanks also go to the contributionof the WCRP’s Working Group on CoupledModeling. NCEP/NCAR reanalysis and NOAAERSSTv3b data are downloaded from NOAA websiteat http://www.esrl.noaa.gov/psd/.
| Chang, C. P., and T. Li, 2000: A theory for the tropical tropospheric biennial oscillation. J. Atmos. Sci., 57, 2209-2224. |
| —-, Y. S. Zhang, and T. Li, 2000: Interannual and inter-decadal variations of the East Asian summer mon-soon and tropical Pacific SSTs. Part I: Roles of the subtropical ridge. J. Climate, 13, 4310-4325. |
| Ding, Y. H., 2007: The variability of the Asian summer monsoon. J. Meteor. Soc. Japan, 85B, 21-54. |
| Feng Juan and Li Jianping, 2012: Evaluation of IPCC AMIP models in simulating monsoon-like southwest Australian circulation. Climatic and Environ. Res., 17, 409-421. (in Chinese) |
| Han Jinping and Wang Huijun, 2007: Features of inter-decadal changes of the East Asian summer mon-soon and similarity and discrepancy in ERA-40 and NCEP/NCAR reanalysis. Chinese J. Geophys., 50, 1444-1453. (in Chinese) |
| Hu, Z.-Z., 1997: Interdecadal variability of summer cli-mate over East Asia and its association with 500-hPa height and global sea surface temperature. J. Geo-phys. Res., 102(D16), 19403-19412. |
| Huang Gang and Qu Xia, 2009: Meridional location of West Pacific subtropical high in summer in IPCC AR4 simulation. Trans. Atmos. Sci., 32, 351-359. (in Chinese) |
| Huang Ronghui and Sun Fengying, 1994: Impacts of the thermal state and the convective activities in the tropical western warm pool on the summer climate anomalies in East Asia. Chinese J. Atmos. Sci., 36, 673-685. (in Chinese) |
| —-, Cai Rongshuo, Chen Jilong, et al., 2006: Interdecal-dal variations of drought and flooding disasters in China and their association with the East Asian cli-mate system. Chinese J. Atmos. Sci., 30, 730-743. (in Chinese) |
| IPCC, 2007: Climate Change 2007: The Physical Scien-tific Basis. Solomon, S., D. Qin, M. Manning, et al., Eds., Cambridge University Press, Cambridge, United Kingdom and New York, NY, USA, 996 pp. Kalnay, E., M. Kanamitsu, R. Kistler, et al., 1996: The NCEP/NCAR 40-year reanalysis project. Bull. Amer. Meteor. Soc., 77, 437-472. |
| Liu, Y. Y., Y. H. Ding, H. Gao, et al., 2013: Tropospheric biennial oscillation of the western Pacific subtropi-cal high and its relationship with the tropical SST and atmospheric circulation anomalies. Chinese Sci. Bull., 58, 3664-3672. |
| Liu Yunyun and Ding Yihui, 2012: Analysis of the lead-ing modes of the Asian-Pacific summer monsoon system. Chinese J. Atmos. Sci., 36, 673-685. (in Chinese) —-, Li Weijing, Ai Wanxiu, et al., 2012: Reconstruction and application of the monthly western Pacific sub-tropical high indices. J. Appl. Meteor. Sci., 23, 414-423. (in Chinese) |
| Moss, R. H., J. A. Edmonds, K. A. Hibbard, et al., 2010: The next generation of scenarios for climate change research and assessment. Nature, 46, 747-756. |
| Nitta, T., 1987: Convective activities in the tropical western Pacific and their impact on the Northern Hemisphere summer circulation. J. Meteor. Soc. Japan, 65, 373-390. |
| —-, and Z.-Z. Hu, 1996: Summer climate variability in China and its association with 500-hPa height and tropical convection. J. Meteor. Soc. Japan, 74, 425-445. |
| Smith, T. M., R. W. Reynolds, T. C. Peterson, et al., 2008: Improvements to NOAA's historical merged land-ocean surface temperature analysis (1880-2006). J. Climate, 21, 2283-2296. |
| Sun Ying and Ding Yihui, 2008: Validation of IPCC AR4 climate models in simulating interdecadal change of East Asian summer monsoon. Acta Meteor. Sinica, 66, 765-780. (in Chinese) |
| Tao Shiyan and Wei Jie, 2006: The westward, northward advance of the subtropical high over the West Pacific in summer. J. Appl. Meteor. Sci., 17, 513-525. (in Chinese) |
| Taylor, K. E., 2001: Summarizing multiple aspects of model performance in a single diagram. J. Geophys. Res., 106(D7), 7183-7192. |
| —-, R. J. Stouffer, and G. A. Meehl, 2012: An overview of CMIP5 and the experiment design. Bull. Amer. Meteor. Soc., 93, 485-498. |
| Wang, B., Q. H. Ding, X. Fu, et al., 2005: Fundamental challenges in simulation and prediction of summer monsoon rainfall. Geophys. Res. Lett., 32, L15711. doi: 10.1029/2005GL022734. |
| Wu Guoxiong, Chou Jifan, Liu Yimin, et al., 2002: Dy-namics of the Formation and Variation of Subtrop-ical Anticyclones. Science Press, Beijing, 1-20. (in Chinese) |
| Xin Xiaoge, Wu Tongwen, and Zhang Jie, 2012: In-troduction of CMIP5 experiments carried out by climate system model. Adv. Climate Change Res., 8, 378-382. (in Chinese) |
| Xiong Anyuan, 2001: Analysis on background of climatic variation for extremely rainy over the middle reaches of the Yangtze River in the 1990s. J. Appl. Meteor. Sci., 12, 113-117. (in Chinese) |
| Xu Haiming, He Jinhai, and Zhou Bing, 2001: The fea-tures of atmospheric circulation during Meiyu onset and possible mechanisms for westward extension (northward shift) of Pacific subtropical high. J. Appl. Meteor. Sci., 12, 150-158. (in Chinese) |
| Zhang Hongfang and Chen Haishan, 2011a: Evaluation of summer circulation simulation over East Asia by 21 climate models. Part I: Climatology. Scientia Meteor. Sinica, 31, 119-128. (in Chinese) |
| —-and —-, 2011b: Evaluation of summer circulation simulation over East Asia by 21 climate models. Part II: Interannual variability. Scientia Meteor. Sinica, 31, 247-257. (in Chinese) |
| Zhao, P., Y. N. Zhu, and R. H. Zhang, 2007: An Asian-Pacific teleconnection in summer tropospheric tem-perature and associated Asian climate variability. Climate Dyn., 29, 293-303. |
| Zhu, J. S., and J. Shukla, 2013: The role of air-sea cou-pling in seasonal prediction of Asian-Pacific summer monsoon rainfall. J. Climate, 26, 5689-5697. |