 2014, Vol. 28
The Chinese Meteorological Society
Article Information
- Nobuo SUGIMOTO, HUANG Zhongwei. 2014.
- Lidar Methods for Observing Mineral Dust
- J. Meteor. Res., 28 (2) : 173-184
- http://dx.doi.org/10.1007/s13351-014-3068-9
Article History
- Received October 12, 2013;
- in final form January 27, 2014


2 College of Atmospheric Sciences, Lanzhou University, Lanzhou 730000, China
Lidars are useful for measuring distribution and optical characteristics of aerosols including mineraldust. In the study of the effects of mineral dust onclimate and the environment, it is essential to underst and dust emission, transport, deposition, radiativecharacteristics, and physical and /or chemical characteristics of dust acting as ice and cloud condensation nuclei. They are, however, extremely complicated. Dust emission is dependent on surface conditions such as l and cover, soil texture, moisture, vegetation growth, and dynamic condition (e.g., Wang et al., 2008, 2013) . The particle size distribution at dustemission is different depending on the source areas and surface conditions. The radiative characteristicsof dust are dependent on the chemical composition, size distribution and shape of dust, and they are different depending on source areas (e.g., Bi et al., 2010, 2012) . The characteristics of dust can change duringtransport due to internal mixing with other types ofaerosols and /or interaction with gaseous air pollutionspecies (e.g., Qiu and Sun, 1994; Zhou et al., 2002) .We may even need to know about bacilli on dust particles in the study of environmental effects.
Lidar methods can provide some essential information that other measurement methods cannot provide. Continuous vertical profile data obtained with even simple Mie scattering polarizationlidars are useful for validating dust transport models.Multi-wavelength Raman lidars and /or high-spectralresolution lidars can provide useful data for characterizing radiative properties that are essential for ev aluating the direct and semi-direct effect of mineral dust.Also, they can provide distributions of dust and cloudsthat can be useful for studying the semi-direct and in direct effect of mineral dust.
Recently, Mona et al. (2012) published a reviewpaper on desert dust characterization with lidars, and an overview of recent studies is presented. In thepresent paper, we do not intend to provide a comprehensive review of studies of dust using lidars. Instead, we introduce the studies on lidar methods and applications that have been conducted by the authors and discuss the problems and the directions of the futurestudies.2. Mie scattering and polarization lidar2.1 Mie sc attering lidar
Mie scattering or backscattering is the simplestlidar technique for measuring aerosols and clouds. Ittransmits laser pulses and receives the backscatteredlight from aerosols, atmospheric molecules, and clouds.The range to the scatterer is measured by the time of flight of the laser pulse, and the backscattering coefficient is derived from the intensity of the signal.Strictly speaking, however, there is attenuation of thelaser in the round-trip path to the scatterer, and theequation describing the lidar signal, so called the lidarequation, contains two unknown parameters, namely, the backscattering coefficient and the extinction coefficient. T o solve the lidar equation, we need to make anassumption on the relationship between the backscattering and the extinction coefficients. Therefore, it issometimes said that Mie scattering lidars cannot makequantitative measurements. It is true that the lidarequation cannot be solved without assumptions, butMie scattering lidars can provide sufficiently quantitative parameters with reasonable assumptions. Also, we may say that Mie scattering lidars can providequantitative constraints, for example, to the analysiswith chemical transport models.
In the data analysis of Mie scattering lidars, theF ernald's method considering two scattering components (aerosols and molecules) (Fernald, 1984) and the Klett's method considering a single scatteringcomponent (Klett, 1981) are usually used. F ernald'smethod is suitable for optically thin cases. In F ernald'smethod, the extinction to backscatter ratio (lidar ratio) S1 is introduced for aerosol scattering. We usually make an assumption of constant lidar ratio (forexample S1 = 50 sr, at 532 nm) , however, S1 is dependent on the types of aerosols. It is about 20 srfor sea salt, and it can be as large as 100 sr for lightabsorbing aerosols like black carbon. The error in thederived extinction coefficient or the backscattering coefficient due to the error in the assumption of the S1value is dependent on the density of observed aerosols (Sasano and Nakane, 1984) . In clear conditions, theerror in derived backscattering coefficient is small, and the derived backscattering coefficient is not sensitiveto the S1value. In dense aerosol conditions, the errorin the extinction coefficient is smaller. In very denseaerosol cases, Klett's method can provide extinctioncoefficient profiles quite well. It is sometimes said incorrectly that Mie scattering lidar can measure thebackscattering coefficient (not extinction coefficient) , but it is approximately correct only in clear conditions.If aerosol optical depth (AOD) is obtained from separate measurements with sun photometers or from thecalibrated Mie scattering lidar itself using the Rayleighscattering signal above the aerosol layer, a method using AOD as a constraint can be used. With such amethod, the column averaged S1can be determined (Welton et al., 2001) .
There are two approaches in pulsed Mie scattering lidars, i.e., the traditional large-pulse-energy lowrepetition-rate approach (typically 10 Hz and 100 mJ) (Collis and Russell, 1976) and the small-pulse-energyhigh-repetition-rate (micro pulse lidar) approach (typically 1 kHz and 1 ¹J) (Spinhirne, 1993) . Eye-safetyis the advantage of the latter approach. There arealso continuous wave (CW) lidar methods like r and ommodulation CW lidar (Takeuchi et al., 1983) . However, CW methods generally suffer from the background radiation noise in daytime measurements. Miescattering lidars are widely used, and there are severalcommercial lidar systems. Ceilometers are also kindsof Mie scattering lidar.2.2 Polarization lidar
The polarization lidar method is a simple extension of the Mie scattering lidar method adding a polarization analyzer to the receiver. It is extremely usefulfor detecting non-spherical particles like mineral dust, because the change in the polarization state by scattering (or the depolarization ratio) is very sensitiveto the non-sphericity of the scatteres (Sassen, 1991; Murayama et al., 1999) . Usually, a linearly polarizedlaser beam is transmitted, and parallel and perpendicular polarization components of the received signalare analyzed. We define the depolarization ratio (total depolarization ratio or volume depolarization ratio) by TDR = Ps/Pp, where Pp and Psare the parallel (co-polar) and perpendicular (cross-polar) ("s"st and s for German "senkrecht") polarization components of the received signal. The depolarization ratio can be also defined for the circularly polarizedtransmitted beam. In commercial micro pulse lidar (MPL4) , co-polar component is taken with circularlypolarized beam, and cross-polar component is takenwith linearly polarized beam. We experimentally compared the linear depolarization ratio derived from anMPL4 and that measured with a linear polarization lidar. The results agreed within the measurement error (Huang Z. W. et al., 2010a) .
Because the volume depolarization ratio containsthe scattering contribution of Rayleigh scattering ofatmospheric molecules, we need to define the particledepolarization ratio (PDR) that represents the depolarization ratio for aerosol scattering. PDR is derivedby Eq. (1) (Liu et al., 2002) .
where TDR is the total depolarization ratio, BR istotal backscattering to Rayleigh backscattering ratio, and MDR is the depolarization ratio of Rayleigh scattering. MDR is approximately 0.014 (Behrendt and Nakamura, 2002) .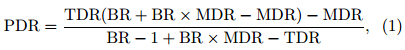
We developed a method using the particle depolarization ratio to estimate contributions of nonspherical and spherical aerosols in the extinction coefficient (Sugimoto et al., 2002, 2003; Shimizu et al., 2004) . This method is based on the assumption of external mixing of the two types of aerosols, namely mineral dust having a large PDR and spherical aerosolshaving a small PDR. The contribution of mineral dustin the extinction coefficient (or backscattering coefficient) is estimated with the following equation.
where δ is observed PDR, and δ1 and δ2are PDRsof dust and spherical aerosols, respectively . We define the dust extinction coefficient and the sphericalaerosol extinction coefficient by multiplying R or (1-R) to the extinction coefficient derived with the F ernald's or Klett's method. These methods are usefulfor analyzing dust and air pollution aerosols in urbanarea and the down wind regions. The errors caused bythe assumed lidar ratio and PDR values were studiedby Shimizu et al. (2011) , and it was shown that thederived dust extinction coefficient was not sensitive tothe assumptions when the density was high. The erroris less than 10% in typical dust events.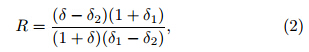
Figure 1 shows an example of the analysis usingthis method. In the lidar time-height indications inFig. 1, distributions of dust and spherical aerosols (airpollution aerosols) are clearly separated. The numberconcentrations of particles with diameter larger than0.4 and 4 μm measured with an optical particle counterare also shown in Fig. 1. It can be seen that there iscorrelation between the dust extinction coefficient and the number of large particles. In Beijing, heavy airpollution is often observed before dust event as seenin Fig. 1. It is explained by the change in wind direction due to the movement of pressure systems.

|
| Fig. 1. The extinction coe±cient time-height indications at 532 nm for (a) non-spherical aerosols and (b) spherical aerosols derived with the method using the depolarization ratio, compared with (c) the optical particle counter data. Note that the lower blue curve in (c) was shifted from the upper blue one for comparing the temporal variation of number concentration, aiming to show large increases of coarse particles during the dust event (Sugimoto et al., 2008) . |
Networking of Mie scattering polarization lidarsis a powerful method for observing three-dimensionaldistributions and movement of dust and other aerosols.At NIES (National Institute for Environmental Studies) , we formed a network of two-wavelength (1064 and 532 nm) Mie scattering and polarization (532 nm) lidars in East Asia in cooperation with other researchinstitutes and universities. The network is namedthe Asian Dust and aerosol lidar observation Network (AD-Net) , and currently 20 lidar stations are operatedcontinuously (http://www-lidar.nies.go.jp/AD-Net/) .AD-Net is a contributing network to the World Meteorological Organization (WMO) Global Atmosphere Watch (GA W) program. We have developed a realtime data processing system for AD-Net, and can derive the dust and spherical aerosol extinction coefficients at 532 nm as well as the attenuated backscattering coefficients at 532 and 1064 nm and the total depolarization ratio at 532 nm in near realtime (Shimizu et al., 2010) .
The data from AD-Net are used in various researches on Asian dust and regional air pollution. Oneof the important applications of AD-Net data is validation and assimilation of chemical transport models. Afour-dimentional variational data assimilation systembased on the Chemical weather FORecasting System (CFORS) was developed by Kyushu University withAD-Net dust extinction coefficient data, and analysesof Asian dust events were performed (Uno et al., 2008; Yumimoto et al., 2007, 2008, 2012; Hara et al., 2009; Sugimoto et al., 2010, 2011, 2013) . In the data assimilation, a dust emission factor was introduced tocontrol the emission of each grid in the dust sourceareas. The dust emission factor represents the changein surface condition that is not considered in the original model. The results of the data assimilation experiments showed that the modeled dust distributionwas much improved with the assimilation of AD-Netdata. The results also showed that the data assimilation was useful for estimating the amount of dust emission in the source areas. Figure 2 shows an example ofassimilated dust extinction coefficient compared withthe dust extinction coefficient derived from CALIPSO (see Section 5 for annotation) . We applied the samedata analysis method used for AD-Net to CALIPSOlevel-1B data to derive the dust and spherical aerosolextinction coeffcients. The comparison demonstratedthat the model assimilated with AD-Net data reproduced the dust distribution up to far-down wind regions. It was also demonstrated that the data assimilated model reproduced surface PM10data very well.F urthermore, the change in dust emission due to vegetation growth that was not considered in the originalmodel was revealed with the data assimilation (Sugimoto et al., 2010) .

|
| Fig. 2. The extinction Dust extinction coefficient calculated with CFORS assimilated with AD-Net data (pink contours) compared with CALIPSO dust extinction coe±cient. Lines T-1, T-2, and T-3 are tra jectories. Panel (b) indicates dust extinction coe±cient profile along tra jectory T-1 calculated by the data assimilated CFORS (Uno et al., 2008) . Panels (a) , (c) , and (d) show CALIPSO dust extinction coe±cient for 5-8 May , and Panel (e) represents dust extinction coe±cient caculated by CFORS model. |
The dust and spherical aerosol extinction coefficient data have also been used in studies of climatologyof aerosols in East Asia (Hayasaka et al., 2007; Hara et al., 2011) and in epidemiological studies of the effect ofdust aerosols on human health (Kanatani et al., 2010; Kashima et al., 2012; Onishi et al., 2012; Ueda et al., 2012) . Using the lidar data in epidemiological studies, we investigated the relationship between the dust and spherical aerosol extinction coefficients and various mass concentration measurements, namely TSP, PM10, SPM, and PM2:5. The ratio of mass concentration to the dust extinction coefficient depends onthe size distribution of dust, and it changes spatially and temporally . However, there is a high correlationbetween the dust extinction coefficient and the massconcentration of dust in PM2:5 (Sugimoto et al., 2011; Kaneyasu et al., 2012) . The relationship between theextinction coefficient and mass concentration is complicated for spherical aerosols because of hygroscopicgrowth of particles (Sugimoto et al., 2008; Liu et al., 2013) . Some of the epidemiological studies (e.g., Onishi et al., 2012) showed that the effect of dust wasenhanced when mixed with air pollution aerosols. Itis therefore important to underst and mixture state ofAsian dust with air pollution aerosols in the futurestudies.
Studies using a network of lidars were also conducted in arid region (Huang et al., 2008a; Huang Z.W. et al., 2010b) . Distribution features of Asian dustin dust events and climatological features such as diurnal variations of dust vertical profile were studied.3. Raman and high-spectral-resolution lidars
Raman scattering lidars and high-spectralresolution lidars are techniques for measuring profileof molecular scattering. Since the vertical distributionof atmospheric molecules is known, the extinction coefficient of aerosols can be derived from the attenuation term of the molecular scattering profile (Gao et al., 2009; Wang et al., 2011) . In Raman scattering, nitrogen vibrational Raman scattering is usually used for aerosol extinction measurements. In high-spectral-resolution lidars, Rayleigh scattering (strictlyspeaking, Cabannes scattering) is used (She, 2001) .Both Mie scattering and Rayleigh scattering are elastic scattering, and the wavelength of scattered light isthe same as the transmitted laser wavelength. However, the spectral width of the scattered light isdifferent. The Rayleigh scattering has much widerDoppler broadening due to the molecular movementin the atmosphere. Consequently, the Mie and Rayleigh scattering components can be separated using a high-resolution spectroscopic element. The technique is called high-spectral-resolution lidar (HSRL) .The HSRL method requires a narrow-b and laser and ahigh-resolution spectroscopic element such as an interferometer, but the Rayleigh scattering cross-section isseveral orders of magnitude higher than Raman scattering. HSRLs are much sensitive compared to Ramanlidars, and daytime measurements are possible withrelatively small lidar systems (Hua et al., 2004, 2005) .The HSRL technique can also be used in space-bornelidars.
With Raman lidar or HSRL methods, the extinction coefficient is obtained independently from thebackscattering coefficient. The profile of lidar ratio isconsequently determined from the measurement. Thelidar ratio is a useful parameter for characterizingaerosols because it is sensitive to the absorption ofaerosols (imaginary part of refractive index) and theshape of aerosols. The lidar ratio measurement is alsouseful for distinguishing aerosols and clouds (Sakai et al., 2003) . The extinction and backscattering measurements at multiple wavelengths add independentparameters sufficient for deriving the aerosol microphysical parameters. MÄuller et al. (2000) developedan inversion method to determine the single scattering albedo, effective radius, etc., from two-wavelengthRaman (532 and 355 nm) and three-wavelength Mie (355, 532, and 1064 nm) lidar. The method has beenused for characterizing mineral dust aerosols (MÄuller et al., 2010b, 2013) .
At NIES, we constructed an HSRL at 532 nmusing an iodine filter as a blocking filter for Mie scattering (Liu et al., 1999) and studied the lidar ratio of Asian dust (Liu et al., 2002) . We also added a nitrogen Raman receiver channel to the AD-Net lidars atprimary stations (Xie, 2008) . Recently, we developeda multi-wavelength HSRL that measures the extinction coefficient at 2 wavelengths (355 and 532 nm) , thebackscattering coefficient at 3 wavelengths (355, 532, and 1064 nm) , and the depolarization ratio at 2 wavelengths (532 and 1064 nm) (Nishizawa et al., 2012) . Atthe same time, we have developed data analysis methods for the multi-parameter lidars for deriving the concentrations of aerosol components (Nishizawa et al., 2008, 2010) . We consider four aerosol components inthe analysis of Raman lidars and HSRLs, namely, optically non-absorptive small aerosols (such as sulfate) , optically non-absorptive large spherical aerosols (seasalt) , non-spherical aerosols (dust) , and optically absorptive small aerosols (black carbon) . We assume anaerosol optical model for each component (refractiveindex, size distribution, and shape for dust) and searchfor the external mixture that best reproduces the observed parameters. In this approach, appropriatenessof the definition of the aerosol components and theiroptical models is essential. The approach is reasonable if the aerosol components are compatible withthat used in chemical transport models.4. Qualtz Raman and fluorescence lidars
We observed Raman scattering of quarts in dustparticles with a lidar with 532-nm excitation (Tatarov and Sugimoto, 2005) . Later measurement was performed at 355 and 532 nm simultaneously, and theRaman scattering signal was confirmed by the wavelength dependence of signal intensity (MÄuller et al., 2010a) .
We also observed fluorescence of aerosols with excitation at 355 nm (Sugimoto et al., 2012a, b) . Figure 3 shows examples of fluorescence spectrum. Wefound that Asian dust was highly fluorescent. It is, however, still not understood what substance (somemineral composition or biological substance on Asi and ust) emits fluorescence. We think that it will be use-ful to compare the fluorescence spectra excited at 266 and 355 nm in the future study for identifying the fluorescent substance. We also found that aerosols transported from urban and industrial areas often emittedfluorescence. We consider that polycyclic aromatic hydrocarbon (P AH) compounds in aerosols emit fluorescence. We presented the idea of using the efficiencyof broadb and fluorescence for characterizing opticallyabsorptive aerosols (Sugimoto et al., 2012a) . We alsoshowed that the intensity of the broadb and fluorescence was comparable to that of nitrogen vibrationalRaman scattering, and a compact lidar system couldbe used for the broadb and fluorescence measurements.The measurement is, however, limited in the nighttimebecause of solar background radiation.

|
| Fig. 3.Examples of the fluorescence spectra for aerosol and clouds (Sugimoto et al., 2012a) |
Lidar observ ations from space are extremely useful for observing aerosols and clouds globally . Thefirst experiment of atmospheric lidar observation fromspace was LITE (Lidar In-Space Technology Experiment) conducted by U. S. National Aeronautics and Space Administration (NASA) in 1994 using the SpaceShuttle. Mie scattering lidar experiments were performed at 3 wavelengths (355, 532, and 1064 nm) .Based on the achievement of LITE, lidar satellitesGLAS (Geoscience Laser Altimeter System) (launchedin 2003) and CALIPSO (Cloud-Aerosol Lidar and Infrared Pathfinder Satellite Observations) (launched in2006) were developed. CALIPSO has continued observ ation normally for more than 7 yr. According tothe CALIPSO web site, more than 880 scientific papers using CALIPSO data have been published up topresent. A number of studies have been carried outwith CALIPSO on mineral dust emission and transport (e.g., Huang et al., 2007; Hara et al., 2008; LiuZ. Y. et al., 2008) , optical characteristics of dust (e.g., Zhou et al., 2013) , and the effects of mineral dust onradiation and cloud (e.g., Huang et al., 2006, 2010; Xia and Zong, 2009; Wang et al., 2010) . Liu Donget al. (2008) presented a height-resolved global distribution of dust aerosols for the first time based onthe first year of CALIPSO lidar measurements undercloud-free conditions. Uno et al. (2009) studied anAsian dust event where dust was transported one full circuit around the globe in 13 days using CALIPSO, ground-based lidars, and a chemical transport model.Sekiyama et al. (2010) reported data assimilation ofCALIPSO aerosol data for the first time. Also, thereare a number of studies on data analysis method forCALIPSO. Chen et al. (2010) , for example, developed dust detection algorithm combining the lidar CALIOP (Cloud-Aerosol Lidar with OrthogonalPolarization) and passive IIR (Imaging Infrared Radiometer) on CALIPSO.
Figure 4 shows an example of long-range transport path of dust particles observed by CALIPSO lidar. The result indicates that dust aerosols originatedfrom the T aklimakan desert can also be transported toeastern China through alternative paths (blue lines inFig. 4) . The paths at higher altitudes are dominatedby the westerly but the lower-altitude tra jectories aredetermined by regional weather systems and topography .

|
| Fig. 4.Examples of long-range transport path of dust aerosols observed by CALIPSO lidar. A dust event thatoriginated in the Taklimakan desert on 7 May 2007 was transported to the Pacific Ocean. Red lines represent back tra jectories initialized over the western Pacific; blue lines represent back tra jectories initialized over central China. The vertical images (curtain files) show the CALIPSO 532-nm total attenuated backscatter. The color scales on the left represent topographical elev ation (Huang et al., 2008b) . |
EarthCARE (Earth Clouds, Aerosols and Radiation Explorer) is being developed jointly by JapanAerospace Exploration Agency (JAXA) and EuropeanSpace Agency and planned for launch in 2016. EarthCARE has a lidar named A TLID and a cloud profilingradar (CPR) on the same platform. A TLID is a polarization sensitive 355-nm HSRL. It will provide theextinction coefficient, backscattering coefficient, and depolarization ratio at 355 nm. At NIES, we are developing an aerosol component retriev al algorithm forA TLID based on the same method developed for multiparameter Raman and high-spectral-resolution lidars (Nishizawa et al., 2013) .
Multi-wavelength HSRL is being studied byNASA for the Aerosol-Cloud-Ecosystems (ACE) mission planned for launch in 2021 (e.g., Hosteler et al., 2012) . NASA also plans the Cloud-Aerosol T ransportSystem (CA TS) on the International Space Station (McGill et al., 2012) . CA TS is scheduled for launch in2014. CA TS has three wavelengths and experimentson HSRL are planned at 532 nm. CA TS is expectedto fill the gap between CALIPSO and ACE.6. Conclusions
Lidar methods provide essential information forunderst and ing s and dust storm phenomena and theirimpacts on climate and the environment. Continuousobserv ations of vertical profiles with networks of ground-based lidars provide useful data on emission and transport of mineral dust. Data assimilation ofchemical transport model is a powerful method toextract full information from the lidar data. Opticalcharacteristics of dust particles derived from multiwavelength Raman lidars or HSRLs are useful forestimating radiative effects of mineral dust. Networkobserv ations with multi-parameter lidars can be usefulfor studying the changes in characteristics of mineraldust during transport. Lidar methods like fluorescencelidar can provide additional information on composition of dust and biological substance on dust particles.
Internal mixing of dust and other aerosols is important both in the radiative effects and the effectson the environment and human health. Reliable optical models that describe the optical characteristicsof mineral dust and internally mixed mineral dust areessential for data analysis of multi-parameter lidars and for the calculation of radiative effects. The experimental studies combining multi-parameter lidars, in-situ instruments, and chemical and microscopicanalyses with aerosol sampling will be needed to underst and the phenomena and to make such opticalmodels. At the same time, the studies on h and linginternal mixture in chemical transport models are required. Advances in chemical transport models and lidar data analysis methods should be closely linked.We expect that they will merge in data assimilationin the future.
Acknowledgments: We would like to thankDr. Jianping Huang at Lanzhou University for discussions and critical reading of the manuscript
| Behrendt, A., and T. Nakamura, 2002: Calculation of the calibration constant of polarization lidar and its dependency on atmospheric temperature. Opt. Express, 10, 805-817. |
| Bi, J. R., J. P. Huang, Q. Fu, et al., 2010: Toward cha- racterization of the aerosol optical properties over Loess Plateau of northwestern China. J. Quant. Spectrosc. Radiat. Transf., 112, 346-360. |
| —-, —-, —-, et al., 2012: Field measurement of clear-sky solar irradiance in Badain Jaran Desert of northwestern China. J. Quant. Spectrosc. Radiat. Transf., 122, 194-207. |
| Chen, B., J. Huang, P. Minnis, et al., 2010: Detection of dust aerosol by combining CALIPSO active lidar and passive IIR measurements. Atmos. Chem. Phys., 10, 4241-4251. |
| Collis, R. T. H., and P. B. Russell, 1976: Lidar measurement of particles and gases by elastic backscattering and differential absorption. Laser Monitoring of the Atmosphere, Topics in Applied Physics, 14, 71-151. |
| Fernald, F. G., 1984: Analysis of atmospheric lidar observations: Some comments. Appl. Opt., 23, 652-653. |
| Gao Fei, Song Xiaoquan, Wang Yufeng, et al., 2009: Ultraviolet Raman lidar for high accurate profiling of aerosol extinction coefficient. Chinese Opt. Lett., 7, 95-97. |
| Hara, Y., I. Uno, K. Yumimoto, et al., 2008: Summertime Taklimakan dust structure. Geophys. Res. Lett., 35, L23801, doi: 10.1029/2008GL035630. |
| —-, K. Yumimoto, I. Uno, et al., 2009: Asian dust outflow in the PBL and free atmosphere retrieved by NASA CALIPSO and an assimilated dust transport model. Atmos. Chem. Phys., 9, 1227-1239. |
| —-, I. Uno, A. Shimizu, et al., 2011: Seasonal characteristics of spherical aerosol distribution in eastern Asia: Integrated analysis using ground/space-based lidars and a chemical transport model. SOLA, 7, 121-124, doi: 10.2151/sola.2011-031. |
| Hayasaka, T., S. Satake, A. Shimizu, et al., 2007: Vertical distribution and optical properties of aerosols observed over Japan during ABCEAREX2005. J. Geophys. Res., 112, D22S35, doi: 10.1029/2006JD008086. |
| Hosteler, C. A., R. A. Ferrare, J. W. Hair, et al., 2012: Airborne multi-wavelength high spectral resolution lidar for process studies and assessment of future satellite remote sensing. AGU Fall Meeting, A13K- 0336. |
| Hua, D., M. Uchida, and T. Kobayashi, 2004: Ultraviolet high-spectral-resolution Rayleigh-Mie lidar with a dual-pass Fabry-Perot etalon for measuring atmospheric temperature profiles of the troposphere. Opt. Lett., 29, 1063-1065. |
| —-, —-, and —-, 2005: UV Rayleigh-Mie lidar for daytime temperature profiling of the troposphere. Appl. Opt., 44, 1315-1322. |
| Huang, J. P., B. Lin, P. Minnis, et al., 2006: Satellite-based assessment of possible dust aerosols semi-direct effect on cloud water path over East Asia. Geophys. Res. Lett., 33, doi: 10.1029/2006GL026561. |
| —-, P. Minnis, Y. H. Yi, et al., 2007: Summer dust aerosols detected from CALIPSO over the Tibetan Plateau. Geophys. Res. Lett., 34, L18805, doi: 10.1029/2007GL029938. |
| —-, Zhang Wu, Zuo Jinqing, et al., 2008a: An overview of the semi-arid climate and environment research observatory over the Loess Plateau. Adv. Atmos. Sci., 25, 906-921. |
| —-, P. Minnis, B. Chen, et al., 2008b: Long-range transport and vertical structure of Asian dust from CALIPSO and surface measurements during PACDEX. J. Geophys. Res., 113, D23212, doi: 10.1029/2008JD010620. |
| —-, —-, H. Yan, et al., 2010: Dust aerosol effect on semiarid climate over Northwest China detected from ATrain satellite measurements. Atmos. Chem. Phys., 10, 6863-6872. |
| Huang, Z. W., N. Sugimoto, J. Huang, et al., 2010a: Comparison of depolarization ratio measurements with micro-pulse lidar and a linear polarization lidar in Lanzhou, China. Proc. 25th Int. Laser Radar Conf., St. Petersburg, Russia, 528-531. |
| —-, J. P. Huang, J. R. Bi, et al., 2010b: Dust aerosol vertical structure measurements using three MPL lidars during 2008 China—U.S. joint dust field experiment. J. Geophys. Res., 115, D00K15, doi: 10.1029/2009JD013273. |
| Kanatani, K. T., I. Ito, W. K. Al-Delaimy, et al., 2010: Desert-dust exposure is associated with increased risk of Asthma hospitalization in children. Am. J. Respir. Crit. Care Med., 182, 1475-1481, doi: 10.1164/rccm.201002-0296OC. |
| Kaneyasu, N., N. Sugimoto, A. Shimizu, et al., 2012: Comparison of lidar-derived dust extinction coefficients and the mass concentrations of surface aerosol. J. Japan. Soc. Atmos. Environ., 47, 285-291. (in Japanese) |
| Kashima, S., T. Yorifuji, T. Tsuda, et al., 2012: Asian dust and daily all-cause or cause-specific mortality in western Japan. Occup. Environ. Med., 69, 908- 915, doi: 10.1136/oemed-2012-100797. |
| Klett, J. D., 1981: Stable analytical inversion solution for processing lidar returns. Appl. Opt., 20, 211-220. |
| Liu Dong, Wang Zhien, Liu Zhaoyan, et al., 2008: A height resolved global view of dust aerosols from the first year CALIPSO lidar measurements. J. Geophys. Res., 113 (D16) , doi: 10.1029/2007JD009776. |
| Liu, X. G., J. Li, Y. Qu, et al., 2013: Formation and evolution mechanism of regional haze: A case study in the megacity Beijing, China. Atmos. Chem. Phys., 13, 4501-4514, doi: 10.5194/acp-13-4501-2013. |
| Liu, Z. Y., I. Matsui, and N. Sugimoto, 1999: Highspectral-resolution lidar using an iodine absorption filter for atmospheric measurements. Opt. Engineering, 38, 1661-1670. |
| —-, N. Sugimoto, and T. Murayama, 2002: Extinction- to-backscatter ratio of Asian dust observed by highspectral-resolution lidar and Raman lidar. Appl. Opt., 41, 2760-2767. |
| —-, D. Liu, J. Huang, et al., 2008: Airborne dust distri- butions over the Tibetan Plateau and surrounding areas derived from the first year of CALIPSO lidar observations. Atmos. Chem. Phys., 8, 5045-5060. |
| McGill, M., E. Welton, J. Yorks, et al., 2012: CATS: A new earth science capability. The Earth Observer, 24, 4-8. |
| Mona, L., Z. Liu, D. Mu¨ller, et al., 2012: Lidar measurements for desert dust characterization: An overview. Adv. Meteor., 2012, 1-36, doi: 10.1155/2012/356265. |
| Muller, D., U. Wandinger, and A. Ansmann, 2000: Microphysical particle parameters from extinction and backscatter lidar data by inversion with regularization: Experiment. Appl. Opt., 39, 1879-1892. |
| —-, I. Mattis, B. Tatarov, et al., 2010a: Mineral quartz concentration measurements of mixed mineral dust/urban haze pollution plumes over Korea with multiwavelength aerosol Raman-quartz lidar. Geophys. Res. Lett., 37, L20810, doi: 10.1029/2010GL044633. |
| —-, A. Ansmann, V. Freudenthaler, et al., 2010b: Mineral dust observed with AERONET Sun photometer, Raman lidar, and in-situ measurements during SAMUM 2006: Shape-dependent particle properties. J. Geophys. Res., 115, D11207, doi: 10.1029/2009JD012523 |
| —-, I. Veselovskii, A. Kolgotin, et al., 2013: Vertical profiles of pure dust and mixed smoke-dust plumes inferred from inversion of multiwavelength Raman/polarization lidar data and comparison to AERONET retrievals and in-situ observations. Appl. Opt., 52, 3178-3202. |
| Murayama, T., H. Okamoto, N. Kaneyasu, et al., 1999: Application of lidar depolarization measurement in the atmospheric boundary layer: Effects of dust and sea-salt particles. J. Geophys. Res., 104, 31781- 31792. |
| Nishizawa, T., N. Sugimoto, I. Matsui, et al., 2008: Algorithm to retrieve aerosol optical properties from high-spectral-resolution lidar and polarization Mie-scattering lidar measurements. IEEE Trans. Geosci. Rem. Sens., 46, 4094-4103. |
| —-, —-, —-, et al., 2010: Algorithms to retrieve optical properties of three-component aerosols from twowavelength backscatter and one-wavelength polarization lidar measurements considering nonsphericity of dust. J. Quant. Spectrosc. Radiat. Transf., 112, 254-267, doi: 10.1016/j.jqsrt.2010.06.002. |
| —-, N. Sugimoto, I. Matsui, et al., 2012: Development of two-wavelength high-spectral-resolution lidar and application to shipborne measurements. Proc. 26th Int. Laser Radar Conf., Porto Heli, Greece. |
| —-, A. Higurashi, N. Sugimoto, et al., 2013: Develop- ment of aerosol and cloud retrieval algorithms using ATLID and MSI data of EarthCARE. AIP Conf. Proc., 1531, 472, doi: 10.1063/1.4804809. |
| Onishi, K., S. Kurosaki, S. Otani, et al., 2012: Atmospheric transport route determines components of Asian dust and health effects in Japan. Atmospheric Environment, 49, 94-102, doi: 10.1016/j.atmosenv.2011.12.018. |
| Qiu Jinhuan and Sun Jinhui, 1994: Optically remote sensing of the dust storm and results analysis. Chinese J. Atmos. Sci., 18, 1-10, doi: 10.3878/j.issn.1006- 9895. (in Chinese) |
| Sakai, T., T. Nagai, M. Nakazato, et al., 2003: Ice clouds and Asian dust studied with lidar measurements of particle extinction-to-backscatter ratio, particle depolarization, and water-vapor mixing ratio over Tsukuba. Appl. Opt., 42, 7103-7116. |
| Sasano, Y., and H. Nakane, 1984: Significance of the ex- tinction/backscatter ratio and the boundary value term in the solution for the two-component lidar equation. Appl. Opt., 23, 11-13. |
| Sassen, K., 1991: The polarization lidar technique for cloud research: A review and current assessment. Bull. Amer. Meteor. Soc., 72, 1848-1866 . |
| Sekiyama, T. T., T. Y. Tanaka, A. Shimizu, et al., 2010: Data assimilation of CALIPSO aerosol observations. Atmos. Chem. Phys., 10, 39-49. |
| She, C. Y., 2001: Spectral structure of laser light scattering revisted. Band widths of nonresonant scattering lidars. Appl. Opt., 40, 4875-4884. |
| Shimizu, A., N. Sugimoto, I. Matsui, et al., 2004: Contin- uous observations of Asian dust and other aerosols by polarization lidar in China and Japan during ACE-Asia. J. Geophys. Res., 109, D19S17, doi: 10.1029/2002JD003253. |
| —-, —-, and —-, 2010: Detailed description of data processing system for lidar network in East Asia. Proc. 25th Int. Laser Radar Conf. St. Petersburg, Russia, 911-913. |
| —-, —-, —-, et al., 2011: Relationship between Lidarderived dust extinction coefficients and mass concentrations in Japan. SOLA, 7A, 1-4. |
| Spinhirne, J. D., 1993: Micro pulse lidar. IEEE Trans. Geosci. Rem. Sens., 31, 48-55. |
| Sugimoto, N., I. Matsui, A. Shimizu, et al., 2002: Observation of dust and anthropogenic aerosol plumes in the Northwest Pacific with a two-wavelength polarization lidar on board the research vessel Mirai. Geophys. Res. Lett., 29, doi: 10.1029/2002GL015112. |
| —-, I. Uno, M. Nishikawa, et al., 2003: Record heavy Asian dust in Beijing in 2002: Observations and model analysis of recent events. Geophys. Res. Lett., 30, 1640, doi: 10.1029/2002GL016349. |
| —-, I. Matsui, A. Shimizu, et al., 2008: Lidar network observations of troposheric aerosols. Proc. SPIE, 7860, 71530A, doi: 10.1117/12.806540. |
| —-, Y. Hara, K. Yumimoto, et al., 2010: Dust emission estimated with an assimilated dust transport model using lidar network data and vegetation growth in the Gobi desert in Mongolia. SOLA, 6, 125-128, doi: 10.2151/sola.2010-032. |
| —-, Y. Hara, A. Shimizu, et al., 2011: Comparison of surface observations and a regional dust transport model assimilated with lidar network data in Asian dust event of March 29 to April 2, 2007. SOLA 7A, 013-016, doi: 10.2151/sola.7A-004. |
| —-, Z. Huang, T. Nishizawa, et al., 2012a: Fluorescence from atmospheric aerosols observed with a multi-channel lidar spectrometer. Opt. Express, 20, 20800-20807, doi: 10.1364/OE.20.020800. |
| —-, —-, —-, et al., 2012b: Study of fluorescence of atmospheric aerosols using a lidar spectrometer. Proc. SPIE, 8526, 852607, doi: 10.1117/12.977177. |
| —-, Y. Hara, A. Shimizu, et al., 2013: Analysis of dust events in 2008 and 2009 using the lidar network, surface observations and the CFORS model. AsiaPacific J. Atmos. Sci., 49, 27-39. |
| Takeuchi, N., N. Sugimoto, H. Baba, et al., 1983: Random modulation CW lidar. Appl. Opt., 22, 1382- 1386. |
| Tatarov, B., and N. Sugimoto, 2005: Estimation of quartz concentration in the tropospheric mineral aerosols using combined Raman and high-spectral-resolution lidars. Opt. Lett., 30, 3407-3409. |
| Ueda, K., A. Shimizu, H. Nitta, et al., 2012: Long- range transported Asian dust and emergency ambulance dispatches. Inhal. Toxicol., 24, 858-867, doi: 10.3109/08958378.2012.724729. |
| Uno, I., K. Yumimoto, A. Shimizu, et al., 2008: 3D structure of Asian dust transport revealed by CALIPSO and a 4DVAR dust model. .Geophys. Res. Lett., 35, L06803, doi: 101029/2007GL032329. |
| —-, K. Eguchi, K. Yumimoto, et al., 2009: Asian dust transported one full circuit around the globe. Nature Geosci., 2, doi: 10.1038/NGEO583. |
| Wang, W. C., J. P. Huang, P. Minnis, et al., 2010: Dusty cloud properties and radiative forcing over dust source and downwind regions derived from A-Train data during the Pacific Dust Experiment. J. Geophys. Res., 115, doi: 10.1029/2010JD014109. |
| Wang, X., S. J. Doherty, and J. P. Huang, 2013: Black carbon and other light-absorbing impurities in snow across northern China. J. Geophys. Res.-Atmos., 118, 1471-1492, doi: 10.1029/2012jd018291. |
| Wang, X., J. P. Huang, M. X. Ji, et al., 2008: Variability of East Asian dust events and their longterm trend. Atmos. Environ., 42, 3156-3165, doi: 10.1016/j.atmosenv.2007.07.046. |
| Wang, Y. F., D. X. Hua, J. D. Mao, et al., 2011: A detection of atmospheric relative humidity profile by UV Raman lidar. J. Quant. Spectrosc. Radiat. Transf., 112, 214-219, doi: 10.1016/j.jqsrt. |
| Welton, E. J., J. R. Campbel, J. D. Spinhirnec, et al., 2001: Global monitoring of clouds and aerosols using a network of micro-pulse lidar systems. Proc. SPIE, 4153, 151-158. |
| Xia, X. A., and X. M. Zong, 2009: Shortwave versus longwave direct radiative forcing by Taklimakan dust aerosols. Geophys. Res. Lett., 36, L07803, doi: 10.1029/2009GL037237. |
| Xie, C. B., T. Nishizawa, N. Sugimoto, et al., 2008: Characteristics of aerosol optical properties in pollution and Asian dust episodes over Beijing, China. Appl. Opt., 47, 4945-4951. |
| Yumimoto, K., I. Uno, N. Sugimoto, et al., 2007: Adjoint inverse modeling of dust emission and transport over East Asia. Geophys. Res. Lett., 34, L08806, doi: 10.1029/2006GL028551. |
| —-, —-, —-, et al., 2008: Adjoint inversion modeling of Asian dust emission using lidar observations. Atmos. Chem. Phys., 8, 2869-2884. |
| —-, —-, —-, et al., 2012: Size-resolved adjoint inversion of Asian dust. Geophys. Res. Lett., 39, L24807, doi: 10.1029/2012GL053890. |
| Zhou, J., G. M. Yu, C. J. Jin, et al., 2002: Lidar observations of Asian Dust over Hefei, China, in Spring of 2000. J. Geophys. Res., 107, doi: 10.1029/2001JD000802. |
| Zhou, T., J. P. Huang, Z. W. Huang, et al., 2013: The depolarization-attenuated backscatter relationship for dust plumes. Opt. Express, 21, 15195-15204, doi: 10.1364/OE.21.015195. |