 2014, Vol. 28
The Chinese Meteorological Society
Article Information
- YU Jinhua, FU Hao, TANG Sheng, SHENG Siwei. 2014.
- Diagnosis of the Secondary Circulation of Tropical Storm Bilis (2006) and the Effects of Convective Systems on Its Track
- J. Meteor. Res., 28(2): 252-267
- http://dx.doi.org/10.1007/s13351-014-3059-x
Article History
- Received August 2, 2013;
- in final form January 28, 2014


The secondary circulation(SC)of a tropical cyclone(TC)consists of convergent inflow in the boundary layer, tilted updrafts near the eyewall, and divergent outflow in the upper troposphere. Althoughthe scale of an SC is much smaller than the scale ofthe background horizontal circulation, its structure directly influences the distribution of rainfall in the TC. The SC plays an important role in TC development, including setting up the three-dimensional structureof the TC circulation. The SC is a key component ofthe multi-scale interaction between cumulus convection and the TC circulation that leads to TC development(Charney and Eliassen, 1964; Ovyama, 1964; Montgomery and Kallenbach, 1997).
The forced axisymmetric SC has often been analyzed using Eliassen s quasi-balanced vortex theory(Eliassen, 1952). Schubert and Hack(1982)used thisdiagnostic method to study the features of a thermally forced SC in frictionless axisymmetric balance, whileShapiro and Willoughby(1982)used it to calculatethe SC associated with spot sources of heat and momentum in a nonlinearly balanced TC. These studiesdeepened the theoretical underst and ing of the dynamics of axisymmetric SCs in TCs.
Potential vorticity(PV)inversion is widely usedto diagnose three-dimensional flow fields given the distribution of PV, nonlinear balance(NLB), and appropriate boundary conditions(Hoskins et al., 1985). This technique is based on the conserv ation of PV under frictionless adiabatic conditions. Piecewise PV inversion(Davis and Emanuel, 1991)has been successfully applied in analyses of TC formation, includingthe impact of latent heat release on TCs(Davis, 1992), interactions among PV anomalies(Huo et al., 1999), and the effects of these anomalies on TC movement(Wu and Emanuel, 1995a, b). This technique requiresthat PV be greater than zero to satisfy the ellipticequation requirement, which can make it inconvenientin application. Wang and Zhang(2003)proposed thePV-ω diagnostic system as an extension of piecewisePV inversion based on the balanced flow obtained byinverting the PV and NLB equations. PV-ω inversioncan be used to diagnose vertical motion and the divergent wind field, yielding a quasi-balanced flow. Thistechnique is useful for solving the nonlinear balanceelliptic equations and for diagnosing the effects of latent heat release, dynamic processes(such as thoseassociated with environmental vertical wind shear), orfriction on TCs. Zhang and Kieu(2006)used the PV-ω diagnostic system to study how Hurricane Andrew(1992)was influenced by its SC. They found that theSC forced by shear reduced the destructive effects oflarge-scale vertical wind shear on Andrew(1992)byapproximately 40%. Zhong et al. (2008)used PV-ωinversion to study characteristics of the quasi-balancedflow in Hurricane Bonnie(1998), a strong asymmetrichurricane. Kieu and Zhang(2010)extended the algorithm developed by Wang and Zhang(2003)to enable application to more than one PV anomaly(PV A)piece. Wu et al. (1996)proposed the theory of slantwise vorticity development(SVD), which has beenwidely applied in studies of monsoons and rainstorms. Bilis(2006)was a strong tropical storm thatformed at 0600 UTC 9 July 2006 in the western NorthPacific(centered at 13. 4° N, 137° E). Bilis reached itspeak intensity at 0600 UTC 12 July with a maximumsurface wind speed of 30 m s-1. Satellite images showthat Bilis had an asymmetric structure, with a partialeyewall during most time of its lifecycle. Bilis broughtheavy precipitation to Hunan, Guangxi, Guangdong, and Jiangxi provinces after making l and fall in F ujian, and caused enormous and widespread damage. Previous studies have examined precipitation processeswithin this TC(Shi et al., 2009; Yu et al., 2010). Yu et al. (2010) used observ ations of precipitation rate fromthe TRMM Microwave Imager(TMI)to analyze howvertical wind shear affected the distribution of precipitation associated with Bilis. They identified twoheavy precipitation features within the storm. Thefirst feature was an asymmetric area of heavy precipitation located down-shear of the vertical wind shear. The second feature was an area of heavy rainfall offsetfrom the center of the storm. The latter feature hadtwo relatively unique characteristics: the partial eyewall was located relatively far away from the centerof the storm(the radius of maximum wind was 150-200 km), and the strongest precipitation was locatedin the spiral rainb and s.
The relationships between vertical wind shear and the SC of a strong asymmetric TC have not previouslybeen diagnosed in detail. T o what extent can PV-ω inversion be used to diagnose the characteristics of theSC in such a special case? Which factor caused Bilisto change its direction of motion from southward tonorthward? We show the contributions of latent heatrelease, environmental vertical wind shear, and frictionon the SC circulation associated with Bilis. We furtheremploy the extended PV-ω inversion system proposedby Kieu and Zhang(2010)to study the effects of SCrelated vertical wind shear on the amplitude of environmental wind shear and investigate the influence ofmesoscale convective systems on Bilis track. 2. Data and method
2. 1 Data
The physical variables used for calculations and diagnoses are taken from the output of a Weather Re-search and F orecasting(WRF)model simulation at a10-min resolution. The model is run by using a vortexfollowing horizontal grid with three nested domains. The coarse grid contains 164 × 144 cells at a 36-km resolution, the middle grid contains 277 × 262 cells(zonal× meridional)at a 12-km resolution, and the fine gridcontains 400 × 400 cells at a 4-km resolution. The vertical grid consists of 28 sigma levels. The initial and boundary conditions for the simulation are taken fromthe Japan Meteorological Agency operational analysis(20-km horizontal resolution)using the regional spectral model and the NCEP/NCAR global final(FNL)analysis(1° × 1° ). Both datasets are provided at 6-hinterv als. The Betts-Miller-Janjic(BMJ)convectiveparameterization is used to represent convection inthe two outer domains(Betts and Miller, 1986; Janjic, 1994). The Y onsei University boundary layer scheme(Hong et al., 2006), the Hong single-moment microphysics scheme(Hong and Lim, 2006), and the RapidRadiative T ransfer Model(RR TM)longwave radiation(Mlawer et al., 1997) and Dudhia shortwave radiation(Dudhia, 1989)schemes are used in all domains. Thesimulation covers the period from 0000 UTC 10 to1800 UTC 16 July 2006. The path and intensity of thestorm simulated by the model are consistent with 6-hTC best track observ ations of Bilis produced by theChina Meteorological Administration(Fig. 1). The PV-ω inversion is performed by using the WRF modeloutput at 10-min interv als on a 97 × 97-cell area ofthe middle domain(12-km resolution).
 |
| Fig. 1. Simulated(solid line) and observed(dashed line)(a)track and (b)intensity(m s-1)of tropical storm Bilisfrom 0000 UTC 11 to 1800 UTC 16 July 2006. |
We briefly introduce the PV-ω inversion methodhere; detailed descriptions have been provided previously by Wang and Zhang(2003) and Kieu and Zhang(2010). Ertels potential vorticity formula under hydrostatic and non-divergent conditions is
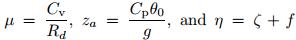
 is pseudo-density, z =
  is a pseudo-height coordinate, p0 is the reference pressure, θ0 is the reference potentialtemperature, p0 is the reference density, ψ is streamfunction, and is geopotential height. Equation(1)accounts for the effects of humidity and precipitation. PV(denoted here as q)can be directly calculated fromthe physical variables output by the model using Eq. (1). The flow and mass fields can be ev aluated byiteratively calculating Eqs. (1) and (2)which is the nonlinear balance equation derived fromthe divergence equation(including the frictional effectsfr).
Equations(1) and (2)may be highly nonlinear, soa unique solution may not always be obtainable. T osolve this problem, Wang and Zhang(2003)linearizedvariables by decomposing the total TC flow into a reference state and a perturbation component. The balanced solution of Eqs. (1) and (2)requires the flow tobe inertially and statically stable; however, instantaneous model fields do not always satisfy these stabilityrequirements. Wang and Zhang(2003)addressed thisproblem by setting the vertical component of absolutevorticityη to be slightly positive(i. e., η > 0. 1f) and adjusting the vertical structure of virtual potential temperature θpso that  (where N2 = 10-4s-1is the buoyancy frequency).
We perform the PV-ω inversion using the modeloutput on the middle domain(with 12-km resolution). The computation is performed on a subset of 97 ×97 grid cells that covers a region of 1164 km × 1164km. The model output is interpolated in the verticaldirection from the native non-uniform 28 sigma levels onto a uniform 33-layer pseudo-height coordinate. The total flow field of the storm is decomposed intoan axisymmetric reference state and an asymmetricperturbation component to linearize the solution. Wefirst convert all three-dimensional variables from theCartesian coordinate system(x, y, z)to the polar coordinate system(r, λ, z), where the origin of the horizontal coordinate system is defined to be the center ofthe storm. The axisymmetric reference state is definedby averaging each physical variable in the azimuthaldirection on each pseudo-height level z. This referencestate satisfies the gradient wind balance. The disturbance q'is defined as the original PV field minus thereference state. Wang and Zhang(2003)circumventedthe ellipticity requirement by incorporating a parameter ε(v aries between 0 and 1)into the nondimensionalequations
and where the overbar represents an azimuthal average(the axisymmetric reference state) and a prime denotes a(asymmetric)perturbation from the referencestate.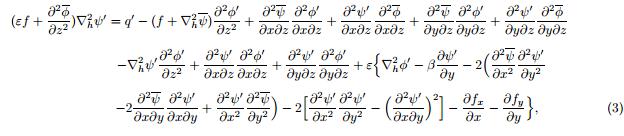
We obtain the perturbation field ψ' and φ 'by iteratively solving Eqs. (3) and (4)sub ject to the boundary conditions
and where zB and zTrepresent the z coordinates of thebottom and top boundaries, respectively,
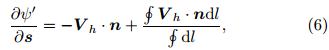
 is the perturbation equiv alent potential temperature, l is the path along the lateral boundaries, s is a vector tangentto that path, and n is a vector normal to that path. Adding the perturbation field ψ' and φ 'to the reference field ψ and φ (which is in gradient wind balance)gives the total field ψ and φ . The inverted disturbancebased on the PV-ω inversion and the total physicalfields both satisfy the nonlinear balance equation and have the characteristics of balanced flows. Including the divergent component of wind causesthe balanced flow to differ from its conventional balance definition. It is therefore more appropriate toconsider the resulting three-dimensional flow as quasi-balanced, with the associated divergent componentpresumably in \slow manifold". SCs in TCs may result from the balanced flow(i. e., ψ and φ )or froma variety of other dynamical and physical processes(e. g., friction or diabatic heating). Wang and Zhang(2003)proposed that the vertical velocity ω and thedivergent wind could be diagnosed using the vorticity, thermodynamic, and nonlinear balance equations asbases; namely, where
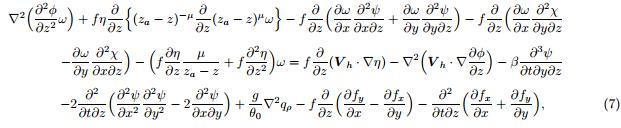
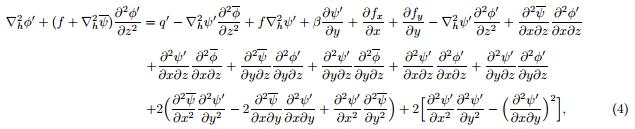
 . Theright h and side of the equation contains the differential of vorticity advection, the Laplacian of thermaladvection by both non-divergent and divergent winds, the fi effect, the differential deformation(or Jacobian)term, latent heating, and frictional effects(which comprise the last two terms), respectively . The first fourterms on the right h and side are related to dynamicprocesses associated with vertical shear and obtainedfrom analysis of the nonlinear balance and PV equations. The divergent wind also plays an important rolein the advection of various fluid properties. The finalthree terms on the right h and side are important physical processes that affect the divergent wind and theamplitude of the SC, which in turn feed back onto theintensity of the first four terms on the right h and side. The physical variables(i. e., the non-adiabatic heatingrate qp and the frictional terms ƒ x and ƒ y)are taken from the output of the model simulation.
 The time tendency  in Eq. (7)is derived bysolving the vertical vorticity equation

 and
and  )are taken from the output of the model simulation. The physical variable χ in Eq. (7)is the potential speed. This variable indicates divergence and radial flow within the TC and can be derived via the continuity equation asEquations(7), (8), and (9)constitute a closed set ofequations for determining ω , χ , and
 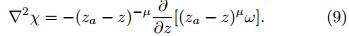 for a quasibalanced flow with given distributions of diabatic heating and friction. This system enables us to calculate the vertical velocity and the convergent(or divergent)component of the horizontal wind field underquasi-balanced conditions. The solution forms a threedimensional quasi-balanced flow that expresses the basic characteristics of the underlying vortex, organized and long-lived deep convection, and strong convergentor divergent motion. The reference pressure p0 at thebottom boundary is set to 998 hPa, and the area ofcentral pressure in the eye of Bilis is prescribed to be990 hPa. The inversion is computed using model output at 10-min interv als. We then average the resultshourly for comparison with the hourly-mean model results. This procedure allows us to test the accuracy ofthe inversion.
 We compute the large-scale steering flow by firstaveraging zonal and meridian winds from the WRFsimulation over a round domain with a radius of 720km centered at the center of tropical storm Bilis ateach level. We then perform a mass-weighted meanof the steering flow between 800 and 300 hPa. Thesecondary steering flow due to mesoscale convectivesystems is obtained by applying a similar method tothe wind field obtained from the PV inversion. 3. Features of the quasi-balanced flow
We use the state of the storm at 1500 UTC 11 July 2006 to study whether the PV-ω inversion is capable of describing the structures of the quasi-balancedflow and the asymmetric storm. The shear at thistime was directed from northeast to southwest with amagnitude of 13. 2 m s-1. We compare radial-verticalcross-sections of azimuthally averaged tangential velocity, PV, and updraft velocity from the WRF output and the inversion results. The latter consists of the directly inverted perturbation plus the reference state, same for both the mass and wind fields. The radialvertical cross-section of azimuthally averaged tangential velocity(Fig. 2a)shows that the wind speed wassmall in the eye of the storm. The largest tangential winds were located near the top of the boundary layer(about 1-2-km altitude)approximately 150-200 km away from the center of the storm. The ra-dius of maximum wind shifted outward with increasingheight. The cross-section of the azimuthally averagedcirculation diagnosed from the PV inversion is similar to that obtained from direct analysis of the modeloutput(Figs. 2a and 2b), although the magnitude ofthe inverted wind is only about 80% of the model estimate. Figure 2c shows the radial distribution of azimuthally averaged tangential wind component withwavenumber 0 at 1-km altitude(the approximate vertical location of the maximum tangential wind), as wellas the amplitudes of the corresponding perturbationswith wavenumbers 1, 2, and 3. The tangential windsof wavenumbers 1-3 were obtained by performing azimuthal F ourier decomposition in cylindrical coordinates(Yu et al., 2010). The perturbation wind components are much smaller than the azimuthal mean in the eye wall and outer regions. Decomposing thetotal TC flow into reference and perturbation components is therefore consistent with the basic assumptions involved in linearizing Eqs. (3) and (4).
The asymmetric structure of the eyewall and therelated circulation is apparent in Figs. 3 and 4. Theeyewall exists only in the southwest portion of thecross-section, with strong ascending motion and convergent inflow at lower levels accompanying a deepSC. This result is consistent with observ ations of intense deep convection and strong precipitation in thesouthwest quadrant of tropical storm Bilis. The northeast portion of the cross-section does not contain aneye wall. Ascending motion and low-level convergenceare also weak in the northeast quadrant of the storm. This asymmetry is a more typical structure than thatobserved during the strong Hurricane Andrew(1992)(Wang and Zhang, 2003).
 |
| Fig. 2. The vertical structure of azimuthally averaged tangential wind(m s-1)at 1500 UTC 11 July 2006 from(a)model output and (b)the PV inversion. (c)Radial distribution of the wavenumbers 0{3 components of tangential windsat 1-km altitude derived from WRF model output at 10-min interv als from 1500 to 1600 UTC 11 July 2006. |
The largest values of PV in the eye wall of tropical storm Bilis were located at the upper troposphere(7-10-km altitude)over a region 100-200 km southwest of the center of the storm. The peak value ofPV in this region was greater than 5 PVU(1 PVU =10-6K m2 kg-1s-1). Two other local maxima in PVwere located in the upper troposphere(approximately7-9 km)above the TC center and in the middle troposphere(5-6 km)over an area 300-400 km southwestof the TC center. The latter maximum was relatedto strong latent heat release in the spiral rainb and s. Unlike Hurricane Andrew(1992), no PV bridge wasapparent at the top of the boundary layer and no Ushaped PV structure appeared above the eye of tropical storm Bilis. The vertical profile of PV calculatedfrom the inverted flow field(Fig. 3b)is qualitatively and quantitatively similar to the simulated profile ofPV. This similarity indicates that the quasi-balancedflow provides a good representation of the circulationfeatures produced in the model simulation of tropicalstorm Bilis.
 |
| Fig. 3. Southwest-northeast vertical cross-sections of averaged PV(PVU)at 1500 UTC 11 July 2006(a)calculateddirectly from model output and (b)recalculated from the inverted flow field. The shading indicates the latent heatingrate(K h-1), which is based exclusively on model output. |
The vertical velocity and SC diagnosed by thePV inversion(Fig. 4b)further illustrate the usefulness of the method. Figure 4a shows a core of strongupdrafts(with vertical velocity of about 1 m s-1)inthe eye wall 150-200 km southwest of the TC center. These strong updrafts increased with height from thetop of the boundary layer to approximately 7-km altitude. Air converged into the eye wall at lower levels and diverged away from the eye wall at upper levels inthis core area of upward motion. This low-level convergence and upper-level divergence were separated bythe center of ascending motion at about 4-km altitude. Although the structural features of this SC near theeye wall were similar to those of Andrew(1992), theSC was mainly confined to the southwest side of tropical storm Bilis. Strong updrafts occurred mainly inthe middle and upper troposphere(above 5-km altit-ude)within 400 km of the center of tropical stormBilis. This distribution of strong updrafts correspondsto latent heat release in the spiral rainb and s, whereBilis differed substantially from Andrew. Weak divergence and subsidence associated with northeastward and southwestward outflow were apparent in the upper troposphere over the TC center. The features ofthe SC based on the PV-ω inversion(Fig. 4b)arequalitatively similar to the features of the SC basedon model output(Fig. 4a), including strong upwardmotion, low-level inflow, and upper-level outflow in thesouthwestern quadrant. However, there are some important differences between the two estimates. First, the maximum ascending motion in the inverted flowfield is approximately 75% of that in the model output. Second, the northeasterly and southwesterly low-levelinflows converge further toward the southwest relativeto the TC center. The divergent flow at upper levelsis similarly shifted. These differences result in southwesterly low-level flow and northeasterly upper-levelflow across the center of the TC, which is not apparent in the model output. The low-level inflow into theeye wall region and the upper-level outflow away fromthe eye wall region are stronger to the northeast of theeye wall in the inverted flow field(Fig. 4b)than in themodel output(Fig. 4a).
 |
| Fig. 4. Southwest-northeast vertical cross-sections of averaged vertical velocity(m s-1)at 1500 UTC 11 July 2006 from(a)model output and (b)the PV inversion. Both cross-sections are superposed with vectors showing the storm-relativein-plane flow field. The shading is the same as in Fig. 3. |
The horizontal divergent wind diagnosed usingthe PV inversion shows low-level convergence about150-200 km southwest of the storm center(Fig. 5a). This convergence corresponds with the location of theeye wall. Weak convergence caused by differences indivergent wind speeds to the southwest of this regionof strong convergence corresponds to the spiral rainb and s. A broad region of upper-level divergence isapparent approximately 200-500 km southwest of theTC center(Fig. 5b). This region spanned the areafrom the eyewall to the spiral rainb and s and promptedupward motion throughout the southwest quadrant oftropical storm Bilis(Fig. 4a). These updrafts werestrongest near the eye wall because of differences inlow-level horizontal convergence, and were relativelyweak in the spiral rainb and regions, especially in thelower troposphere(below 5-km altitude; Fig. 4a).
 |
| Fig. 5. Vector fields of the mean horizontal divergent wind at(a)1. 5- and (b)11. 5-km altitude based on the PVinversion at 1500 UTC 11 July 2006. The color shading in(a)represents the heating rate(K h-1)at 4. 5-km altitude. The contours in(b)represent the vertical velocity(m s-1)at 4. 5-km altitude. |
Figure 6 shows the SCs forced by latent heating(Fig. 6a), frictional effects(Fig. 6b), and dynamicalprocesses(Fig. 6c). The regions of strong latent heating were all located in the southwest quadrant of tropical storm Bilis. The latent heating located 150-200km southwest of the storm center resulted from deepconvection in the eyewall, while that located approximately 400 km southwest of the storm center resulted from convection in the spiral rainb and s. The SCcaused by latent heating was concentrated mainly inthe southwest quadrant of the storm. The strongestascending motion was located in the middle troposphere(5-6-km altitude)in the eyewall region, witha peak value of approximately 0. 7 m s-1. Updraftsin the spiral rainb and s were weaker than those in theeyewall, with peak upward motion of approximately0. 2 m s-1at 6-7-km altitude. Low-level convergencein the SC occurred mainly below 3 km in the southwest quadrant. Air on both sides of the eyewall movedtoward the eyewall, strengthening convective updraftsin the vicinity of the eyewall. Upper-level divergenceoccurred mainly above 8-km altitude. The upper-leveloutflow in the eyewall region flowed outward to thenortheast and southwest of the eyewall, and was significantly stronger than the upper-level outflow in thespiral rainb and regions. The SC was oriented downward throughout the troposphere over the eye of thestorm, with stronger subsidence at upper levels thanat lower levels. The effects of latent heating on the total SC(Fig. 4b)were particularly strong with respectto ascending motion in the eyewall and spiral rainb and regions.
F riction primarily acted to generate convergencein the boundary layer(Fig. 6b). This convergenceforced ascending motion in the boundary layer of theeyewall region, with a mechanism similar to Ekmanpumping. The region of ascending motion in the SCforced by frictional effects was again located approximately 150-200 km southwest of the center of thestorm. The maximum upward motion(about 0. 08 ms-1)was located near the top of the boundary layer(1-2-km altitude). The vertical velocity of the frictionalSC decreased with increasing altitude. The convergence caused by frictional effects was maximum nearthe inner eyewall. Judging from the magnitude of theSC, we found that friction had little impact on tropicalstorm Bilis at this time. This may be associated withthe relative weakness of the tangential winds(< 25 ms-1), which meant that the wind speed did not varymuch with altitude in the boundary layer. Note thatthe effects of friction are also smaller over the oceansurface than over l and .
 |
| Fig. 6. Southwest-northeast vertical cross-sections of mean vertical velocity(contours; m s-1) and storm-relative inplane flow(vectors, with vertical velocity magnified by a factor of 10)forced by(a)latent heating(shading indicates theheating rate in unit of K h-1), (b)frictional effects, and (c)dry dynamical processes(dashed contours indicate potentialtemperature in K)at 1500 UTC 11 July 2006. |
Dynamic processes associated with the environmental vertical wind shear forced a clockwise SC(Fig. 6c), with updrafts to the southwest and downdraftsto the northeast of the TC center. Air flowed fromnortheast to southwest at lower levels(2-km altitude), and from southwest to northeast at upper levels(7-9-km altitude). This overturning SC occurred mainlywithin the radius of maximum wind. The resultingvertical wind shear was southwesterly, opposite to thenortheasterly orientation of the environmental verti-cal wind shear(Fig. 7). Its value was approximately3-4 m s-1, which offset the impact of the environmental vertical wind shear by approximately 25%. Thisdynamically-forced SC strengthened the wavenumber1 asymmetric structure of tropical storm Bilis. Thezero line of the SC vertical velocity passed throughthe center of the storm from low levels(northeast)toupper levels(southwest). V ertical motion was mainlyupward to the southwest and downward to the northeast of the zero line.
 |
| Fig. 7. Mean environmental zonal and meridian wind(ms-1)in each vertical layer at 1500 UTC 11 July 2006. Thearrow indicates the environmental vertical shear between200 and 850 hPa. |
The SC shown in Fig. 6c was forced by the vertical structure of the environmental wind field. Figure 7 shows environmental winds at 1500 UTC 11 July, defined as the mean velocity profile averaged over the720 km × 720 km region around the center of tropical storm Bilis. The environmental wind was southwesterly at lower levels, southeasterly at middle levels, and northeasterly at upper levels, resulting in northeasterly vertical shear between 200 and 850 hPa. Thesouthwesterly shear generated by the dry dynamicalSC(Fig. 6c)partially offset the destructive effectof this environmental vertical wind shear. In particular, the ascending motion forced by the environmentalvertical wind shear 200 km southwest of the storm center enhanced the upward motion in the eyewall areaforced by latent heat release.
Figure 8 shows the horizontal distribution ofdivergent winds in the SC forced by dry dynamical processes. The asymmetric vertical motion withwavenumber 1(the first four terms on the right h and side of Eq. (7))is apparent. Strong low-level convergence related to the environmental vertical windshear occurred mainly in the southwest quadrant ofthe storm, 150-200 km from the center of the storm. The corresponding upward motion was collocated withthe eyewall region. By contrast, the SC forced lowlevel divergence and subsidence 200 km northeast ofthe TC center. This result highlights the importanceof the environmental vertical wind shear in reinforcingupward motion in the partial eyewall located southwest of the center of tropical storm Bilis. The low-levelconvergence caused by the environmental vertical windshear made an important contribution to the strongconvergence and upward motion in the eyewall area(Fig. 5a), thereby increasing latent heat release and further enhancing the upward vertical motion. Thisprocess represents a positive feedback loop that hashelped to maintain tropical storm Bilis and its asymmetric wavenumber 1 rainfall structure.
 |
| Fig. 8. Mean divergent winds forced by dry dynamicalprocesses at 1. 5-km altitude at 1500 UTC 11 July 2006. The shadings indicate the heating rate(K h-1); contoursindicate vertical velocity(m s-1). |
Figure 9 shows the track of tropical stormBilis after its l and fall. Bilis moved initially west-northwestward after making l and fall at Xiapu County, F ujian at 0600 UTC 14 July 2006, but changed directions three times. The ¯rst turn occurred at 1200UTC 14 July, with the track changing from northnorthwestward to southwest-westward. The secondturn occurred at 0600 UTC 15 July with the trackchanging from southwestward to northwestward. Thethird turn reoriented the storm toward the southwest, with a similar direction of motion to that before thesecond turn. We compare the large-scale steering flowwith the zonal and meridional motion of the storm tounderst and the mechanisms behind these changes indirection(Fig. 10). The motion of Bilis was consistent with the large-scale steering flow between approximately 0600 and 1800 UTC 15 July, meaning that thesecond turn(from southward to northward at approximately 0600 UTC 15 July)was associated with thelarge-scale steering flow. The other turns appear tohave been largely unrelated to the large-scale steeringflow, as the meridional component of the large-scalesteering flow was oriented toward the north while Bilismoved toward the south.
 |
| Fig. 9. The track of tropical storm Bilis(2006)after itsl and fall. |
 |
| Fig. 10. (a)Zonal and (b)meridional component(m s-1)of the large-scale steering flow(solid line) and the track oftropical storm Bilis(dashed line)after its l and fall. |
We begin our investigation of the effects of mesos-cale convective systems on the track of tropical stormBilis by describing the rainfall associated with thesemesoscale convective systems. Figure 11 shows thespatial distribution of rainfall rate based on automatedstation observ ations and a south-north vertical crosssection of the PV perturbation, in-plane winds, and latent heating rate from WRF model output at 0000UTC 15 July . There were two centers of strong convective rainfall(maximum rain rates about 60 mm h-1)located in the vicinity of tropical storm Bilis at thistime. These mesoscale convective systems were asymmetric with respect to tropical storm Bilis: one sys-tem was located about 300 km south of the TC center, while the other was located about 500 km to the northeast of the TC center. Both of these mesoscale systemspersisted for a long time after Bilis made l and fall. Thesouthern system largely maintained its position relative to the TC center, while the other system was continuously located on the coast of F ujian and Zhejiangprovinces(figure omitted). Figure 12 shows the inverted flow based on PV perturbations larger than 0. 5PVU within a 900-km circular radius of the center oftropical storm Bilis at 0000 UTC 15 July 2006. Thelow-level PV perturbations are primarily contributedby the mesoscale convective system located to thesouth of the TC center(Figs. 12a and 12b). The inverted balanced flow contains a low-level cyclonic circulation associated with the PV perturbation southof Bilis and upper-level east-northeasterly . The zonal and meridional components of the steering flow associated with this balanced flow were -2. 13 and -0. 7 ms-1, respectively(Fig. 13). This result suggests thatthe secondary steering flows associated with nearbymesoscale convective systems steered Bilis toward thesouth and west, and contributed approximately 66% of the westward(-3. 22 m s-1)movement and 34% ofthe southward(-2. 06 m s-1)movement of the TC. The zonal and meridional components of the largescale steering flow during this period were -0. 43 and 3. 02 m s-1, respectively . The zonal component contributed less to the westward motion of Bilis than didthe asymmetric mesoscale convective systems, whilethe meridional component was oriented in the opposite direction of the southward motion of Bilis. Thecomposite of these large-scale and secondary steeringflows is not consistent with the observed motion oftropical storm Bilis, indicating that this motion mustalso be affected by other factors(such as the asymmetric structure of Bilis itself).
 |
| Fig. 11. (a)Horizontal distribution of rainfall(mm h-1)around Bilis and (b)south-north vertical cross-section ofmean PV perturbations(contours; PVU), in-plane winds(vectors; m s-1), and latent heating rates(shading; K h-1)at0000 UTC 15 July 2006. The vertical velocity is magnified by a factor of 10 in(b) |
 |
| Fig. 12. The inverted horizontal flow based on the PV perturbations due to mesoscale convective systems at 0000UTC 15 July 2006 at altitudes of(a)1. 5, (b)3, (c)5. 5, and (d)10. 5 km. The shadings in(a) and (b)indicate the PVdisturbance(PVU)at that altitude. |
 |
| Fig. 13. A sketch of zonal and meridional components ofthe large-scale steering flow, the secondary steering flow diagnosed from PV perturbations associated with mesoscaleconvective systems, and the actual motion of tropical stormBilis at 0000 UTC 15 July 2006(m s-1). |
We have performed a piecewise PV-ω inversion(Wang and Zhang, 2003; Kieu and Zhang, 2010)ofthe output from a WRF model simulation of tropicalstorm Bilis(2006)to diagnose the impacts of variousdynamical processes on the quasi-balanced flow and secondary circulation(SC)of this strong tropicalstorm. We have also used this method to examinethe role of mesoscale convective systems in determining the track of tropical storm Bilis after its l and fall. The conclusions are as follows.
(1)The PV inversion provides good representations of the tangential wind, vertical velocity, and horizontal circulation. The magnitude of the nonlinearquasi-balanced vertical velocity based on the inversionis approximately 75% of the vertical velocity simulatedby WRF.
(2)The largest contribution to the SC came fromlatent heating. The SC contained two areas of strongascending motion, both located southwest of the stormcenter(in the direction of the environmental verticalwind shear). These areas corresponded to latent heatrelease associated with heavy precipitation in the partial eyewall region(150-200 km southwest of the stormcenter) and in the spiral rainb and s(approximately 400km southwest of the storm center). The SC was veryweak in the northeast quadrant of the storm(oppositeto the shear direction). The SC generated by frictionaleffects also contained convergence and updrafts in theboundary layer of the eyewall southwest of the stormcenter, but the intensity was relatively weak.
(3)Dry dynamical effects related to the environmental vertical wind shear generated an SC within theradius of maximum wind that was oriented opposite tothe environmental vertical wind shear. This SC contained upward motion in the southwest and sinkingmotion in the northeast, with flow from the southwestto the northeast at upper levels and from the northeast to the southwest at lower levels. The southwesterly shear generated by this SC weakened the effectsof the northeasterly environmental vertical wind shearby approximately 25%.
(4)The zonal component of the large-scale steering flow was much smaller than the zonal componentof the actual motion of tropical storm Bilis after l and fall, while the meridional component of the large-scalesteering flow was oriented opposite to the actual motion of the storm. Nearby mesoscale convective systems exerted an important influence on the track oftropical storm Bilis after its l and fall. As an example, the zonal and meridian components of the largescale steering flow at 0000 UTC 15 July 2006 were-0. 43 and 3. 02 m s-1. These flows represented contributions of 13% and -146%, respectively, to the zonal and meridional motion of tropical storm Bilis at thistime. The zonal and meridional components of thesecondary steering flow associated with asymmetricmesoscale convective systems were -2. 13 and -0. 7 ms-1, which corresponded to contributions of 66% and 34% to the motion of the tropical storm. These resultsindicate that this secondary steering flow played animportant role in the westward and southward movement of tropical storm Bilis after its l and fall.
This study shows the utility of the PV inversiontechnique for describing the structural features of thenonlinear quasi-balanced SC in a non-axisymmetricTC. The SC forced by the environmental vertical windshear reduced the destructive effects of this environ-mental shear on the intensity of tropical storm Bilis, which played an important role in the long life spanof the storm. Our findings deepen underst and ing ofthe features of quasi-balanced flow in an asymmetricTC, and highlight the potential effects of mesoscaleconvective systems on the motion of TCs. We willstudy additional cases to further constrain the effectsof secondary steering flows associated with mesoscaleconvective systems on TC tracks and adv ance our underst and ing of this mechanism.
Acknowledgments: Thanks to Professor DalinZhang and Dr. Wei Zhong for help with running thePV-ω inversion program. The language editor for thismanuscript is Dr. Jonathon S. Wright.
| Betts, A. K., and M. J. Miller, 1986: A new convective adjustment scheme. Part II: Single column tests using GATE wave, BOMEX, and arctic air-mass data sets. Quart. J. Roy. Meteor. Soc., 112, 693-709. |
| Charney, J. G., and A. Eliassen, 1964: On the growth of the hurricane depression. J. Atmos. Sci., 21, 68-75. |
| Davis, C. A., 1992: Piecewise potential vorticity inver- sion. J. Atmos. Sci., 49, 1397-1411. |
| Davis, C. A and K. A. Emanuel, 1991: Potential vorticity diagnostics of cyclogenesis. Mon. Wea. Rev., 119, 1929-1953. |
| Dudhia, J., 1989: Numerical study of convection observed during the winter monsoon experiment using a mesoscale two-dimensional model. J. Atmos. Sci., 46, 3077-3107. |
| Eliassen, A., 1952: Slow thermally and frictionally controlled meridional circulations in a circular vortex. Astrophysica Norvegica, 5, 19-60. |
| Hong, S. Y., and J. Lim, 2006: The WRF single-moment 6-class microphysics scheme (WSM6). J. Korean Meteor. Soc., 42, 129-151. |
| Hong, S. Y. Noh., and J. Dudhia, 2006: A new vertical diffusion package with an explicit treatment of entrainment processes. Mon. Wea. Rev., 134, 2318-2341. |
| Hoskins, B. J., M. E. McIntyre, and A. W. Robertson, 1985: On the use and significance of isentropic potential vorticity maps. Quart. J. Roy. Meteor. Soc., 111, 877-946. |
| Huo, Z. H., D.-L. Zhang, and J. R. Gyakum, 1999: The interaction of potential vorticity anomalies in extratropical cyclogenesis. Part II: Sensitivity to initial perturbation. Mon. Wea. Rev., 127, 2563-2575. |
| Janjic, Z. I., 1994: The step-mountain eta coordinate model: Further developments of the convection, vis- cous sublayer and turbulence closure schemes. Mon. Wea. Rev., 122, 927-945. |
| Kieu, C. Q., and D. L. Zhang, 2010: A piecewise potential vorticity inversion algorithm and its application of hurricane inner-core anomalies. J. Atmos. Sci., 67, 2616-2631. |
| Mlawer, E. J., S. J. Taubman, and P. D. Brow, et al., 1997: Clough, radiative transfer for inhomogeneous atmosphere: RRTM, a validated correlated-k model for the long-wave. J. Geophys. Res., 102, 16663- 16682. |
| Montgomery, M. T., and R. J. Kallenbach, 1997: A theory for vortex Rossby-waves and its application to spiral bands and intensity changes in hurricanes. Quart. J. Roy. Meteor. Soc., 123, 435-465. |
| Ovyama, K., 1964: A dynamical model for the study of tropical cyclone development. Geofts. Int., 4, 187-198. |
| Schubert, W. H., and J. J. Hack, 1982: Inertial stability and tropical cyclone development. J. Atmos. Sci., 39, 1687-1697. |
| Shapiro, L. J., and H. E. Willoughby, 1982: The response of balanced hurricanes to local sources of heat and momentum. J. Atmos. Sci., 39, 378-394. |
| Shi Shunji, Yu Jinhua, and Zhang Dalin, 2009: Causes of wavenumber-1 asymmetric rainfall distribution of tropical storm Bilis (2006) during its landfall. J. Trop. Ocean., 28, 34-42. |
| Wang, X., and D.-L. Zhang, 2003: Potential vorticity diagnosis of a simulated hurricane. Part I: Formulation and quasi-balanced flow. J. Atmos. Sci., 60, 1593-1607. |
| Wu, C.-C., and K. A. Emanuel, 1995a: Potential vorticity diagnostics of hurricane movement. Part I: A case study of Hurricane Bob (1991). Mon. Wea. Rev., 123, 69-92. |
| Wu, C.-C., and K. A. Emanuel, 1995b: Potential vorticity diagnostics of hurricane movement. Part II: Tropical storm Ana (1991) and Hurricane Andrew (1992). Mon. Wea. Rev., 123, 93-109. |
| Wu Guoxiong, Cai Yaping, and Tang Xiaojing, 1996: Conservation of moist potential vorticity and downsliding slantwise vorticity development. Acta Meteor. Sinica, 10, 399-418. |
| Yu Jinhua, Tan Zhemin, and Wang Yuqing, 2010: Effects of vertical wind shear on intensity and rainfall asymmetries of strong tropical storm Bilis (2006). Adv. Atmos. Sci., 27, 552-561. |
| Zhang, D. L., and C. Q. Kieu, 2006: Potential vorticity diagnosis of a simulated hurricane. Part II: Quasi-balanced contributions to forced secondary circulations. J. Atmos. Sci., 63, 2898-2914. |
| Zhong Wei, Lu Hancheng, and Zhang Dalin, 2008: The diagnoses of quasi-balanced flows in asymmetric intense hurricane. Chinese J. Geophys., 51, 469-479. |