 2014, Vol. 28
The Chinese Meteorological Society
Article Information
- RUAN Zheng, MING Hu, MA Jianli, GE Runsheng, BIAN Lingen. 2014.
- Analysis of the Microphysical Properties of a Stratiform Rain Event Using an L-Band Profiler Radar
- J. Meteor. Res., 28 (2) : 268-280
- http://dx. doi. org/10. 1007/s13351-014-3091-x
Article History
- Received May 13, 2013;
- in final form November 8, 2013


2 Nanjing University of Information Science & Technology, Nanjing 210044;
3 Northwest Regional Air Traffic Management Bureau of Civil Aviation Administration of China, Xi'an 710000;
4 Beijing Weather Modification Office, Beijing 100086
Cloud precipitation studies often require knowledge of raindrop size distributions (RSDs) and theirchanges. Quantitative analysis of RSDs and relatedcharacteristic parameters in precipitation is a fundamental part of underst and ing microphysical processes and validating numerical cloud models. This type ofanalysis also plays a key role in improving the accuracy of rainfall estimates made using radar observ ations. Measurements of RSDs within clouds using airborne Particle Measuring System (PMS) instrumentsare often not representative of the whole cloud because the acquired data are limited to the flight path. Retrievals of microphysical parameters from satelliteplatforms are limited by wavelength, especially withrespect to boundary layer clouds. Radar remote sensing has become an increasingly important platform forstudying the microphysics of clouds and precipitationwith the exp and ing deployment of weather radar systems throughout the world.
Wind profiler radars (WPRs) at 1320 MHz are mainly used to detect wind fields in clear air. WPRsare able to detect Rayleigh backscatter from raindrops and can therefore also be used to study precipitatingclouds. The gate lengths of WPRs vary from 50 to 100m. These instruments have the capability to detectthe fine vertical structure and evolution of precipitation clouds. Bright b and s (BBs) are special phenomena in radar observ ations of stratiform precipitationclouds. Radar measurements and BB information canbe combined to analyze the vertical structure of stable precipitation clouds (Williams et al., 1995, 2000; White et al., 2002; Rao et al., 2008) .
Techniques for using radar data to retrieve raindrop distributions have been developed over manyyears. WPRs can be used to obtain spectral density of precipitating particles by using the F ast F ourierT ransform (FFT) technique. These vertically-orientedradars sample large volumes and the retrieved Dopplerspectra and RSDs are robust. The vertical WPR hastherefore become a primary tool for studying RSDs inprecipitating clouds (Schafer et al., 2002; Kobayashi and Adachi, 2005; Kirankumar et al., 2008; Radhakrishna and Rao, 2009) .
The most important part of the procedure for retrieving RSDs from WPR data is the removal of airvertical motion to isolate the fall speed of the precipitation particles (Lucas et al., 2004) . Schafer et al. (2002) and Rajopadhyana and Rao (2009) usedtwo WPRs with VHF and UHF frequencies to investigate falling raindrops. Kim et al. (2009) examined the kinematic and microphysical characteristicsof a stratiform rainb and within a tropical storm using data from a collocated 915-MHz wind profiler and scanning Doppler radar. Their results implied the possibility of balance between raindrop growth by collection and breakup/evaporation below the melting layer. Sharma et al. (2009) used a Joss-W aldvogel disdrometer (JWD) and L-b and frequency wind profilers tostudy the integral characteristics of rain parametersduring tropical convective, transitional, and stratiformrain. During stratiform type of rain, larger raindropswere found to be associated with a thicker BB and astronger velocity gradient. Mallet and Barthes (2009) established a database characterizing RSDs by moments, least squares, and maximum likelihood estimators. They found that approximately 91% of observedRSDs were gamma distributions.
Chen et al. (1998) explored RSDs in threetypes of precipitation by fitting Marshall-Palmer and gamma functions to PMS-GBPP-100 observ ations. Liu and Lei (2006) separated precipitating systemsinto convective and stratiform ones based on the raindrop distribution and the structure of the precipitating clouds. They analyzed multi-peak RSDs and calculated six kinds of raindrop diameters. Liao et al. (2011) investigated the RSDs in two typical summerthunderstorms over the Pearl River delta. The RSDshad average cube root diameters of 1. 14 and 1. 18 mm, respectively .
Wang et al. (2010) found that 445-MHz WPRspectra are often bimodal, with one mode representing the vertical air motion and the other representing the raindrop fall speed. The spectrum of raindrop terminal velocity may therefore be clearly identi-fiable within the observed spectrum. The atmospherein stratiform clouds is relatively stable. The verticalair motion spectra within stratiform clouds are therefore narrow, with relatively small impacts on spectralbroadening in WPR return signals. The atmosphereenvironment wind field within these clouds can beconsidered approximately stationary . RSDs can thenbe retrieved according to the spectra of raindrop fallspeed (Maguire and Avery, 1994) .
This work investigates microphysical properties ofprecipitating stratiform clouds observed by a 1320-MHz WPR on 14 May 2009 in Huayin, ShaanxiProvince. RSDs have been retrieved continuously intime at a variety of altitudes. The RSDs are fit using gamma functions. The temporal and spatial distributions of the raindrop spectra and microphysicalparameters in these clouds are obtained and analyzed. 2. Observational instruments and analysis techniques2. 1 Observational instruments
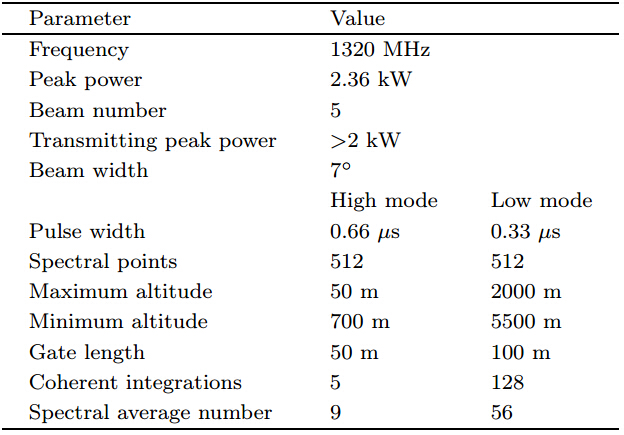
The parameters of the 1320-MHz WPR (CFL-03) are listed in Table 1. The radar has a wavelength of 22. 7 cm, an emitted power of 2 kW, and a minimumdetectable signal power below -145 dBm. The widthof the antenna beam is 7° and the dynamic range ofthe receiver is 90 dB. The processed FFTs include 512spectral components. The radar can detect signals ata height range between 50 and 5100 m. Low mode coverage extends from 50 to 1500 m with a gate length of50 m. High mode coverage extends from 700 to 5100m with a gate length of 100 m. The temporal resolution is 4 min.
The five detection beams comprise a verticalbeam and four non-coplanar slant beams, with a scanning cycle of approximately 3 min. A signal generator is used to quantitatively calibrate the WPRecho power. Echo intensity measurements are accurate within ±1 dB. The retrieved signals are almostidentical to those retrieved using the S-b and weatherradar. The average difference relative to reflectivitiesderived from rain gauge data is 0. 98 dB (Zhong et al., 2010) .
The accuracy of the RSD retriev al strongly depends on the noise level of the WPR observation system, especially with respect to the number concentrations of small particles. Therefore, we increasedthe threshold signal-to-noise ratio by preprocessing thedata. The smallest raindrop diameter countable in theretrieved RSDs is 0. 5 mm. 2. 2 RSDr etrieval method
The retriev al of RSDs from spectral densities isbased on the relationship between the raindrop fallspeed and drop diameter in a stationary atmosphere. The spectral density of the return signal from precipitation particles at height his designated Sh (vr) . Theobserved vertical velocity vr is a superposition of thevertical air velocity va and the terminal speed of precipitation particles vt. Raindrops are dispersive scatters, so the return power is the sum of the backwardscattering signal from drops within the radar resolution volume. The detected spectral density thereforeonly truly represents Sh (vt) when the air vertical motion is zero. In general, Sh (vr) and Sh (vt) can beconvoluted via the expression
where Rh (va) is the density distribution of the normalized air velocity power spectrum. The return signalcontains contributions from the atmospheric refractiveindex caused by atmospheric non-uniformity . In certain cases, the difference between the vertical velocitiesof precipitation particles and the vertical air velocityis distinguishable. The two spectral densities can beseparated if the two spectral distribntions are independent of each other. The normalized Doppler velocityspectral density distribution Rh (va) is calculated usingthe atmospheric return signal Sh (va) . Sh (vt) can thenbe obtained by deconvoluting Sh (vr) and Rh (va) .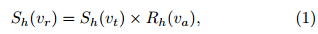
If the return signal from precipitation particlesis stronger than the return signal from atmosphericmotion, then it is di±cult to separate the Sh (va) distribution from the signal spectrum detected by the1320-MHz WPR. Because the atmospheric verticalmotion in stratiform clouds remains nearly constant, the width of Rh (va) is narrow, with a relatively smallspectral broadening effect on Sh (vt) . Shupe et al. (2008) reported that the spectral broadening effect ofair motion on the return signal from a 35-GHz cloudradar was less than 9%. In our case, the spectralbroadening effect of air vertical motion on the raindrop spectrum can be regarded as a translation of themean air vertical motion va. Sh (vt) can be simplifiedas
If vertical air motion is relatively stable, vacan beestimated by subtracting the average hydrometeor fall speed vt from vr (i. e., va = vr-vt) , where vr is theaverage radial velocity of vertical beam radar, whichcan be calculated based on the average power of thereturn signal spectrum distribution of the first-ordermoment, while vt at height h is obtained using theobserved reflectivity Z (h) :where ρ (h) is the atmospheric density at height h and ρ0 is the atmospheric density at the surface (Ulbrich and Chilson, 1994) .

The relationship between raindrop terminal fallspeed vt and particle diameter D in a stationary atmosphere is expressed as (Gunn and Kinzer, 1949) :
Sh (vt) can be converted into the spectral density ofreflectivity (SDR) based on the radar equation and the parameters of the WPR. The relationship betweenreflectivity Z at height h and the Zhi (vt) can be expressed aswhere Zhi (vt) is SDR in discrete form with a plurality of spectral line, △V is the raindrop fall speedinterv al and n is the number of lines in the power spectrum distribution of the precipitation return signal. The SDR can be transformed into the intensity distribution by Zhi (D) , using the relationshipbetween the velocity and the diameter of raindrops. The intensity of spectral line i is then represented byZhi (D) = Nh (Di) ×D6i, where Nh (Di) is the numberconcentration of particles with diameter Di (Huang et al., 2011) .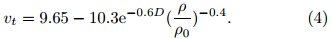

The above method provides a means of determining the spectrum Nh (Di) of a RSD from the powerspectrum density distribution detected by the WPRSh (vri) . The noise level is determined using themethod proposed by Hildebr and and Sekhon (1974) . The spectral distribution of hydrometeors is identifiedby using the statistical characteristics of the backscattering signal from raindrops. 3. Characteristics of the observed clouds3. 1 Rainfall event
The RSD retriev al method is employed to a stratiform precipitation event observed by the WPR on14 May 2009 in Huayin, Shaanxi Province to investigate the microphysical characteristics of this event. Figure 1 shows a composite reflectivity mosaic imagefrom five C-b and weather radars at 0736 BT (BeijingTime) . The image shows scattered convective echoeswithin a wide area of stratiform cloud. The WPR sitein Huayin (34. 27°N, 110. 12°E; black solid circle in Fig. 1) is located within a large area of stratiform precipitation. The BB is identified using the vertical profile ofreflectivity via the SHY95 method (Steiner et al., 1995; Allen et al., 2002; Rao et al., 2008) . RSDs below theBB are retrieved from 61 vertical scans of the WPRbetween 0620 and 0855 BT 14 May 2009. The retriev als are valid for 27 gates at altitudes between 700 and 3300 m. A total of 1647 RSDs are retrieved during this rainfall event. The vertical velocity of air isestimated based on Eqs. (3) - (5) , and then removedfrom the observed velocities prior to RSD retriev al.
 |
| Fig. 1. Composite radar mosaic image from five C-b and radars at 0736 BT 14 May 2009 |
Figure 2 shows the evolution of reflectivity, velocity, and spectral width detected by the WPR between0600 and 0900 BT. Positive radial velocities are oriented downward. A stable BB persists throughout thelifetime of the stratiform precipitation event, with onlyslight changes in time. The air vertical velocity wasless than 1 m s-1in the non-precipitation area, witha spectral width of less than 0. 5 m s-1. The averageheight of the BB top based on the vertical distributions of the three spectral parameters was approximately 4300 m. The reflectivity of solid precipitationparticles above the BB was generally between 15 and 20 dBZ. The average fall speed of these particles was1. 4 m s-1, with a spectral width of 1-2 m s-1. The BBwas nearly 900-m thick, and the average height of themaximum reflectivity was 3900 m. The average radialvelocity increased rapidly to 6. 2 m s-1within the BB, with a spectral width of 2. 6 m s-1at the bottom ofthe melting layer. The average height of the bottomof the BB was approximately 3400 m. The reflectivity and the fall speed of drops gradually became stablewithin the liquid precipitation area. The average fallspeed of raindrops below the BB was 6. 4 m s-1, witha spectral width of 2. 8 m s-1.
 |
| Fig. 2. Time-height cross-section of (a) reflectivity (dBZ) , (b) Doppler velocity (m s-1) , and (c) spectral width (m s-1) between 0600 and 0900 BT 14 May 2009 at Huayin, Shaanxi Province |
Based on changes in the intensity of precipitationbelow the melting layer, this precipitation event can bepartitioned into three stages: 0620-0715, 0718-0758, and 0800-0845 BT. The maximum reflectivity withinthe BB was 41. 0 dBZ during the early stage, 45. 9 dBZduring the middle stage, and 41. 8 dBZ during the latestage. The maximum reflectivity within the liquid precipitation area below the BB was 37. 7 dBZ during theearly stage, and progressively weakened to 33. 8 dBZduring the middle stage and 29. 9 dBZ during the latestage. The peak reflectivity and the top of the BBwere both higher earlier in the event (0630-0740 BT) , indicating weak convective activity with mixed precipitation characteristics during the early and middlestages. Stable stratiform precipitation dominated during the late stage. 4. Characteristics of the RSDs4. 1 Spe ctr al density of r eflectivity
The spectral density of reflectivity reflects contributions from precipitation particles with diflerentdiameters to the power of the echo signal. V ariationsin the phases and RSDs of rain particles with heightcan be deduced by examining vertical profiles of SDR. Figure 3 shows vertical profiles of SDR at 0635, 0738, and 0830 BT. The SDR observed at all three times increased rapidly with a decrease of height in the meltinglayer, with a maximum of about 7 m s-1. The SDR mum width of about 20 m s-1. Latent heating due tomelting of ice particles and snowflakes induced microscale convection within the melting layer. This microscale convection caused a rapid widening of the SDR. The SDR of solid phase particles above 4300 m wasnarrow, with a speed of approximately 1. 5 m s-1 and a width of only 3 m s-1. Figure 3 also indicates thatthe raindrop distribution below 3300-m altitude wasbroader than that above the melting layer and narrower than that within the melting layer, although thespectra shifted to a higher velocity range. The widthof the SDR within this lower layer varied from 6 to 8m s-1, and the maximum reflectivity at 0635 BT wasbetween 7 and 10 m s-1. The surface precipitationwas heaviest at this time, with a total rainfall of 1. 64mm between 0630 and 0640 BT.
 |
| Fig. 3. Spectral density of reflectivity at (a) 0635, (b) 0738, and (c) 0830 BT. (Height of 0: 4010 m) . |
Figure 4 shows continuous vertical profiles ofRSDs observed at three diflerent times during thestorm. These profiles indicate that the number concentrations of small particles (diameter D 6 4 mm) were generally steady at lower altitudes. These number concentrations were largest at 0635 BT, with asecondary maximum at 0738 BT and a minimum at0830 BT. Number concentrations of small particleswere one to two orders of magnitude larger during theinitial stages of the event than during the late stages.
 |
| Fig. 4. Vertical proflles of the number concentrations of raindrops by drop diameter at (a) 0635, (b) 0738, and (c) 0830BT. |
The number concentrations of larger particles (D > 4mm) varied with height. These number concentrationsinitially increased with height to a maximum at mid levels, and then decreased with height above that maximum. The altitude of the maximum number concentration of large particles changed substantially overtime, increasing from 1800 m at 0635 BT to 2500 mat 0738 BT, and then increasing again to 2800 m at0830 BT. The observed variations in the number concentrations of large particles with height reflect a comprehensive balance between particle growth by collision-coalescence and the breakup of raindrops in clouds. An increase in the concentration of large particles indicates that particle growth is dominant while a decrease indicates that breakup is dominant.
Solid phase particles above the melting layer consist of ice crystals, snowflakes, and snow blocks. Icecrystals melt into small diameter raindrops withinthe melting layer. This process is different for largesnowflakes: after the initial melting of their surfacelayers, the skeletons of these snowflakes collapse and melt into medium size raindrops with diameters between 2 and 4 mm. As these medium size drops fall, they grow into large raindrops via collision and coalescence. The breakup process becomes important whenthe raindrops exceed a certain size, restraining particle growth and reducing the number concentration oflarge particles. The altitude of the maximum numberconcentrations of large particles increased from 1800m at 0635 BT to 2500 m at 0738 BT, and then increased again to 2800 m at 0830 BT. These changesmay be interpreted in the context of changes in thenumber concentrations of small particles. The numberconcentrations of small particles were higher at all altitudes during the initial stages of the storm; thus, particle growth due to collision and coalescence was moreimportant. The subsequent decrease in the concentrations of small particles gradually reduced the roleof collision and coalescence, resulting in the changesdescribed above. 4. 3 Fitting the RSDs
RSDs are often described using the gamma function:
where N (D) is the RSD (m-3mm-1) , N0 the intercept (m-3 mm-1) , A the slope (mm-1) , D the particlediameter (mm) , Duthe diameter unit (1 mm-1) , and µ the shape factor, which is dimensionless. The gammafunction distribution simplifies to the Marshall-Palmer (M-P) distribution for µ = 0.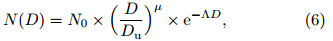
We use nonlinear least squares to fit the gammafunction and the M-P function to the 1647 RSDs retrieved during the storm. The average fitting rate forthe gamma function is 0. 92, while that for the M-Pexponential distribution is 0. 83. The intercept N0 ofthe gamma fitting function varies between 25 and 4828 m-3 mm-1, with an average value of 371 m-3 mm-1 . The interv al between 100 and 1000 m-3 mm-1 contains 86% of N0. The slope varies from 0. 64 to 5. 67mm-1, with a mean value of 2. 31 mm-1 . The shapefactor µ ranges from -3. 66 to 4. 53, with a mean valueof -0. 41. These results indicate that the gamma function provides a suitable description of the RSDs duringthis precipitation event.
Figure 5 shows the retrieved RSDs at three altitudes at 0635 BT, along with the M-P and gammadistribution fits to those retrieved RSDs. The shapefactor varies from -2. 0 at a height of 3000 m (Fig. 5a) to 0. 4 at 2200 m (Fig. 5b) and 2. 0 at 1000 m (Fig. 5c) . The middle portion of the RSD curve changesfrom concave (at 3000 m) to convex (at 1000 m) .
 |
| Fig. 5. Retrieved RSDs (dotted) and the M-P (dashed) , and gamma distribution (solid) fits to those RSDs at (a) 3000-, (b) 2200-, and (c) 1000-m altitudes at 0635 BT. |
Figure 6 shows the temporal and spatial distributions of the gamma function parameters between 0600 and 0900 BT. The intercept and slope increase with decreasing altitude, while the shape parameter changes from negative to positive with decreasing altitude. Table 2 shows the mean value of each parameter at different heights within this period. Figure 7shows RSD curves based on the average values of the gamma function parameters at heights of 3000, 2000, and 1000 m.
 |
| Fig. 6. Time-height cross-sections of the (a) intercept, (b) slope, and (c) shape parameters of the gamma distribution between 0600 and 0900 BT. |
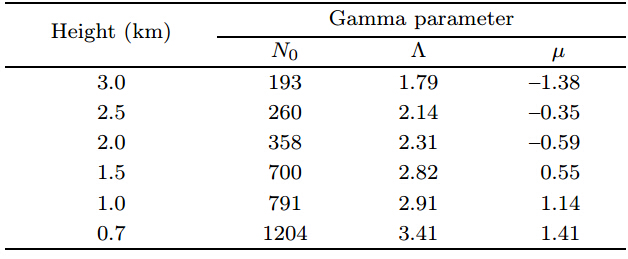
Figure 7 indicates that the number concentrationsof the smallest and largest particles were highest at1000 m, while the number concentrations of mediumsized particles were highest at 3000 m. The rain event on 14 May 2009 was a springtime stratiform precipitation event over North China. The number concentrations of both small and large particles below the melting layer were greater than those estimated by fittingan M-P distribution. This result may be attributedto the combination of processes occurring during themelting of small ice crystals, snowflakes, and snowblocks. Two main processes occurred as raindrops fell. The first was droplet growth due to the collision and coalescence of small drops; the other was the breakupof drops with diameters greater than approximately4 mm. Both of these processes tended to increase the number concentrations of medium-sized raindrops, sothe RSD curve bent upward in the middle of thedroplet size range.
 |
| Fig. 7. Gamma function fits based on the mean values ofparameters at altitudes of 3000, 2000, and 1000 m. |
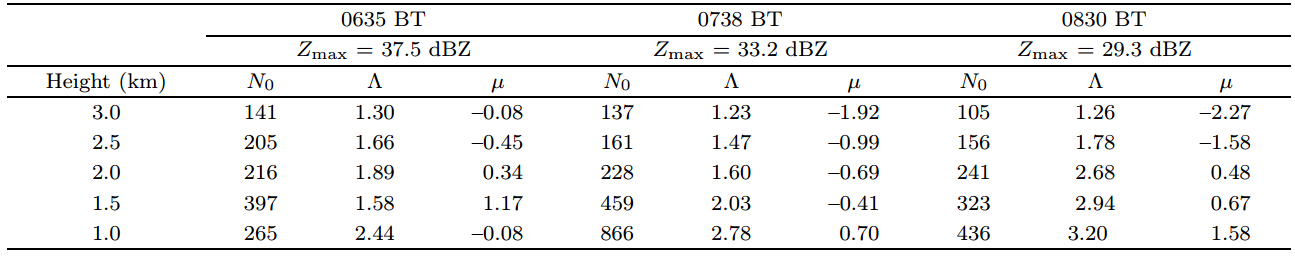
The gamma function parameters at diflerent altitudes at the three representative times are listed inTable 3. The strongest precipitation was observed at0635 BT, while the weakest was observed at 0830 BT. The slope factor A increased with decreasing height at all three times. This parameter increased from 1. 30mm-1at 3000 m to 2. 44 mm-1at 1000 m at 0635BT (when the maximum reflectivity was largest amongthese three representative times) , and from 1. 26 mm-1at 3000 m to 3. 20 mm-1at 1000 m at 0830 BT (whenthe maximum reflectivity was smallest) . The numberconcentrations of large particles rapidly decreased asthe reflectivity weakened. The shape parameter variedfrom -2. 27 at 3000 m to 1. 58 at 1000 m at 0830 BT, when the maximum reflectivity was only 29. 3 dBZ. This result implies a rapid decrease in the numberconcentrations of large raindrops with decreasing altitude.
The retrieved RSDs can also be used to calculate four characteristic raindrop diameters: the average volume diameter D0, the mass-weighted me and iameter Dm, the diameter of the raindrops that contribute most to the liquid water content Dp, and thediameter of the raindrops that contribute most to thereflectivity Dz.
Figure 8 shows time-height cross-sections of thesefour characteristic diameters. The median diameterD0averaged temporally and spatially over this precipitation event was 0. 92 mm, while the average massweighted mean diameter Dm was 1. 19 mm. This latter value is close to the 1. 2-mm average value of Dmin stratiform precipitation reported by Liu and Lei (2006) . The values of D0during the initial, middle, and late stages of the precipitation event were 1. 0, 0. 9, and 0. 91 mm, respectively, while the corresponding values of Dm were 1. 24, 1. 21, and 1. 1 mm. Bothcharacteristic diameters were larger during the initialstage than during the late stage. V alues of Dp and Dzwere positively correlated with reflectivity . The mean value of Dp was 1. 26 mm, with a range of 0. 5 to 2. 56mm. The mean value of Dz was 2. 12 mm, with a rangeof 1. 17 to 3. 74 mm. The values of Dm and Dp wereroughly equiv alent. The average Dzassociated witha reflectivity of 25 dBZ was 1. 99 mm. This value increased to 2. 22 mm for a reflectivity of 30 dBZ and 2. 73 mm for a reflectivity of 35 dBZ. Larger raindropscontributed most to reflectivity . The mean value ofDz was greater during the initial and middle stages ofthis precipitation event than during the late stages.
 |
| Fig. 8. Time-height cross-sections of the raindrop characteristic diameters (a) D0, (b) Dm, (c) Dp, and (d) Dz. |
The retrieved RSDs can also be used to deducethe relationships among liquid water content (M) , rainfall intensity (I) , and reflectivity (Z) during thisrain event. These relationships are typically fit to afunction of the form Z = AMbor Z = AIb. Table 4 lists the parameters A and b for Z - I and Z - Mrelationships at diflerent altitudes. The mean relationship between liquid water content and reflectivity wasZ = 1:69 ×104M1:5. The coe±cient A ranged between 1. 4×10⁴ and 1. 9 ×10⁴, while the exponent b ranged between 1. 41 and 1. 62. Both coe±cients are smaller than those used in the previously derived relationship Z = 2:4 ×10⁴M1:82 (Zhang et al., 2000) .

The change in rainfall intensity (I) is consistentwith reflectivity, so the Z - I relationship is relativelystable. The mean relationship between these variableswas Z = 256I1:4, where the parameter A ranged from230 to 268 and the exponent b ranged from 1. 32 to1. 46. This Z -I relation falls between those previouslyderived for stratiform and convective precipitation, indicating the possible presence of weak convective cellswithin this stratiform rainfall event.
Figure 9 shows the rainfall rate as measured bythe local rain gauge at 10-min interv al, as calculatedfrom the RSDs observed at 1-km altitude, and as derived from the relationship Z = 200I1:6. The rain rateestimated from the observed RSDs is more accurate than the rain rate estimated from the empirical Z - Irelationship. The difference between rain gauge measurements and the estimate based on RSD observ ations was particularly pronounced between 0640 and 0820 BT, while the rain rate calculated from the empirical relationship Z = 200I1:6deviated substantiallyfrom the observ ations, indicating that this relationship may not be appropriate for stratiform clouds withweak convection.
 |
| Fig. 9. Rainfall rates observed by rain gauge, estimated using RSDs retrieved using the WPR, and estimated using an empirical Z-I relationship |
This paper investigates the microphysical characteristics of a stratiform precipitation event. Theevolution and spatial distribution of RSDs during thisevent has been revealed by using observ ations of awind profiler radar. The primary findings are as follows.
(1) It is feasible to retrieve RSDs in stratiformclouds with the 1320-MHz WPR Doppler velocityspectra by leveraging the relationship between particle diameter and raindrop fall speed.
(2) RSDs have been retrieved and analyzed for the stratiform precipitation event on 14 May 2009in Huayin, Shaanxi Province. The intercept N0 and slope A of the gamma distribution increased withdecreasing height. The shape parameter µ also increased with decreasing height, and its sign changedfrom negative at higher altitudes to positive at loweraltitudes. The number concentrations of both thelargest and smallest particles were highest near thebottom of the melting layer, while the number concentration of medium-sized particles increased withdecreasing height below the melting layer. These vertical variations in RSD were caused by the complexinterplay between the growth of smaller particles dueto collision-coalescence and the breakup of larger particles.
(3) F our characteristic raindrop diameters (themedian diameter, the mass-weighted mean diameter, and the diameters of raindrops making the largestcontributions to liquid water content and reflectivity, respectively) have also been retrieved. These characteristic diameters can represent the temporal and spatial variability of RSDs. These four characteristicdiameters show characteristic of both stratiform and convective precipitation. The observed rain event contained a clear bright b and structure, as well as a fewweak convective cells.
(4) The empirical relationship between reflectivity (Z) and rainfall intensity (I) based on the RSDs retrieved during this precipitation event is Z = 256I1:4. The relationship between reflectivity (Z) and liquidwater content (M) is Z = 1:69 ×104M1:5. Additional observ ations and analyses are needed in the futureto obtain the statistical characteristics of RSDs fordiflerent precipitation types and events.
Acknowledgments: The authors thank Dr. Pengfei Zhang at University of Oklahoma for improving the original manuscript in English. The languageeditor for this manuscript is Dr. Jonathon S. Wright.
| Allen, B. W., D. J. Gottas, E. T. Strem, et al., 2002: An automated bright band height detection algorithm for use with Doppler radar spectral moments. J. Atmos. Oceanic Technol., 19, 687-697. |
| Chen Baojun, Li Zihua, and Liu Jicheng, 1998: Model of raindrop size distribution in three types of precipitation. Acta Meteor. Sinica, 56, 506-512. (in Chinese) |
| Gunn, R., and G. D. Kinzer, 1949: The terminal velocity of fall for water droplets in stagnant air. J. Meteor., 6, 243-248. |
| Hildebrand, P. H., and R. S. Sekhon, 1974: Objective determination of the noise level in Doppler spectra. J. Appl. Meteor., 13, 808-811. |
| Huang Yu, Ruan Zheng, Ge Runsheng, et al., 2011: Study on bright band detection using wind profiler radar. Plateau Meteor., 30, 1376-1383. (in Chinese) |
| Kim, D.-K., K. R. Knupp, and C. R. Williams, 2009: Airflow and precipitation properties within the stratiform region of tropical storm gabrielle during landfall. Mon. Wea. Rev., 137, 1954-1971. |
| Kirankumar, N. V. P., T. N. Rao, B. Radhakrishna, et al., 2008: Statistical characteristics of raindrop size distribution in southwest monsoon season. J. Appl. Meteor. Climatol., 47, 576-590. |
| Kobayashi, T., and A. Adachi, 2005: Retrieval of arbitrarily shaped raindrop size distributions from wind profiler measurements. J. Atmos. Oceanic Technol., 22, 433-442. |
| Liao Fei, Deng Hua, Wan Qilin, et al., 2011: Observation studies on characteristics of raindrop size distribution of two typical summer thunderstorm cases in the Pearl River delta. Plateau Meteor., 30, 798-808. (in Chinese) |
| Liu Hongyan and Lei Hengchi, 2006: Characteristics of rain from stratiform versus convective cloud based on the surface raindrop data. J. Atmos. Sci., 30, 693-702. (in Chinese) |
| Lucas, C., A. D. MacKinnon, R. A. Vincent, et al., 2004: Raindrop size distribution retrievals from a VHF boundary layer profiler. J. Atmos. Oceanic Technol., 21, 45-60. |
| Maguire, W. B., II, and S. K. Avery, 1994: Retrieval of raindrop size distributions using two Doppler wind profilers: Model sensitivity testing. J. Appl. Meteor., 33, 1623-1635. |
| Mallet, C., and L. Barthes, 2009: Estimation of gamma raindrop size distribution parameters: Statistical fluctuations and estimation errors. J. Atmos. Oceanic Technol., 26, 1572-1584. |
| Radhakrishna, B., and T. N. Rao, 2009: Multipeak raindrop size distribution observed by UHF/VHF wind profilers during the passage of a mesoscale convective system. Mon. Wea. Rev., 137, 976-990. |
| Rao, T. N., N. V. P. Kirankumar, B. Radhakrishna, et al., 2008: Classification of tropical precipitating systems using wind profiler spectral moments. Part I: Algorithm description and validation. J. Atmos. Oceanic Technol., 25, 884-897. |
| Schafer, R., S. Avery, P. May, et al., 2002: Estimation of rainfall drop size distributions from dual-frequency wind profiler spectra using deconvolution and a nonlinear least squares fitting technique. J. Atmos. Oceanic Technol., 19, 864-874. |
| Sharma, S., M. Konwar, D. K. Sarma, et al., 2009: Characteristics of rain integral parameters during tropical convective, transition, and stratiform rain at Gadanki and its application in rain retrieval. J. Appl. Meteor. Climatol., 48, 1245-1266. |
| Shupe, M. D., P. Kollias, P. O. G. Persson, et al., 2008: Vertical motions in arctic mixed-phase stratiform clouds. J. Atmos. Sci., 65, 1304-1322. |
| Steiner, M., H. Richner, and S. E. Yuter, 1995: Climatological characterization of three-dimensional storm structure from operational radar and rain gauge data. J. Appl. Meteor., 34, 1978-2007. |
| Ulbrich, C. W., and P. B. Chilson, 1994: Effects of variations in precipitation size distribution and fall speed law parameters on relations between mean Doppler fall speed and reflectivity factor. J. Atmos. Oceanic Technol., 11, 1656-1663. |
| Wang Xiaolei, Ruan Zheng, Ge Runsheng, et al., 2010: A study of drop-size distribution in precipitation cloud from wind profile radar. Plateau Meteor., 29, 498-505. (in Chinese) |
| White, A. B., D. J. Gottas, E. T. Strem, et al., 2002: An automated bright band height detection algorithm for use with Doppler radar spectral moments. J. Atmos. Oceanic Technol., 19, 687-697. |
| Williams, C. R., W. L. Ecklund, and K. S. Gage, 1995: Classification of precipitating clouds in the tropics using 915-MHz wind profilers. J. Atmos. Oceanic Technol., 12, 996-1012. |
| —-, —-, P. E. Johnston, et al., 2000: Cluster analysis techniques to separate air motion and hydrometeors in vertical incident profiler observations. J. Atmos. Oceanic Technol., 17, 949-962. |
| Zhang Peichang, Du Bingyu, and Dai Tiepi, 2000: Radar Meteorology. China Meteorological Press, 511 pp. (in Chinese) |
| Zhong Liujun, Ruan Zheng, Ge Runsheng, et al., 2010: Calibration method of echo intensity of wind profile radar. J. Appl. Meteor. Sci., 21, 598-605. (in Chinese) |