 2013, Vol. 27
The Chinese Meteorological Society
Article Information
- WANG Yunfeng, WANG Bin, FEI Jianfang, HAN Yueqi, MA Gang. 2013.
- The Effects of Assimilating Satellite Brightness Temperature and Bogus Data on the Simulation of Typhoon Kalmaegi (2008)
- J. Meteor. Res., 27(3): 415-434
- http://dx.doi.org/10.1007/s13351-013-0309-2
-
Article History
- Received November 26, 2012
- in final form March 12, 2013


2 LASG, Institute of Atmospheric Physics, Chinese Academy of Sciences, Beijing 100029;
3 Satellite Meteorological Center, China Meteorological Administration, Beijing 100081
The results indicate that assimilation of satellite data can improve both the representation of the initial conditions and the subsequent simulation of the typhoon. Different satellite data have different impacts on the typhoon track. In these simulations, data from AMSU-A play a greater role in improving the simulation of the typhoon than data from AMSU-B or HIRS. Assimilation of satellite data significantly affects the simulation of the subtropical high and the steering of the typhoon by the environmental flow. The subtropical high is enhanced and extends westward in the data assimilation experiments. The background flow therefore steers the typhoon more westward, improving the simulated typhoon track. Although direct assimilation of satellite brightness temperature improves the simulated environmental conditions, it does not significantly improve the simulated intensity of the typhoon. By contrast, initializing the typhoon simulation using bogus data in tandem with satellite data improves not only the environmental conditions but also the simulated inner-core structure of the typhoon. Assimilation of both types of data therefore improves the simulation of both the typhoon track and the typhoon intensity. The results of these experiments offer new insight into improving numerical simulations of typhoons.
Typhoons are among the most frequent naturaldisasters that affect human beings. A number of recentstudies have focused on the simulation and predictabilityof typhoons using numerical models(e.g.,Chen and Pan, 2010; Cheng et al., 2011; Zhang et al., 2011; Zhang and Tao, 2013). Accurate predictionsof the track and intensity of a typhoon enable effectivepreventative measures to be enacted in advance,reducing economic losses. Conventional observationdata are sparse over the oceans. Objective analysesare therefore typically unable to describe the thermalstructure and circulation characteristics of a developing typhoon precisely. This deficiency is particularlypronounced with respect to the mesoscale structuresof typhoons, and results in serious errors in numericalforecasts. The provision of more accurate initial conditionswould greatly improve numerical simulationsof typhoons, and is therefore an urgent task.
Typhoon forecasts are often initialized using anartificial tropical cyclone(Iwasaki et al., 1987; Mathur,1991; Kurihara et al., 1993). An ideal bogus typhoonmodel with elaborate circulation and thermal structuresis constructed according to the observationaldata and then implanted into the environmental fields.This method has been shown to greatly improve theskill of tropical cyclone numerical forecasts, and iswidely applied in operational prediction systems inmany countries. For example,the well-known GeophysicalFluid Dynamics Laboratory(GFDL)hurricanemodel is run operationally with a multiply-nestedmovable mesh(grid resolution as high as 6 km) and a very sophisticated model initialization(Kurihara et al., 1995).
The development and application of the BogusData Assimilation(BDA)scheme has exp and ed therole of idealized bogus data in numerical simulationsof typhoons(Zou and Xiao, 2000). Xiao et al.(2000,2009)showed that the BDA scheme could reduce errorsin simulations of both typhoon track and intensity, and Pu and Braun(2001)reported that the assimilationof a bogus vortex played an important role in theadjustment of the initial fields in simulations of hurricanesGeorges and Bonnie.
The rapid development of satellite observationsystems has enhanced the role of remote sensing datain numerical weather prediction. For example,assimilationof satellite data can greatly improve typhooninitialization schemes. Zou et al.(2001)successfullyinitialized a typhoon simulation by assimilating GeometryEngine-Open Source(GEOS)observed brightnesstemperature using the four-dimensional variational assimilation(4DVAR)technique. Their results showedthat satellite data assimilation substantially improvedsimulations of typhoon track,intensity, and precipitation.Le Marshall et al.(2002)reduced the errors in atyphoon track forecast from 400 to 150 km by assimilatinghigh-resolution observations(including satellitedata)into the interior structure of the initial typhoon.Wang et al.(2003)also obtained improved simulationsof tropical cyclones by assimilating bogus data,cloud motion winds, and satellite observations into anumerical model using 4DVAR. Zhang et al.(2004)concluded that direct assimilation of AMSU brightnesstemperature described the three-dimensional structure and evolution of a typhoon better than routine observationaldata. Zapotocny et al.(2008)also indicatedthat assimilation of AMSU-A data improvedthe forecast of a typhoon track,while Wang et al.(2010)showed that the mesoscale structure of a typhooncould be reconstructed in the Mesocale Model5(MM5)using the BDA in t and em with assimilationof AMSU-A brightness temperature data.
In this paper,the BDA and satellite data assimilationtechniques are combined to study TyphoonKalmaegi(2008). The BDA technique used here iscomprehensively derived from the work of Mathur(1991),Kurihara et al.(1993,1995),Wang et al.(1996), and Wang et al.(2009). The assimilatedsatellite data include observations from the AdvancedMicrowave Sounding Unit-A(AMSU-A),the AdvancedMicrowave Sounding Unit-B(AMSU-B), and the High-resolution Infrared Sounder(HIRS)from theNational Oceanic and Atmospheric Administration-16(NOAA-16)Advanced TIROS Vertical Sounder(ATOVS)satellite instrument package. The data assimilationaffects both the structure of the environmentalfields and the interior structure of the typhoon.Analysis of the optimal initial fields reveals the physicalfactors that most effectively improve the numericalforecast of the typhoon.
This paper is organized as follows. The numericalmodel,observational data, and cost function areintroduced briefly in Section 2. The experimental design and numerical results are described in Section 3.Section 4 provides a summary of the results and conclusions.2. Numerical model,observational data, and cost function2.1 Numerical model
The Weather Research and Forecasting(WRF)model(version 3.2) and the WRF data assimilationsystem(WRFDA)are used for the numerical simulations.The Radiative Transfer for TIROS-N OperationalVertical Sounder(RTTOV)version 8.7 modelingsystem is used to incorporate the ATOVS observations.The WRF model is a fully-compressible nonhydrostaticmodel with a hydrostatic option. The verticalcoordinate is a terrain-following hydrostatic pressurecoordinate, and the horizontal grid is an ArakawaC-grid.
The model domain used for this study is centeredat 30.0°N,120.0°E. Two nested domains withgrid sizes of 45 km(outer domain) and 15 km(innerdomain)are designated(Fig. 1). The grid dimensionsare 64 × 68 and 124 × 163 for outer and inner domains,respectively. The vertical coordinate consistsof 35 η layers. The following physical parameterizationschemes are selected in both domains: the WRFSingle-Moment 3-class(WSM-3)microphysics scheme,the Rapid Radiative Transfer Model(RRTM)longwaveparameterization(Chou and Suarez, 1999),theDudhia shortwave parameterization,the Yonsei University(YSU)boundary layer parameterization(Hong et al., 2006), and the updated Kain-Fritsch cumulusparameterization(Kain,2004).
 |
| Fig. 1. The observed best track of Typhoon Kalmaegibetween 0000 UTC 17 and 0000 UTC 20 July 2010. Domains A and B indicate the outer and inner domains usedin this study. |
The WRFDA is an advanced data assimilationsystem that provides a variety of state-of-theart3DVAR/4DVAR and hybrid variational/ensembledata assimilation techniques. The assimilation domains and physical parameterizations used in WRFDAare the same as those used in WRF.
The RTTOV model was originally designed by Eyre and Woolf(1988) and developed at the ECMWFin the early 1990s. It allows the forward simulationof radiances from satellite infrared or microwavenadir-scanning radiometers. Version 8.7 of the RTTOVmodel includes the complicated nonlinear relationshipsbetween satellite brightness temperature and model variables. The WRF model provides the necessaryphysical parameters to RTTOV. The brightnesstemperature for each channel is simulated by dividingthe atmosphere between 0.1 and 1013.3 hPa into 43levels based on the real vertical structure of the atmosphere.The transmittance is then calculated level bylevel.2.2 Data
The first-guess field is produced using NCEP/GFS(Global Forecast System)analysis data with aspatial resolution of 1°×1°. Observations of the typhoonused in the bogus technique are obtained fromthe best track data provided by the China MeteorologicalAdministration. Bogus data are constructedat st and ard pressure levels, and then implanted intothe initial fields. The typhoon initialization schemeused here is derived from Mathur(1991),Kurihara etal.(1993,1995),Wang et al.(1996), and Wang etal.(2009). A typhoon-like vortex(which will be referredto as the analyzed vortex)is removed from theanalysis and replaced with a specified vortex(whichis realistic and compatible with the model). In otherwords,the initial field is given by the global analysisminus the analyzed vortex plus the specified vortex.The method for removing the analyzed vortexfollows Kurihara et al.(1993,1995), and the methodfor determining and adding the specified vortex follows Mathur(1991),Wang et al.(1996), and Wang etal.(2009).
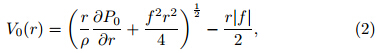
The sea level pressure(SLP) and wind fields are constructed using the following equations:
where Pc is the central SLP of the observed typhoon,ΔP is a parameter related to the typhoon SLP gradient(as determined by the maximum wind),R is theradius of the maximum SLP gradient(which usuallycorresponds to the maximum wind),r is the radius ofthe vortex, and ρ is air density. The SLP and windfields are then assimilated into the numerical modelusing the 3DVAR technique. For Typhoon Kalmaegiat 0000 UTC 17 July 2008,Pc = 975 hPa,Vmax = 33m s−1, and R = 80 km.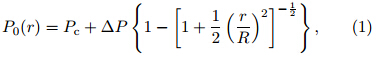
The satellite data are taken from NOAA-16ATOVS(HIRS,AMSU-A, and AMSU-B),as providedby the National Aeronautics and Space Administration(NASA). HIRS has a total of 20 channels,AMSUAhas a total of 15 channels, and AMSU-B has a totalof 5 channels. Quality control,channel selection, and cloud identification are performed according to the defaultsettings in the WRFDA model. Bias correction and data thinning are not applied. Figure 2 showsthe distributions of AMSU-A channel 5 brightnesstemperatures at 2016 UTC 16,2152 UTC 16, and 0734 UTC 17 July 2008. The distributions of brightnesstemperatures observed by HIRS and AMSU-B aresimilar to those observed by AMSU-A(figure omitted).
 |
| Fig. 2. Distributions of AMSU-A channel 5 brightness temperatures (K) at (a) 2016 UTC 16, (b) 2152 UTC 16, and (c) 0734 UTC 17 July 2008. |
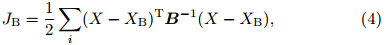
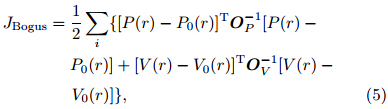
The cost function for the 3DVAR multifold(bogus,HIRS,AMSU-A, and AMSU-B)data assimilationexperiments is defined as
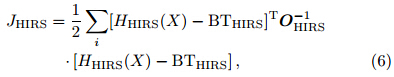
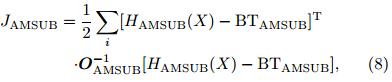
where JB is the difference between the model controlvariable X and the background variable XB,JBogus isthe difference between the simulated and observed bogusdata,JHIRS is the difference between the simulated and observed HIRS data, and so on. These variablesare defined as follows.where the superscript T represents matrix transpose,B is the background error covariance matrix,P(r) and V(r)represent the simulated SLP and wind fields,respectively,OP and OV are the error covariance matricesfor the SLP and wind fields,respectively,symbolΣ represents summation, and subscript i representsdifferent observation points at the same time. HHIRS,HAMSUA, and HAMSUB are forward radiative transferoperators for HIRS,AMSU-A, and AMSU-B,respectively.BT represents the brightness temperature and O the error covariance matrix of the observed satellitedata,with the satellite instrument indicated by thesubscript.3. Numerical experiments3.1 Typhoon Kalmaegi(2008)

Typhoon Kalmaegi(2008) formed over the oceannortheast of the Philippines on 15 July 2008. It thenmoved toward the Taiwan Isl and ,making a directl and fall in northern Taiwan Region at 1500 UTC 17July 2008 before emerging into the Taiwan Strait. Thetyphoon made a second l and fall in Fujian Province at1200 UTC 18 July 2008,with wind speed of approximately23 m s−1. It moved into the Yellow Sea and raced toward the Korean Peninsula shortly afterwards,eventually moving inl and over North Korea.
This study emphasizes the evolution of the typhoon,its track, and its l and ing position. The dataassimilation experiments are initialized at three times:1800 UTC 16,0000 UTC 17, and 0600 UTC 17 July.Each forecast is integrated for 72 h.3.2 Satellite data assimilation3.2.1 Experimental design
The effect of satellite data assimilation is studiedthrough three control experiments(Ctrl−00,Ctrl_06, and Ctrl−12) and 21 assimilation experiments(7 ateach of the 3 initialization times),as described in Table 1. The initial fields for the control runs are from theNCEP data,with no assimilation of satellite brightnesstemperature. Different sets of satellite brightnesstemperature data are assimilated in each of the assimilationexperiments. The assimilation time windowsare set as [–4 h,+4 h] to enable the assimilation ofmore satellite observations.
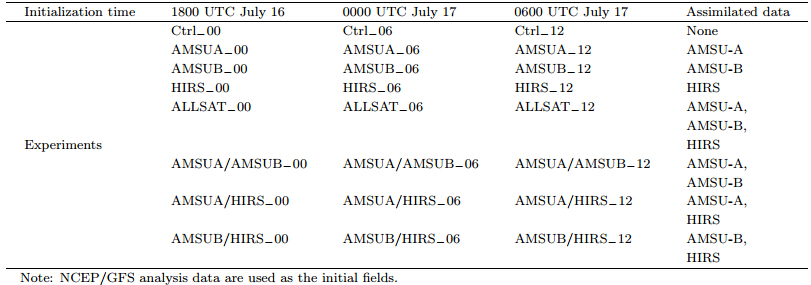
Figure 3 shows the typhoon tracks simulated bythe different experiments with initialization times at1800 UTC 16,0000 UTC 17, and 0600 UTC 17 July.The observed typhoon track(denoted by the typhoonsymbol)has four characteristics:(1)the typhoon makes its first l and fall in Taiwan,(2)the typhoon l and sin Fujian Province after passing through the TaiwanStrait,(3)the typhoon turns northeastward after l and ingin mainl and China, and (4)the typhoon moves outinto the sea. The tracks simulated by the control runs(Ctrl−00,Ctrl_06, and Ctrl−12)diverge substantiallyfrom the observed track, and the above characteristicsof the actual typhoon track are not captured accurately.
 |
| Fig. 3. Typhoon tracks simulated by different data assimilation experiments(shown in Table 1)with initialization times at(a,b)1800 UTC 16,(c,d)0000 UTC 17, and (e,f)0600 UTC 17 July. |
Figures 3a and 3b show the results of the experimentsinitialized at 1800 UTC 16 July. The assimilationof AMSU-A data moves the simulated typhoontrack(AMSUA−00)closer to the observed track relativeto the control experiment(Ctrl−00); however,the simulated typhoon still does not make l and fall inTaiwan. The simulated typhoon does make l and fall inmainl and China,but the l and ing position is about 350km from the best track. The assimilation of AMSUBdata(AMSUB−00)offers no obvious improvementover the control run. In fact,the performance ofAMSUB−00 is worse than that of Ctrl−00 at sometimes. The assimilation of HIRS data(HIRS−00)also offers no obvious improvement,with the simulatedtyphoon missing both the Taiwan Region and mainl and China. Assimilating all the satellite data(ALLSAT−00)improves the simulated track of thetyphoon substantially. Although the simulated typhoonstill does not l and in the Taiwan Region,itdoes l and in mainl and China(although this l and ingmisses the actual location by about 250 km). Thetracks from experiments AMSUA/AMSUB−00 and AMSUA/HIRS−00 provide even greater improvementover the control simulation,whereas the track fromAMSUB/HIRS−00 offers no obvious improvement.
Figures 3c and 3d show the results of the experimentsinitialized at 0000 UTC 17 July. Thoseassimilating only HIRS or AMSU-B data again indicatelittle or no improvement in the typhoon trackrelative to the control run. However,assimilation ofthe AMSU-A data either alone or together with othersatellite data improves the simulated typhoon tracksubstantially. The simulated typhoon l and s in boththe Taiwan Region and mainl and China when AMSUAdata are assimilated,with l and ing positions veryclose to the observed.
Figures 3e and 3f show the results of the experimentsinitialized at 0600 UTC 17 July. Asabove,the tracks of the simulated typhoon are closerto the best track for experiments that assimilateAMSU-A data(AMSUA−12,AMSUA/AMSUB−12,AMSUA/HIRS−12, and ALLSAT−12). Thesimulated l and ing positions in AMSUA−12 and AMSUA/AMSUB−12 are approximately 200 km awayfrom the best track, and even closer for ALLSAT−12 and AMSUA/HIRS−12. By contrast,the assimilationof HIRS or AMSU-B data alone offers little improvementin the simulated typhoon track. Assimilationof AMSU-A data improves forecasts of this typhoonmore effectively than assimilation of AMSU-B or HIRSdata.
Figure 4 shows the errors in the tracks simulatedby different experiments. The control experiments(Ctrl−00,Ctrl_06, and Ctrl−12)all produce substantialerrors relative to the best track. These errors tend to increase with time. The largest error forCtrl−00 is greater than 400 km(at 54 h),the largesterror for Ctrl_06 is also greater than 400 km(at 72h), and the largest error for Ctrl−12 is approximately350 km(at 72 h).
 |
| Fig. 4. Errors in simulated typhoon tracks relative to the best track for experiments with initialization times at(a)1800 UTC 16,(b)0000 UTC 17, and (c)0600 UTC 17 July. |
The errors in the typhoon tracks simulated bydifferent experiments initialized at 1800 UTC 16July are shown in Fig. 4a. The largest errorsin the tracks simulated by experiments HIRS−00 and AMSUB−00 are larger than those simulated byCtrl−00. The largest error is nearly 550 km whenonly the HIRS data are assimilated, and 450 kmwhen only the AMSU-B data are used. The largesterror is substantially lower(350 km)when AMSUAdata are assimilated alone, and lower still(about300 km)when all of the satellite data are assimilated(experiment ALLSAT−00). The errors in the typhoontracks simulated by AMSUA/AMSUB−00 and AMSUA/HIRS−00 are also much smaller than the errorsassociated with Ctrl−00.
The errors in the typhoon tracks simulated by theexperiments initialized at 0000(0600)UTC 17 Julyare shown in Fig. 4b(Fig. 4c). The errors in typhoontracks from the data assimilation experimentsare smaller than those from the control runs(Ctrl_06 and Ctrl−12). Experiments that assimilate AMSU-Adata generally have smaller track errors.3.2.3 Typhoon intensity simulation
Figure 5 shows variations in the observed and simulatedcentral SLPs in different assimilation experimentsinitialized at 0000 UTC 17 July. The observedcentral SLP is 975 hPa at the initial time, and thengradually increases to 998 hPa at the final time. Thecentral SLP in the control experiment is always relativelyweak,with fluctuations around 1000 hPa. Theassimilation of ATOVS data offers no obvious improvementin the simulated central SLP. The model onlyassimilates satellite data under clear-sky conditions,with satellite brightness temperature data near the typhooncenter eliminated during data quality control.It is therefore difficult to improve simulations of typhoonintensity solely by assimilating satellite data.
 |
| Fig. 5.Variations of the observed and simulated central SLPs in different assimilation experiments initialized at 0000 UTC 17 July. |
The simulated typhoon track is closely related tothe initial wind fields. Figure 6 shows differences in theinitial wind fields at 500 hPa between the assimilation and the control experiment initialized at 0000 UTC17 July. The distribution of the initial wind field at500 hPa in the control experiment(Fig. 6a)shows thatTyphoon Kalmaegi is located to the east of the TaiwanRegion with a maximum wind speed of 30 m s−1 nearthe typhoon center. For brevity,differences are onlyshown for the assimilation experiments AMSUA_06,AMSUB−06,HIRS−06, and ALLSAT−06.
 |
| Fig. 6. Distributions of the initial wind field(m s−1)at 500 hPa in experiment Ctrl_6 and differences in that between Ctrl_06 and the various assimilation experiments initialized at 0000 UTC 17 July.(a)Ctrl_06,(b)AMSUA_06 –Ctrl_06,(c)AMSUB_06 – Ctrl_06,(d)HIRS_06 – Ctrl_06, and (e)ALLSAT_06 – Ctrl_06. |
Assimilation of AMSU-A data introduces a clockwiseanticyclonic anomaly centered at 32°N,118°E at500 hPa(Fig. 6b). The difference in the maximumwind speed near the typhoon center is 5 m s−1 or so.This anticyclonic anomaly acts to decrease the intensityof the simulated typhoon,but it also embeds thetyphoon in a more westward environmental flow. Thetyphoon simulated in experiment Ctrl_06 is locatedeast of the best track,so this more westward environmentalflow pushes the track of the simulated typhooncloser to the best track. This enables AMSUA_06to more accurately capture the characteristics of theobserved typhoon track,i.e,the first l and fall in theTaiwan Region and second over mainl and China aswell as the subsequent right turn and return to theocean. Assimilating AMSU-B data introduces a cyclonicanomaly at 500 hPa(Fig. 6c),with a differenceof about 3 m s−1 in the maximum wind speed near thetyphoon center. This cyclonic wind anomaly increasesthe intensity of the simulated typhoon,but preventsit from moving westward.
Assimilating HIRS data introduces a anticyclonicvortex over the ocean to the east of the Taiwan Region(Fig. 6d). The change in the maximum windspeed near the typhoon center is approximately 2 ms−1. This anticyclonic anomaly decreases the intensityof the simulated typhoon. These differences inthe initial wind field will initially push the typhoonwestward,but turn the typhoon toward the right earlierthan observed,when the typhoon approaches theTaiwan Region. Assimilation of HIRS data thereforemakes the simulated typhoon track more accurate atthe beginning of the simulation,but offers little improvementduring later periods.
The difference in the initial wind field when allsatellite data are assimilated(Fig. 6e)is very similarto that when only AMSU-A data are assimilated(Fig. 6b),although the locations of the anticyclonicanomalies are somewhat different between the twocases. This similarity in the changes of the initial windfield between ALLSAT_06 and AMSUA_06 results insimilar modifications to the track of the simulated typhoon,again leading to a more accurate characterizationof the observed track than in the control case. Asin AMSUA_06,the difference in the maximum windspeed near the typhoon center is about 5 m s−1.
Figure 7a shows the initial vertical distribution ofgeopotential along 22°N in Ctrl_06. The magnituderanges approximately 104–105 m2 s−2 over the freetroposphere. Assimilating AMSU-A data(Fig. 7b)orHIRS data(Fig. 7d)introduces a positive incrementin geopotential in the lower and mid troposphere nearthe typhoon center(22°N,123°E),which acts to decreasethe initial intensity of the typhoon. The effectof assimilating AMSU-B data(Fig. 7c)is the opposite,with negative geopotential increments in the lower and mid troposphere that act to increase the initial intensity of the typhoon. The effect of assimilating themultifold satellite data(Fig. 7e)is qualitatively similarto the effect of assimilating only AMSU-A(Fig. 7b),but the amplitude of the changes in geopotentialis larger when all three sets of satellite data are assimilated.The subtropical high is located near 26°N. Anenhancement of the initial geopotential in the lower and mid troposphere can therefore intensify the subtropicalhigh and cause it to extend westward. Thechanges in geopotential in Fig. 7 also correspond tothe changes in central SLP in Fig. 5.
 |
| Fig. 7. As in Fig. 6,but for the initial vertical distributions of geopotential(m2 s−2)along 22°N. |
Figure 8a shows the initial distributions of geopotentialat 500 hPa for Ctrl_06 and ALLSAT_06. Assimilatingall satellite data increases the initial geopotential,strengthening the subtropical high, and causingit to extend west-ward. The intensification of thesubtropical high promotes the initial westward movementof the simulated typhoon. The westward extensionof the subtropical high contributes to the subsequentright turn and northward movement of the typhoon.
 |
| Fig. 8. Distributions of geopotential(m2 s−2)at 500 hPa for the control experiment Ctrl_06(black contours) and for the multifold satellite assimilation experiments(colored contours)initialized at 0000 UTC 17 July(a)without the bogus technique and (b)with the bogus technique. |
Figure 9a shows the initial vertical distributionsof temperature along 22°N in Ctrl_06. Its magnitudeis on the order of 102 K. The assimilation of satellitedata mainly changes the vertical distribution oftemperature between 122° and 134°E(Figs. 9b–9e).This is the area that was covered by the satellite orbitat 2016 UTC 16 July 2008(Fig. 2a). AssimilatingAMSU-A data(Fig. 9b)leads to increases of temperaturein the lower and mid troposphere and decreasesof temperature in the upper troposphere near 130°E.Wang et al.(2010)also showed a decrease in temperatureat upper levels after assimilating AMSU-A datausing the 4DVAR technique. The changes in temperaturein the lower and mid troposphere can enhance thesubtropical high and are therefore helpful in promotingthe westward movement of the simulated typhoon.Assimilating AMSU-B data(Fig. 9c)or HIRS data(Fig. 9d)leads to qualitatively opposite changes in thevertical distribution of temperature: decreases in thelower and mid troposphere near 130°E but increasesin the upper troposphere. Assimilation of all satellitedata(Fig. 9e)leads to very complicated changes inthe vertical distribution of temperature. The final resultsrepresent the combined effect of the individualsatellite data sets,with alternating increases and decreasesin temperature over the area near 130°E. Becauseof the complexity of the temperature increment,the simulated typhoon track should be considered inthe context of other physical fields(Figs. 6–8).
 |
| Fig. 9. As in Fig. 7,but for temperature(K). |
Three control experiments(Bogus_00,Bogus_06, and Bogus_12) and 21 experiments are designed tostudy the impact of satellite data assimilation in t and emwith the bogus technique(Table 2). As before,3 sets of 8 experiments are initialized at 1800 UTC16,0000 UTC 17, and 0600 UTC 17 July,respectively.The bogus data on st and ard levels are constructed and implanted into the initial fields,while SLP and sealevel wind data are constructed and assimilated intothe model by using the 3DVAR technique. Satellitedata are also assimilated into the model by using the3DVAR technique. The physical parameters used inthese experiments are identical to those used in theexperiments listed in Table 1.
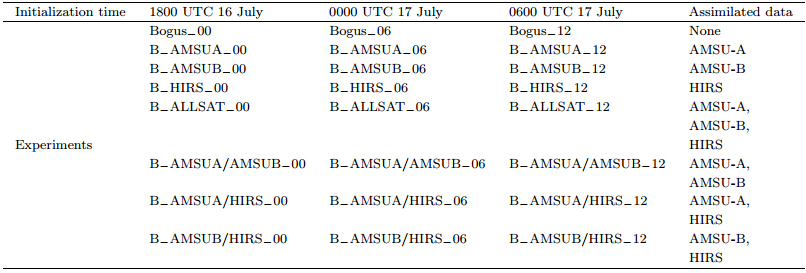 |
Figure 10 shows the typhoon tracks simulated bythe combined bogus and data assimilation experimentsinitialized at 1800 UTC 16,0000 UTC 17, and 0600UTC 17 July. The typhoon tracks simulated by thecontrol runs with bogus data(Bogus_00,Bogus_06, and Bogus_12)are closer to the best track than thosesimulated by the control runs without bogus data(Ctrl_00,Ctrl_06, and Ctrl_12). The bogus data and the BDA technique are applied in all the data assimilationruns listed in Table 2. The remainder of thissection will focus on the effects of assimilating differentcombinations of satellite data.
 |
| Fig. 10. As in Fig. 3,but for the combined bogus and satellite data assimilation experiments(shown in Table 2). |
Figures 10a and 10b show the tracks from the experimentsinitialized at 1800 UTC 16 July. The trackfrom Bogus_00 is better than that from Ctrl_00,withTC l and ings on both the northern coast of the TaiwanIsl and and mainl and China(although the exact l and inglocations differ and are incorrect). The track fromBogus_00 is to the east of the best track. Assimilationof AMSU-A data(B−AMSUA_00)shifts thesimulated typhoon track to the west of the best track.The simulated l and ings are to the south of the observedones, and the simulated typhoon moves moreslowly than the observation. The track simulated byB_AMSUB_00 is largely consistent with the observedtrack at the beginning of the simulation, and the simulatedtyphoon l and s in the Taiwan Region at nearlythe same location as the actual typhoon. The simulatedtyphoon moves in a wrong direction after itsfirst l and ing,however; so it l and s at a wrong locationwhen it reaches mainl and China. Furthermore,thesimulated typhoon moves too fast and returns to theocean earlier than the observation.
Assimilating HIRS data(B_HIRS_00)results ina simulated typhoon firstly l and ing to the south of theobserved location,but largely consistent with the besttrack for its second l and ing over mainl and China. Theposition where the simulated typhoon moves back tothe ocean again is to the south of the best track. Assimilatingall satellite data(B_ALLSAT_00)resultsin a typhoon track that is between the tracks simulatedby B_HIRS_00 and B_AMSUA_00. This indicatesthat the simulated typhoon track reflects thecombined effects of the multifold satellite data. Thetrack simulated when AMSU-B and HIRS data are assimilatedin t and em(B_AMSUB/HIRS_00)has substantialerrors relative to the best track. By contrast,B_AMSUA/AMSUB_00 and B−AMSUA/HIRS_00yield more accurate tracks than Bogus_00.
The tracks simulated by the experiments initializedat 0000 UTC 17 July are shown in Figs. 10c and 10d. The track from Bogus_06 is considerably closerto the best track than that from Ctrl_06. The simulatedtyphoon makes its first l and fall at almost thesame location as the observation,but its second l and ingposition in mainl and China is incorrect. The tracksfrom B_AMSUB_06,B_AMSUB/HIRS_06, and B_ALLSAT_06 are worse than that from Bogus_06.Satellite data assimilation has a positive effect on thesimulations of typhoon track in all other experiments.
The typhoon tracks simulated by the experimentsinitialized at 0600 UTC 17 July are shown in Figs.10e and 10f. The track in Bogus_12 is again closer tothe best track than that in Ctrl_12. The simulatedfirst l and ing position is almost the same as the besttrack,but the second l and ing location is again incorrect.The simulated typhoon tracks are improved bysatellite data assimilation in all experiments exceptB_AMSUB/HIRS_12. Experiment B_ALLSAT_12gives the most accurate typhoon track.
Figure 11 shows the track errors associated withthe bogus data experiments. The errors in thetracks simulated by the three control runs with bogusdata(Bogus_00,Bogus_06, and Bogus_12)aresmaller than the three control runs without bogus data(Ctrl_00,Ctrl_06, and Ctrl_12). The largest errorsin the control runs with bogus data are approximately200 km.
 |
| Fig. 11. As in Fig. 4,but for the combined bogus and satellite data assimilation experiments as shown in Table 2. |
The errors in the tracks from the experiments initializedat 1800 UTC 16 July are shown in Fig. 11a.Assimilating HIRS data improves the track simulationsignificantly. The errors in B_HIRS_00 increasegradually throughout the simulation,but are alwaysless than 130 km. The errors in B_AMSUA_00 aremuch smaller than those in Ctrl_00(Fig. 4a),with amaximum error of approximately 200 km. However,these errors are comparable to those in Bogus−00.The errors in B_AMSUB_00 are consistently less than100 km over the first 54 h, and the errors between54 and 72 h are still less than 200 km. Assimilatingall satellite data(B_ALLSAT_00)yields track errorsof less than 120 km over the first 66 h and lessthan 180 km over the full 72-h period. The errors inB_AMSUA/AMSUB_00 and B_AMSUA/HIRS_00are sometimes smaller and sometimes larger than thosein Bogus_00,with a maximum error of less than 140km. The errors in B_AMSUB/HIRS_00 are far largerthan those in Bogus_00,with a maximum of approximately420 km.
Figure 11b shows the errors in the typhoontracks from the assimilation experiments initializedat 0000 UTC 17 July. Assimilating onlyHIRS data(B_HIRS_06)or only AMSU-A data(B_AMSUA_06)results in smaller errors than anyother combination of satellite data. The largest errorin these two simulations is less than 130 km.The errors in B_AMSUB_06 are larger than thosein Bogus_06 but smaller than those in Ctrl_06(Fig. 4b),with a maximum error of nearly 270 km. Assimilatingall satellite data(B_ALLSAT_06)yieldsa maximum track error of about 220 km. Thistrack simulation is again more accurate than that offeredby Ctrl_06(Fig. 4b),but less accurate thanthat by Bogus_06. The simulated track errors inB_AMSUA/AMSUB_06 and B−AMSUA/HIRS_06are comparable to those in Bogus_06,with maximumerrors of less than 200 km in each experiment. The errorsin B_AMSUB/HIRS−06 are far larger than thosein Bogus_06,with maximum errors of almost 400 km.
Figure 11c shows the errors in the typhoontracks from the assimilation experiments initializedat 0600 UTC 17 July. Assimilating only one typeof satellite data(B_AMSUA_00,B_AMSUB_00, and B_HIRS_00)results in errors consistently lessthan 220 km. These results are much more accuratethan those of Ctrl_12(Fig. 4c). Theerrors in B_AMSUA_00 are even smaller thanthose in Bogus_12. Assimilating all satellite data(B_ALLSAT_12)reduces the simulated track errorsstill further,with a maximum error of lessthan 150 km during the 72-h integration. Thesimulated track errors in B−AMSUA/AMSUB_12,B−AMSUA/HIRS_12, and B_AMSUB/HIRS_12 areall larger than those in the other experiments withbogus data. The maximum errors in these simulationsexceed 300 km.3.3.3 Typhoon intensity simulation
Figure 12 shows the temporal variation of the centralSLP of the observed(best track)typhoon and the typhoons simulated by the combined bogus and satellite data assimilation experiments initialized at0000 UTC 17 July. The introduction of the bogusdata significantly affects the simulation of the centralSLP. The initial central SLP of the simulated typhoonis reduced in each experiment relative to the experimentswithout bogus data,with values much closerto the observed value of 975 hPa. However,this reductionpersists too long in all the experiments exceptB_ALLSAT_06. The central SLP of the simulated typhoonsin all the other experiments is much less thanthe observed toward the end of the 72-h integrationperiod. Unlike the other experiments,B_ALLSAT_06produces a good simulation of the evolution of typhoonintensity in this case. This indicates that the bogustechnique overestimates the intensity of TyphoonKalmaegi while assimilating all satellite data appearsto largely correct this deficiency,so typhoons may besimulated most accurately when the bogus techniqueis used in t and em with satellite data assimilation.
 |
| Fig. 12. As in Fig. 5,but for the combined bogus and satellite data assimilation experiments as shown in Table 2. |
Figure 13 shows the initial distributions of the500-hPa wind field and SLP in Bogus_06 along withthe changes in these initial distributions after assimilatingall satellite data in B_ALLSAT_06. Both experimentsare initialized at 0000 UTC 17 July. Figure 13a shows the distribution of the initial wind field at500 hPa in Bogus_06. Typhoon Kalmaegi is located tothe east of the Taiwan Region with a maximum windspeed of about 30 m s−1 near the typhoon center. Figure 13b shows the change in the initial wind field at 500hPa after assimilating all satellite data. Assimilatingthe satellite data introduces an anticyclonic anomalycentered near 34°N,113°E,which promotes the initial westward movement of the typhoon. The change inthe wind at the typhoon center is approximately 5 ms−1. Figure 13c shows the distribution of the initialSLP in Bogus_06. The initial typhoon is significantlystronger than that simulated by Ctrl_06. Figure 13dshows the change in the initial SLP fields after assimilatingall satellite data. Assimilating the satellite dataintroduces a weak positive anomaly in SLP(maximum7 hPa or so)centered near 32°N,118°E. This changeshows that assimilating satellite data weakens the initialtyphoon.
 |
| Fig. 13. Distributions of(a)the initial wind field(m s−1)at 500 hPa in experiment Bogus_06,(b)the change in the initial wind field(m s−1)at 500 hPa after assimilating all satellite data(experiment B_ALLSAT_06),(c)the initial SLP field(hPa)in experiment Bogus_06, and (d)the change in the initial SLP field(hPa)after assimilating all satellite data. |
Figure 14 shows the initial vertical distributionsof temperature and geopotential along 22°N inBogus_06,along with how these fields are changed bythe assimilation of satellite data in B_ALLSAT_06.Figure 14a shows that the initial temperature near thetyphoon center typhoon is warmer than the surroundingareas. Figure 14b shows that satellite data assimilationintroduces a warm temperature anomaly between300 and 400 hPa,which may have strengthenedthe typhoon. Figure 14c shows that the geopotentialnear the typhoon center is lower than in the surroundingareas. Figure 14d shows that the geopotential typicallyincreases in the lower and mid troposphere. Thischange weakens the typhoon while enhances the subtropicalhigh,which helps to promote the initial westwardmovement of the simulated typhoon as shown inFig. 8b.
 |
| Fig. 14. Vertical distributions along 22°N of(a)the initial temperature field(K)in experiment Bogus_06,(b)the change in the temperature field(K)after all satellite data are assimilated(experiment B_ALLSAT_06),(c)the initial geopotential field(m2 s−2)in experiment Bogus_06, and (d)the change in the geopotential field(m2 s−2)after allsatellite data are assimilated. |
The typhoon track is predominantly determinedby three aspects,i.e.,the steering by the environmentalflow,the interior structure of typhoon, and theinteraction between the above two factors. The environmentalsteering has a greater effect on a relativelyweak typhoon. Assimilation of satellite data improvesthe representation of the steering flow,enabling a betterprediction of the typhoon track. The results ofthese experiments suggest that satellite data assimilationcan modify the intensity of the simulated subtropicalhigh and prompt it to extend westward or retreateastward. These changes in the subtropical high then influence the movement of the typhoon. However,satellite data assimilation does not have a large impacton the intensity of the simulated typhoon. Combiningthe bogus technique with satellite data assimilationimproves the representation of the interior structureof the typhoon,enabling a better simulation ofits intensity. Although the overall results are greatlyimproved in the bogus data assimilation experiments,this does not mean that bogus data assimilation outperformssatellite data assimilation. The satellite dataassimilated in these experiments may contribute moretoward improving the environmental conditions thanimproving the inner structure of the typhoon. The bogusdata exerts such a large impact because it changesthe inner structure of the typhoon and improves therepresentation of the initial vortex.4. Summary and discussion
This study has investigated the effects of assimilatingmultifold datasets(including bogus data,HIRSdata,AMSU-A data, and AMSU-B data)on simulationsof Typhoon Kalmaegi(2008). The simulationsare conducted using the Advanced Research WRFmodel with the 3DVAR technique. Three groups ofdata assimilation experiments are initialized at threedifferent times,with each experiment assimilating adifferent combination of datasets. The results are summarizedas follows.
(1)The assimilation of satellite data can improvethe initial fields and the subsequent simulation of thetyphoon,but the relative improvement depends onthe exact combination of data assimilated. In thiscase,assimilating AMSU-A data improves the simulationmore than assimilating AMSU-B data or HIRSdata. Satellite data assimilation significantly affectsthe strength and location of the subtropical high,which in turn influences the steering of the typhoonby the environmental flow. Assimilation of AMSUAdata strengthens the subtropical high and shifts itwestward,enhancing the initial westward movementof the simulated typhoon and resulting in a simulatedtrack that is closer to the best track.
(2)Direct assimilation of satellite brightness temperaturehelps to improve the environmental conditions,but does not significantly improve the simulated intensity of the typhoon. Using the bogus techniquetogether with satellite data assimilation to initializethe typhoon simulation improves not only the environmentalconditions but also the structure of thetyphoon inner core. These changes yield a more accuratesimulation of both the track and intensity of thetyphoon.
(3)Assimilation of multifold data improves therepresentations of the wind and SLP fields both inside and outside of the typhoon,enhances the upper-levelwarm core within the typhoon,strengthens the subtropicalhigh, and extends the subtropical high towardthe west. The assimilation of satellite data contributesprimarily toward improving the environmental conditions, and does not significantly improve the structureof the typhoon inner core. The introduction of bogusdata primarily affects the structure of the typhooninner core,resulting in a more accurate representationof the initial vortex.
This study demonstrates that both the bogustechnique and satellite data assimilation can independentlyimprove numerical simulations of typhoons.However,in this case,the most accurate simulationsresult from applying the two techniques in t and em.The results in this paper are informative for ongoingefforts to numerically simulate and predict the evolutionof typhoons.
Acknowledgments. The authors gratefully acknowledgeDr. Zhao Juan for constructive Comments and careful examination of the manuscript. The languageeditor for this manuscript is Dr. Jonathon S.Wright.
| Chen, H., and W. Y. Pan, 2010: Targeting studies for the extratropical transition of Hurricane Fabian: Signal propagation, the interaction between Fabian and midlatitude flow, and observation strategy. Mon. Wea. Rev., 138, 3224-3242. |
| Cheng Rui, Yu Rucong, Xu Youping, et al., 2011: Impact of cloud microphysical processes on the simulation of Typhoon Rananim near shore. Part II: Typhoon intensity and track. Acta Meteor. Sinica, 25(4), 456-466. |
| Chou, M. D., and M. J. Suarez, 1999: A Solar Radiation Parameterization for Atmospheric Studies. NASA Tech. Rep. NASA/TM-1999-10460, 15, 38 pp. |
| Eyre, J. R., and H. M. Woolf, 1988: Transmittance of atmospheric gases in the microwave region: a fast model. Applied Optics, 27, 3244-3249. |
| Hong, S. Y., Y. Noh, and J. Dudhia, 2006: A new vertical diffusion package with an explicit treatment of entrainment processes. Mon. Wea. Rev., 134(9), 2318-2341. |
| Iwasaki, T., H. Nakano, and H. Sugi, 1987: The performance of a typhoon track prediction model with cumulus parameterization. J. Meteor. Soc. Japan, 65, 555-570. |
| Kain, J. S., 2004: The Kain-Fritsch convective parameterization: An update. J. Appl. Meteor., 43(1), 170-181. |
| Kurihara, Y., M. A. Bender, and R. J. Ross, 1993: An initialization scheme of hurricane models by vortex specification. Mon. Wea. Rev., 121(7), 2030-2045. |
| Kurihara, Y., M. A. Bender, R. E. Tuleya, et al., 1995: Improvements in the GFDL hurricane prediction system. Mon. Wea. Rev., 123(9), 2791-2801. |
| Le Marshall, J. F., L. M. Leslie, R. F. Jr. Abbey, et al., 2002: Tropical cyclone track and intensity prediction: The generation and assimilation of highdensity, satellite-derived data. Meteor. Atmos. Phys., 80(14), 43-57. |
| Mathur, M. B., 1991: The National Meteorological Center’s quasi-Lagrangian model for hurricane prediction. Mon. Wea. Rev., 119(6), 1419-1447. |
| Pu, Z. X., and S. A. Braun, 2001: Evaluation of bogus vortex techniques with four-dimensional variational data assimilation. Mon. Wea. Rev., 129(8), 2023-2039. |
| Wang Guomin, Wang Shiwen, and Li Jianjun, 1996: A bogus typhoon scheme and its application to a movable nested mesh model. Adv. Atmos. Sci., 13(1), 103-114. |
| Wang, Y. F., B. Wang, G. Ma, et al., 2003: Effects of 4DVAR with multifold observed data on the typhoon track forecast. Chinese Sci. Bull., 48(S2), 93-98. |
| Wang, Y. F., Zhang Haiyang,Wang Bin, et al., 2009: An improved initialization method of typhoon and its 4DVAR experiments. Sci. Meteor. Sinica, 29(1), 18. (in Chinese) |
| Wang, Y. F., H. Y. Zhang, B. Wang, et al., 2010: Reconstruct the mesoscale information of typhoon with BDA method combined with AMSU-A data assimilation method. Adv. Meteor., Article ID 346516, 11 pages, doi: 10.1155/2010/346516. |
| Xiao, Q. N., X. E. Zou, and B. Wang, 2000: Initialization and simulation of a landfalling hurricane using a variational bogus data assimilation scheme. Mon. Wea. Rev., 128(1), 2252-2269. |
| Xiao, Q. N., L. Q. Chen, and X. Y. Zhang, 2009: Evaluations of BDA scheme using the advanced research WRF (ARW) model. J. Appl. Meteor. Climatol., 48(3), 680-689. |
| Zapotocny, T. H., J. A. Jung, J. F. Le Marshall, et al., 2008: A two-season impact study of four satellite data types and rawinsonde data in the NCEP global data assimilation system. Wea. Forecasting, 23(1), 80-100. |
| Zhang, F. Q., Y. H. Weng, J. F. Gamache, et al., 2011: Performance of convection-permitting hurricane initialization and prediction during 2008-2010 with ensemble data assimilation of inner-core airborne Doppler radar observations. Geophys. Res. Lett., 38, L15810, doi: 10.1029/2011GL048469. |
| Zhang, F. Q, and D. D. Tao, 2013: Effects of vertical wind shear on the predictability of tropical cyclones. J. Atmos. Sci., 70(3), 975-983. |
| Zhang, H., J. S. Xue, G. F. Zhu, et al., 2004: Application of direct assimilation of ATOVS microwave radiances to typhoon track prediction. Adv. Atmos. Sci., 21(2), 283-290. |
| Zou, X. L., and Q. N. Xiao, 2000: Studies on the initialization and simulation of a mature hurricane using a variational bogus data assimilation scheme. J. Atmos. Sci., 57(6), 836-860. |
| Zou, X. L., and Q. N. Xiao, A. E. Lipton, et al., 2001: A numerical study of the effect of GOES sounder cloud-cleared brightness temperatures on the prediction of Hurricane Felix. J. Appl. Meteor., 40(1), 34-55. |