中国气象学会主办。
文章信息
- 岳治国, 余兴, 刘贵华, 王瑾, 戴进, 李金辉. 2021.
- YUE Zhiguo, YU Xing, LIU Guihua, WANG Jin, DAI Jin, LI Jinhui. 2021.
- 一次飞机冷云增雨作业效果检验
- Effect evaluation of an operational precipitation enhancement in cold clouds by aircraft
- 气象学报, 79(5): 853-863.
- Acta Meteorologica Sinica, 79(5): 853-863.
- http://dx.doi.org/10.11676/qxxb2021.051
文章历史
-
2021-03-12 收稿
2021-06-05 改回
2. 陕西省气象科学研究所,西安,710016;
3. 秦岭和黄土高原生态环境重点实验室,西安,710016
2. Meteorological Institute of Shaanxi Province,Xi'an 710016,China;
3. Key Laboratory of Eco-Environment and Meteorology for the Qinling Mountains and Loess Plateau,Xi'an 710016,China
随着人口增长、经济规模扩大及气候变化加剧,水资源短缺等问题日益严重,中国各级政府非常重视人工增雨工作,近年来发展迅速,作业规模和投入均居世界首位。中国飞机人工增雨作业对象主要为层状冷云,每年作业近千架次,但总体科学水平不高(洪延超等,2012;雷恒池等,2008;郭学良等,2019;段婧等,2017)。增雨效果始终是人工影响天气工作必须回答的问题,但一直没有得到很好解决。增雨效果检验常用方法有统计检验、物理检验(刘晴等,2013)、数值模拟检验(刘卫国等,2021;刘香娥等,2021)等。由于成云致雨过程的复杂性和地面降水的随机性,最常用的增雨效果统计检验大都没有定论(Haupt,et al,2018)。对一次人工增雨作业而言,科学地给出令人信服的效果检验结果更是没有好的解决方案。
自然云降水过程涉及巨大的能量交换,这意味着通过改变云系的质量或能量平衡来增强降水是不可行的,人工影响天气主要针对云降水微物理过程施加影响(毛节泰等,2006),冷云增雨是利用冰面饱和水汽压低于水面饱和水汽压、水汽在冰晶上快速凝华增长的特点,在云中过冷云水区播撒催化剂(AgI或致冷剂)产生冰晶,经一系列冰相增长过程和繁生机制,形成降水粒子,降落到地面达到增加降水的目的。因此,有效果的冷云增雨作业,在播撒区会形成冰晶等大粒子,如果出现在云顶就会被气象卫星观测到,雷达也应能发现由于催化形成的大粒子而增强的回波。
French等(2018)和Tessendorf等(2019)使用地面雷达、机载云雷达和云物理探测等设备,开展冬季地形云人工增雪观测试验,取得了许多新进展,发现了三次从播撒人工冰核到核化、冰晶生长再降到地面的完整微物理过程链。针对这三次增雪试验,Friedrich等(2020)从自然降水回波中分离出了人工增雪催化产生的回波,使用等效雷达回波反射率因子和降雪量的关系(Ze-S)定量估算增雪量,分析人工增雪量的时、空演变。
早在1963年,河北省气象局(1973)对层状冷云实施干冰催化后,在雷达PPI回波上就发现了与飞机航迹平行的条状雷达回波,猜测与飞机催化有关。2000年3月14日业务增雨飞机在陕西省境内实施AgI播云后,NOAA-14/AVHRR卫星观测到一条出现在云顶的清晰折线云迹(飞机催化航迹上云顶塌陷,航迹内云顶温度高于周边云顶温度,也称“云沟”),形状与飞机播云航线相似。通过卫星云微物理特征反演、催化剂输送扩散模拟等多方面对比分析,证实云迹是播云物理效应在云顶的直观反映(Rosenfeld,et al,2005;Yu,et al,2005;戴进等,2006;余兴等,2005),这是首次在卫星云图上观测到冷云催化的物理响应。近年来,中国也发现AgI催化使过冷水滴数浓度降低、冰晶尺度增大和数浓度升高,卫星云图显示其云顶塌陷和云顶温度升高(Dong,et al,2020)。遗憾的是,这些产生明显云物理响应的增雨个例都没有连续观测的数字化雷达数据,无法追踪催化云体的时、空演变,未能定量估算地面增雨量。
2017年3月19日陕西省飞机冷云增雨作业后,在FY-3C卫星云图上再次出现了催化“云沟”,气象雷达也完整记录了催化云系的演变(Wang,et al,2021)。针对此次增雨过程,本研究给出了一种基于物理检验的增雨定量估算新方法,即分离人工增雨产生的边界清晰的降雨区域和识别自然降水量,使用激光雨滴谱仪和雷达数据定量估算一次飞机作业的增雨量。
2 飞机增雨个例、资料和方法 2.1 飞机增雨2017年3月19日业务增雨飞机燃烧AgI焰剂对陕西关中盆地西部的层状冷云实施催化作业,02时41分—03时14分(世界时,下同)在海拔3200—3975 m高度实施催化,播撒线总长125 km (图1蓝线),共播撒AgI 750 g,平均播撒率为0.368 g/s。19日00时泾河站探空数据显示3950 m高度层温度为−10.3℃,风速9 m/s、西南风(图1b)。

|
| 图 1 2017年3月19日陕西增雨飞机航迹 (a)、播撒路线高度 (b) (增雨飞机在绿色AB段起飞爬升,蓝色BC段 (02时41分—03时14分) 播撒AgI,紫色CA段返航;(b) 中蓝色风标表示播撒高度3950 m层风向和风速,1个长风向杆代表4 m/s) Fig. 1 Flight track (a) and seeding route (b) of the operational precipitation enhancement by aircraft on 19 March 2017 in Shaanxi province (The aircraft took off and climbed from A to B (green),seeded AgI from B to C (blue,02:41—03:14 UTC) and returned from C to A (purple);the blue wind barb in (b) indicates the wind direction and wind speed at 3950 m height (a full wind barb represents 4 m/s)) |
西安泾河C波段业务多普勒天气雷达位于(34.43°N,108.97°E)(图1),海拔高度459 m,6 min完成一次体扫,最大探测距离为400 km,径向分辨率为500 m,最低扫描仰角为0.5°。雷达体扫反射率经孤立点剔除、噪声消除等质量控制后,插值得到水平格距为500 m、垂直格距为200 m的格点数据。
飞机增雨作业后,雷达回波增强区域(增雨影响回波)与自然云降水回波一起持续向东北方向移动,移速8.55 m/s。增雨作业影响回波经过的最高地形海拔为1800 m,为了减少地物回波的干扰,且考虑到越接近地面的雷达回波强度与地面降雨量(Z-I关系)相关关系越好,故采用海拔1800 m等高度面雷达数据(CAPPI),建立Z-I拟合关系,计算地面增雨量。
2.3 雨滴谱资料西安泾河雷达站距离淳化和铜川站的直线距离分别为57和69 km,淳化距离铜川站54 km(图1)。淳化和铜川气象站分别布设了1部OTT-Parsivel型激光雨滴谱仪,采样频率为60 s。3月19日00—08时,淳化和铜川气象站出现间歇性小雨,激光雨滴谱仪连续记录了降雨发生时间和雨滴大小。
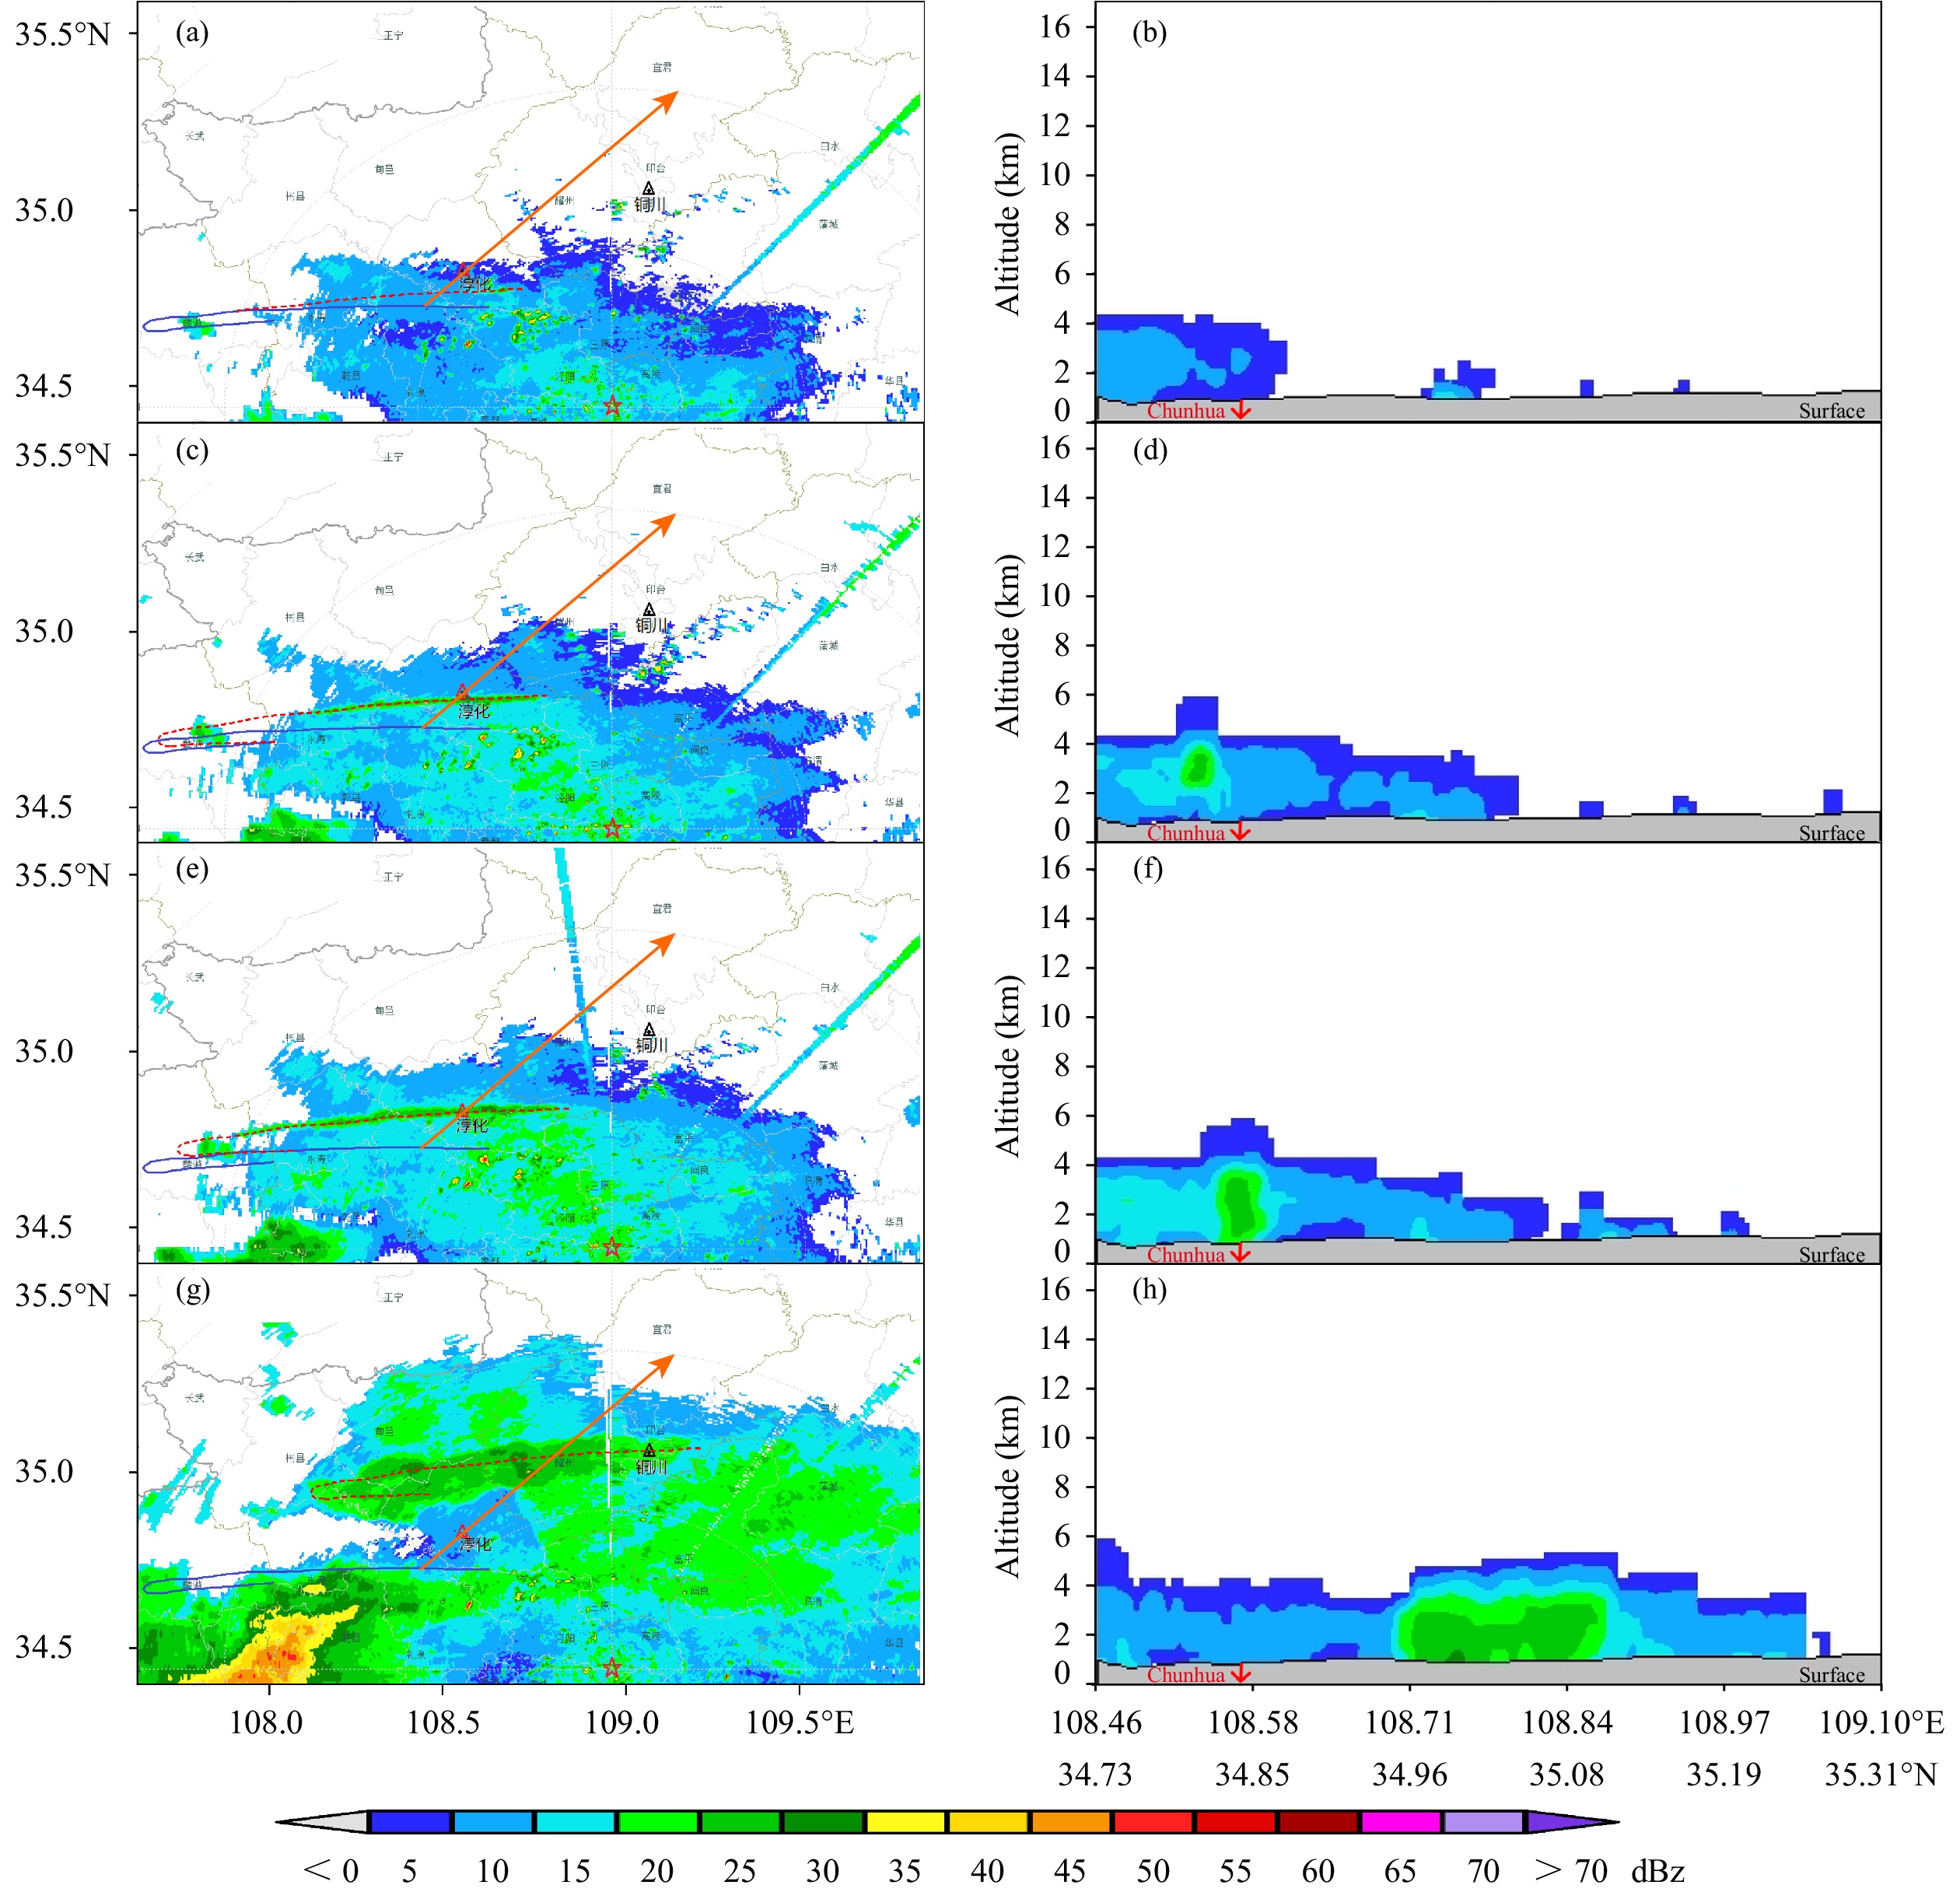
3 增雨物理响应 3.1 雷达回波演变增雨飞机在02时41分(图1的B点)开始播撒AgI,18 min后(02时59分)的雷达组合反射率图上已观测到与移动后播云航线位置一致的增雨影响回波(长13.4 km、10—15 dBz,图2a)。随后,增雨影响回波在移动过程中变长增宽(图2c、e、g)。沿着回波移动方向、经过淳化站的回波强度剖面(图2b、d、f、h)显示,增雨影响回波最初在飞机播撒高度出现,逐渐向下发展到达地面。04时47分,大于15 dBz的增雨影响回波宽度超过15 km(图2g)。增雨影响回波向东北方向移动100 km后,在06时35分后逐渐减弱消散。02时36分—07时14分每6 min间隔的雷达组合反射率和垂直剖面动画可详见Wang等(2021)。
|
| 图 2 泾河雷达组合反射率回波和回波强度垂直剖面的时间演变 (蓝色实线为飞机播撒AgI轨迹,红色点虚线为播撒AgI轨迹当前时刻位置,b、d、f、h分别为a (02时59分)、c (03时16 分)、e (03时27分)、g (04时47分) 中沿着红色实线箭头位置的剖面回波,红五星为泾河雷达站位置,红色三角为淳化站位置、黑色三角为铜川站位置,见Wang,et al,2021) Fig. 2 Temporal evolution of composite radar reflectivity and cross sections of echo at Jinghe radar station (The blue solid line in panels a,c,e and g shows the seeding track,and the red dotted line is the seeding track at time of 02:59 UTC,03:16 UTC,03:27 UTC and 04:47 UTC. The panels b,d,f and h are the cross sections of radar echo along the red solid arrow in each panel. The red five-star is the location of Jinghe radar station,the red triangle is the location of Chunhua station,and the black triangle is the location of Tongchuan station (Wang,et al,2021)) |
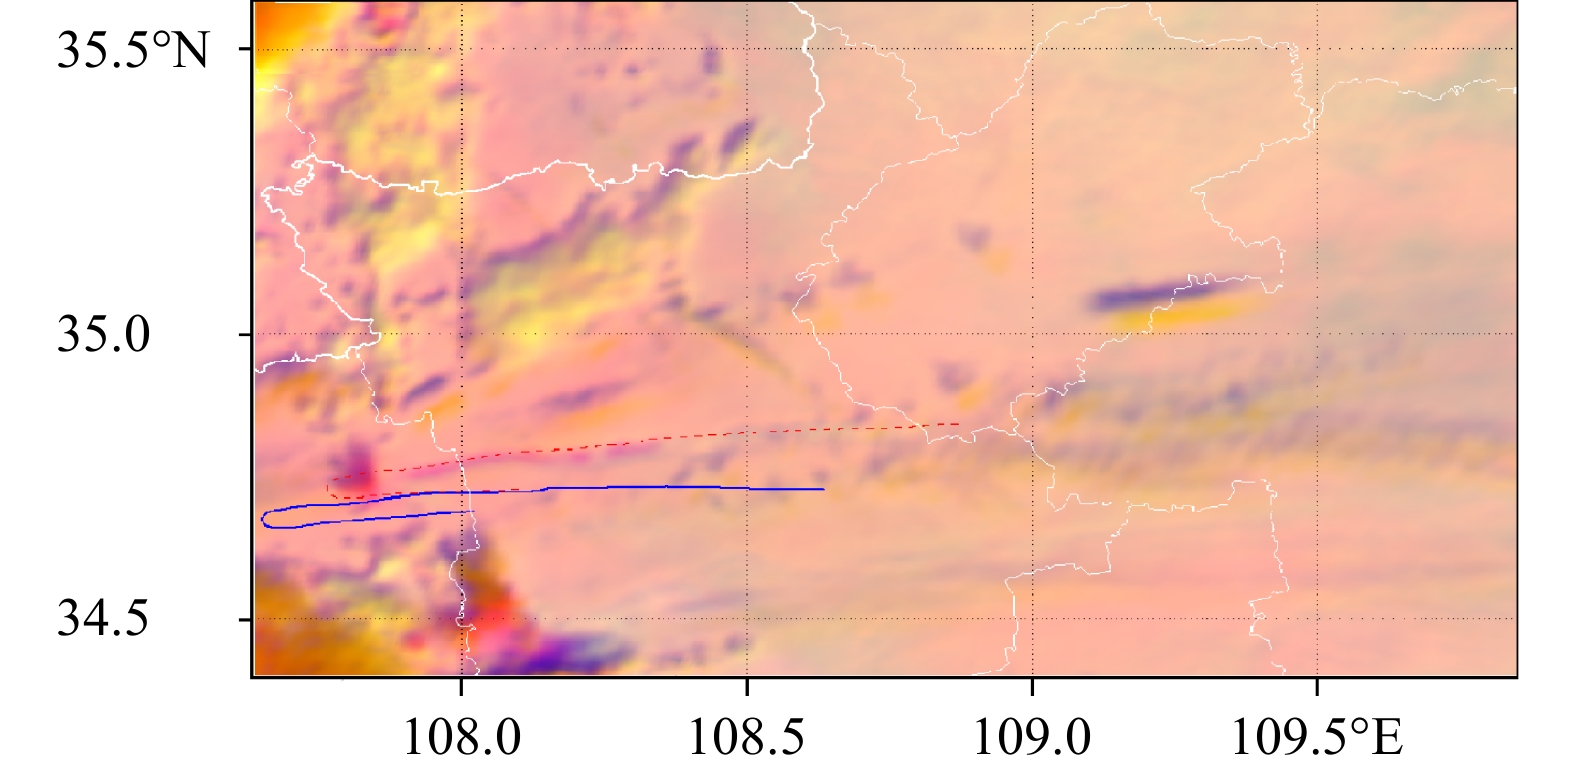
飞机增雨作业结束后,在03时30分的FY-3C/VIRR卫星多光谱彩色合成图上,催化航迹的北部红色虚线位置观测到催化产生的“云沟”(图3),这与图2e中雷达组合反射率强度(03时27分)上发现增雨作业增强了雷达回波强度(红色虚线位置)位置一致(Wang,et al,2021)。
|
| 图 3 2017年3月19日03时30分FY-3C/VIRR卫星云微物理彩色图上的“云沟” (RGB合成时红色R为0.6 μm通道可见光反射率,绿色G为1.6 μm通道可见光反射率,蓝色B为10.8 μm通道亮温温度;蓝色实线和红色点虚线同图2;Wang,et al,2021) Fig. 3 Sinked cloud top on the RGB composite image of FY-3C/VIRR satellite at 03:30 UTC 19 March 2017 (R,G and B are 0.6 μm (red) and 1.6 μm (green) reflectance and 11 μm brightness temperature (blue);the blue solid line and the red dotted line are the same as in Fig. 2 (Wang,et al,2021)) |
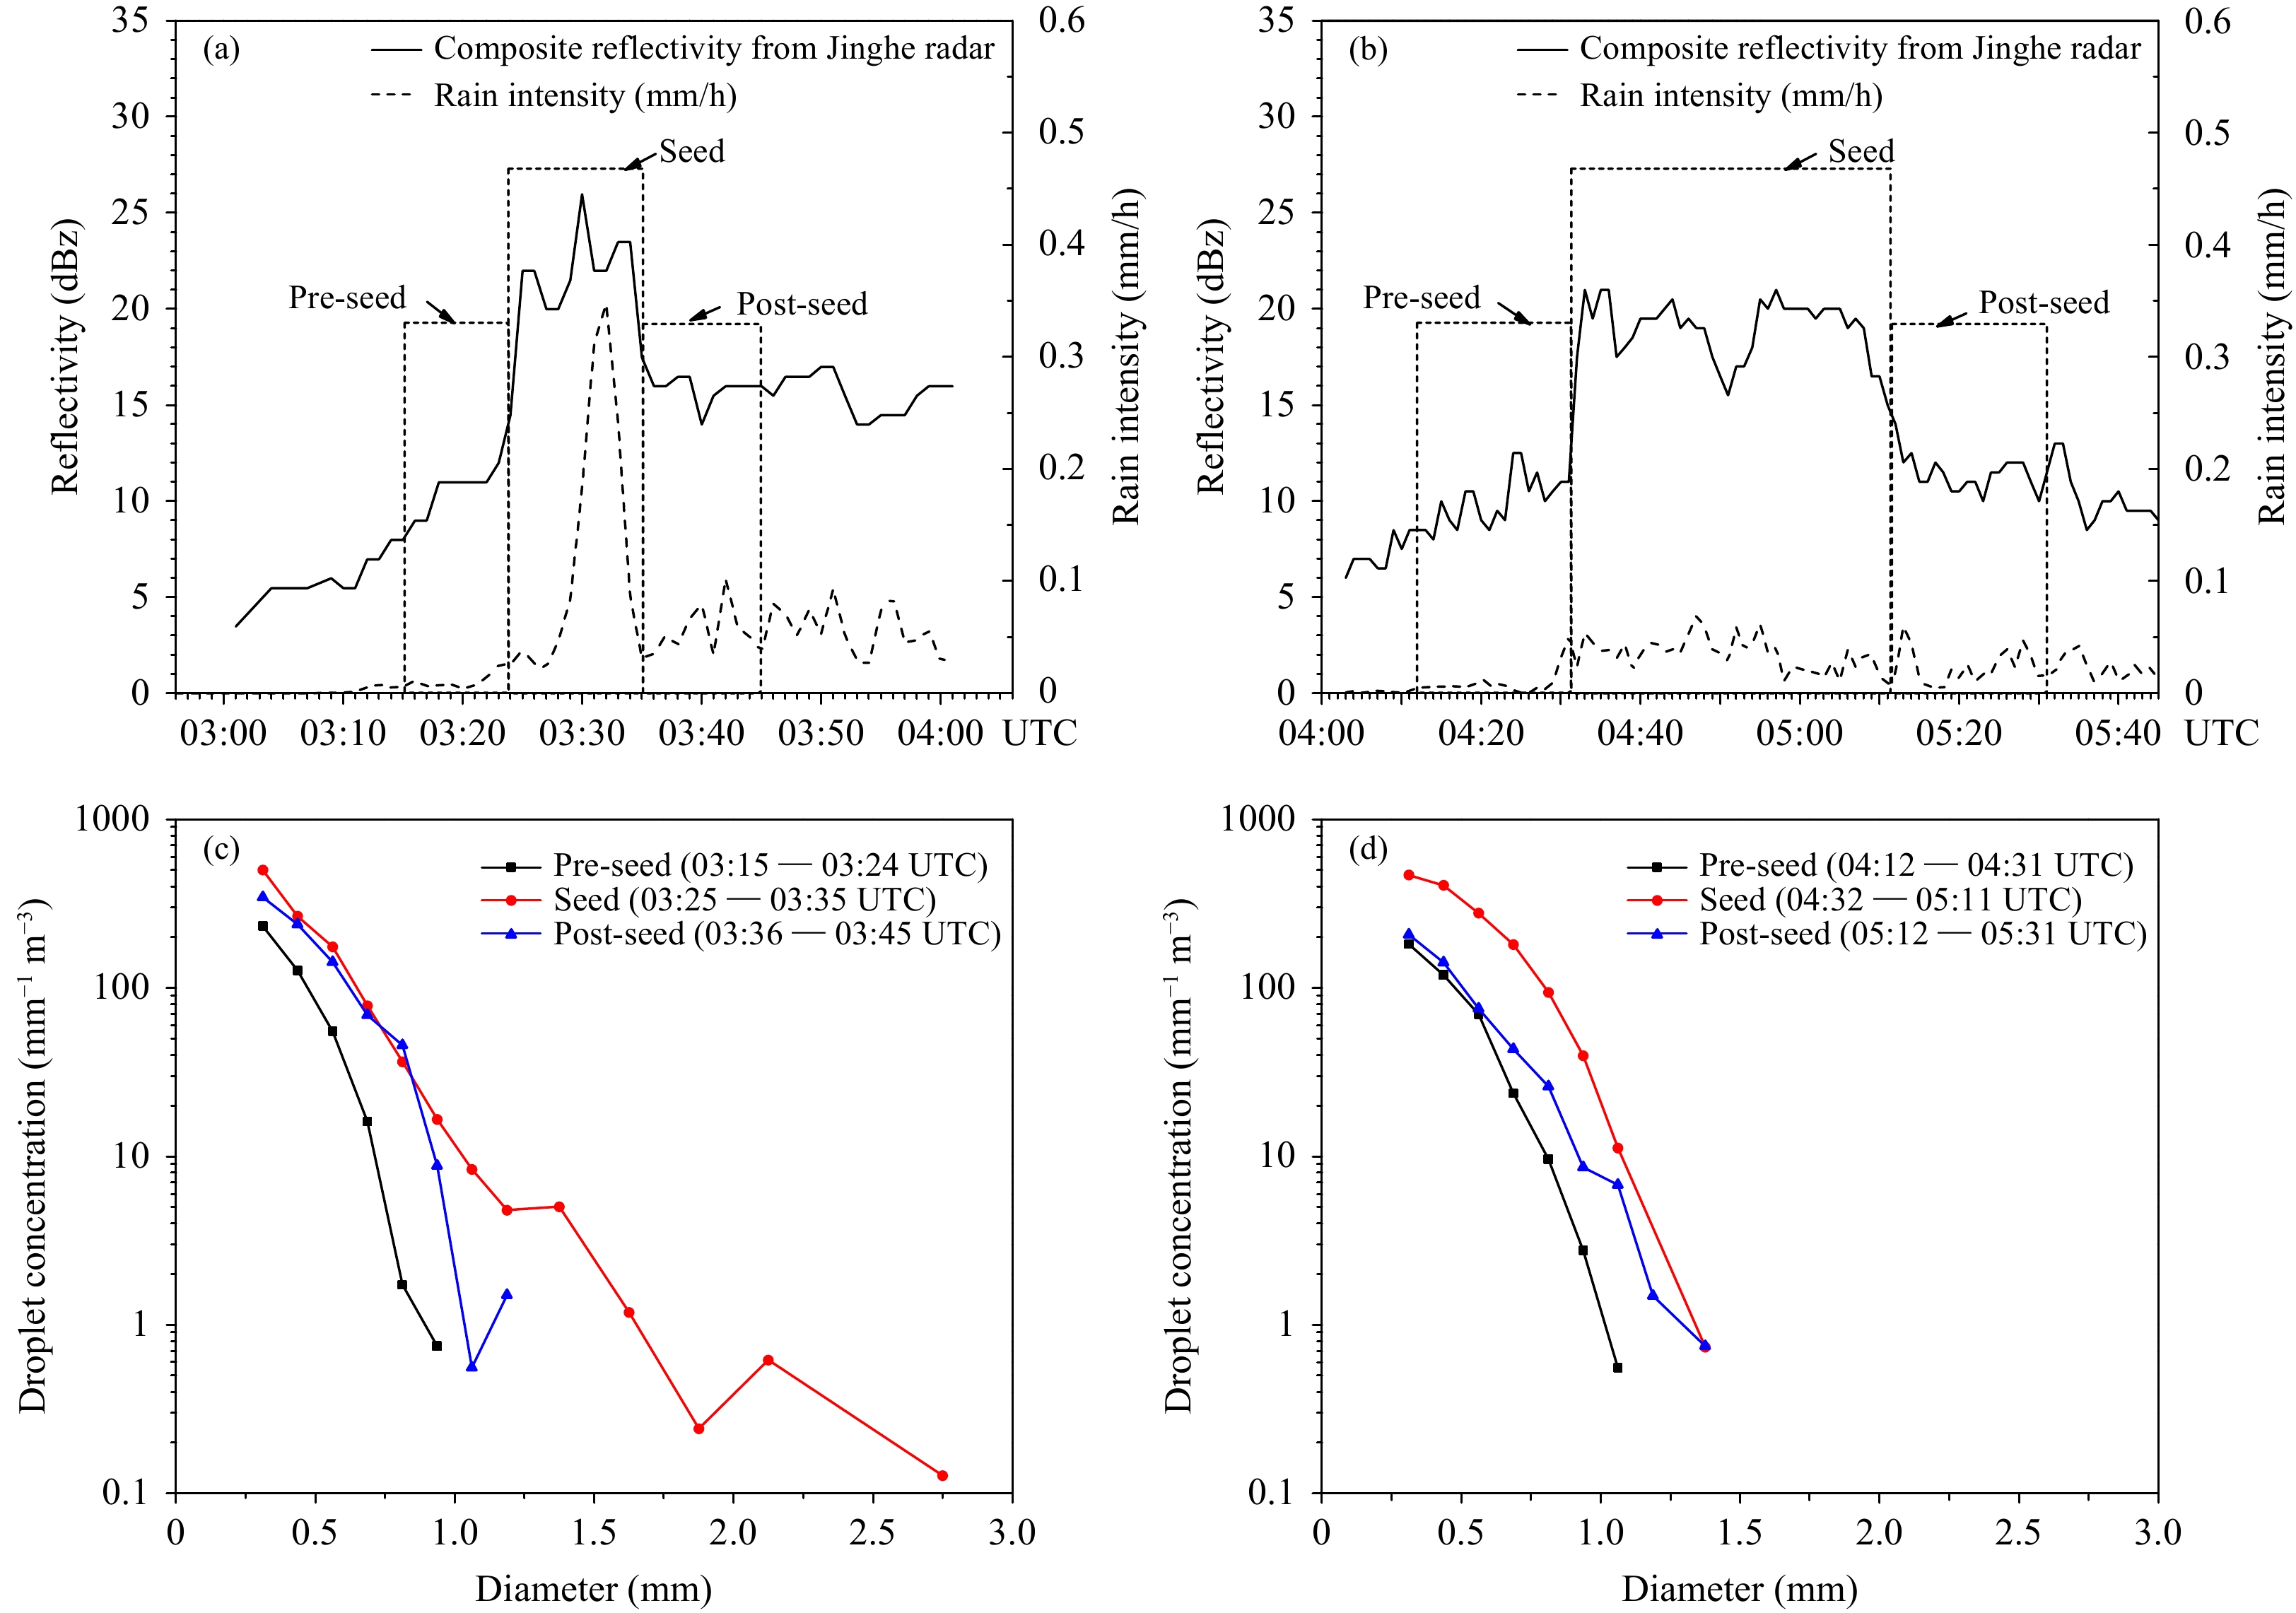
在雷达组合反射率图上,根据回波强度大于15 dBz的增雨影响回波经过测站的时间,可确定增雨影响回波经过淳化和铜川站的时间分别为03时25—35分和04时32分—05时11分,过测站时的回波强度比经过前和经过后增强10 dBz左右(图4a、b)(Wang,et al,2021)。03时30分,淳化站的组合反射率达到最大值26 dBz。由于高空的增强回波降落到地面存在时间差,2 min后(03时32分)淳化激光雨滴谱仪数据计算的地面雨强达到了0.35 mm/h的峰值(图4a)。增雨影响回波经过测站时,淳化站雨滴数浓度和雨滴直径增大明显(图4c)。由于云中过冷水经过100多分钟消耗,尽管增雨影响回波使铜川站地面雨滴数浓度出现升高,但雨滴直径变化不明显(图4d)。
|
| 图 4 雷达组合反射率回波强度 (a和b黑实线)、雨滴谱数据计算的雨强 (a和b黑虚线) 和雨滴谱演变 (a、c. 淳化,b、d. 铜川;增雨前、增雨、增雨后的时间段根据回波强度大于15 dBz的增雨影响回波经过测站的时间确定;Wang,et al,2021) Fig. 4 Evolution of composite reflectivity from Jinghe radar,rain intensity calculated by raindrop spectrum data and raindrop spectrum (a,c. Chunhua,b,d. Tongchuan;the time ranges of pre-seed,seed and post-seed are determined according to the time of echo affected by precipitation enhancement passing through the station with echo greater than 15 dBz (Wang,et al,2021)) |
由以上分析可见,雷达回波增强带、增雨影响回波在垂直方向的演变、卫星云图“云沟”位置和地面雨滴谱数据变化都与飞机催化航迹相对应。多种数据如此一致地观测到催化云体的物理响应,不可能是层状云自然变率造成的,可以确认这是过冷层云对飞机播撒AgI的物理响应(Wang,et al,2021)。
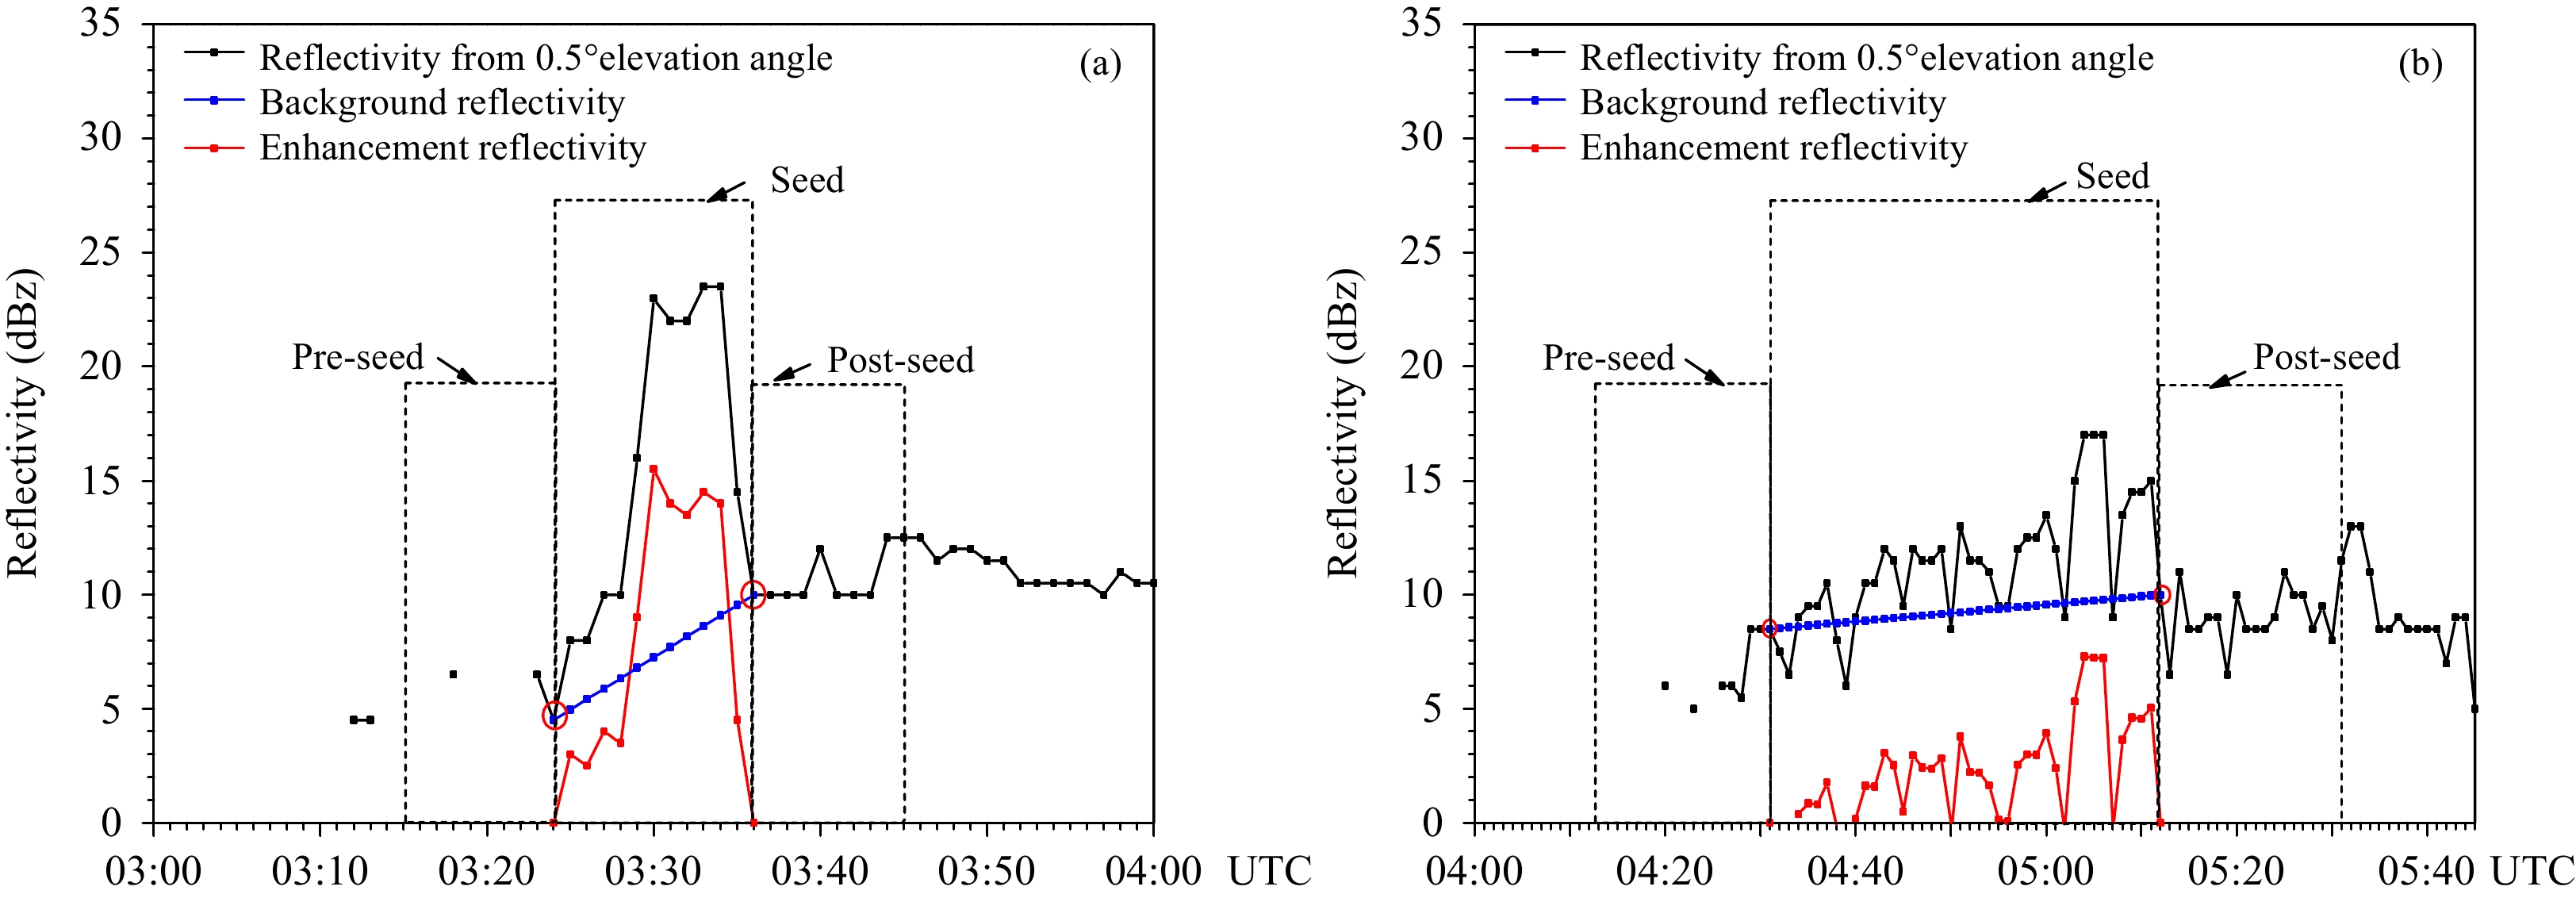
4 分离增雨影响回波和背景回波 4.1 单站增雨影响回波由于增雨影响回波是人工催化效应增强的回波(增雨回波)和背景回波(自然降水回波)的综合体现,从增雨影响回波中得到增雨回波是人工增雨效果检验的关键环节。将0.5°仰角上增雨影响回波经过测站前后时刻的回波强度近似作为自然降水回波的起止(图5红色圈),然后线性插值得到对应的自然降水回波强度(图5蓝线,增雨影响回波之外都为自然回波)。增雨影响后回波强度减去自然降水回波强度,就可近似得到增雨回波强度(图5红线)。
|
| 图 5 0.5°仰角增雨影响回波 (黑线)、自然降水回波 (蓝线) 和增雨回波 (红线) 强度的演变 (a. 淳化,b. 铜川;增雨前、增雨、增雨后的时段同图4) Fig. 5 Evolution of reflectivity at 0.5° elevation angle (black),background reflectivity (blue) and enhancement reflectivity (red)(a. Chunhua,b. Tongchuan;the time ranges of pre-seed,seed and post-seed are the same as shown in Fig. 4) |
为了得到地面增雨的区域分布,必须从连片雷达回波中分离出增雨影响回波。从02时41分开始,飞机在3950 m高度附近播撒增雨催化剂(AgI),29 min后(03时10分)在1800 m等高面上出现了增强的条状雷达回波(增雨影响回波),一直持续到268 min后(07时09分)消失,增雨影响时间为03时10分—07时09分,约为4 h (图6)。

|
| 图 6 泾河雷达1800 m等高面回波强度 (a、c、e、g) 和增雨影响回波 (b、d、f、h)(a和 b为03时10分初始出现增雨影响回波,c和 d为03时27分增雨影响回波经过淳化气象站,e 和 f 为04时47 分增雨影响回波经过铜川气象站,g和 h为07时09分增雨影响回波最后时刻;其他同图2) Fig. 6 Radar echoes (a,c,e,g) and enhancement precipitation echoes (b,d,f,h) of Jinghe radar CAPPI at 1800 m altitude (a and b are the initial enhancement precipitation echoes at 03:10 UTC,c and d are the echoes at 03:27 UTC when they passed Chunhua station,e and f are the echoes at 04:47 UTC when they passed Tongchuan station,g and h are the end time of echoes at 07:09 UTC;others are the same as that in Fig. 2) |
分析1800 m高度回波CAPPI (图6a、c、e、g)可知,虽然背景回波与条状增强带连成一片,但界限非常清晰。通过跟踪飞机播云航迹随时间的移动,识别出增雨影响回波,即与航迹对应的边界清晰的条状回波增强带,其面积为增雨雷达回波面积(图6b、d、f、h),与确定单站增雨方法类似,将紧邻的未受影响的雷达回波强度近似平均作为背景回波,例如从图6a、c、e、g可确定背景回波强度分别为10、12、15、10 dBz。同理,可逐时次(每6 min)分离整个时段的增雨影响回波和得到背景回波强度。
5 建立Z-I拟合关系为了更加准确地用雷达回波计算雨量,采用这次增雨作业雷达和雨滴谱观测资料,建立雷达反射率因子和降雨强度(Z-I)的拟合关系。
用雨滴谱计算降雨强度(I)的公式为
| $ I = \frac{{{\text π} \times {{10}^{ - 9}} \times {{10}^3} \times 3600}}{6}\sum\limits_{i = 1}^{32} {D_i^3} {v_i}N\left({{D_i}} \right)$ | (1) |
式中,Di为第i档的雨滴直径(单位:mm),vi为第i直径档雨滴下落速度(单位:m/s),N(Di)为第i个直径档雨滴数浓度,I单位为mm/h。N(Di)为
| $ N\left({{D_i}} \right)= \sum\limits_{{{j}} = 1}^{32} {{N_{ij}}} $ | (2) |
| $ {N}_{ij}=\frac{{n}_{ij}}{18\times 3\times {10}^{-4}\times {v}_{j}\times 60} $ | (3) |
式中,Nij为雨滴谱第i个直径档、第j个速度档的雨滴数浓度,nij为60 s内第i个直径档、第j个速度档的雨滴个数(单位:个/m3),vj为第j个速度档雨滴下落速度(单位:m/s)。
雷达反射率因子(Z)的计算公式为
| $ Z = \sum\limits_{{{i}} = 1}^{32} N \left({{D_i}} \right)D_i^6$ | (4) |
式中,Z的单位为mm6/m3。
结合式(1)和式(4),得到Z-I拟合关系式为
| $ I=a{Z}^{b} $ | (5) |
式中,a、b分别为拟合系数。
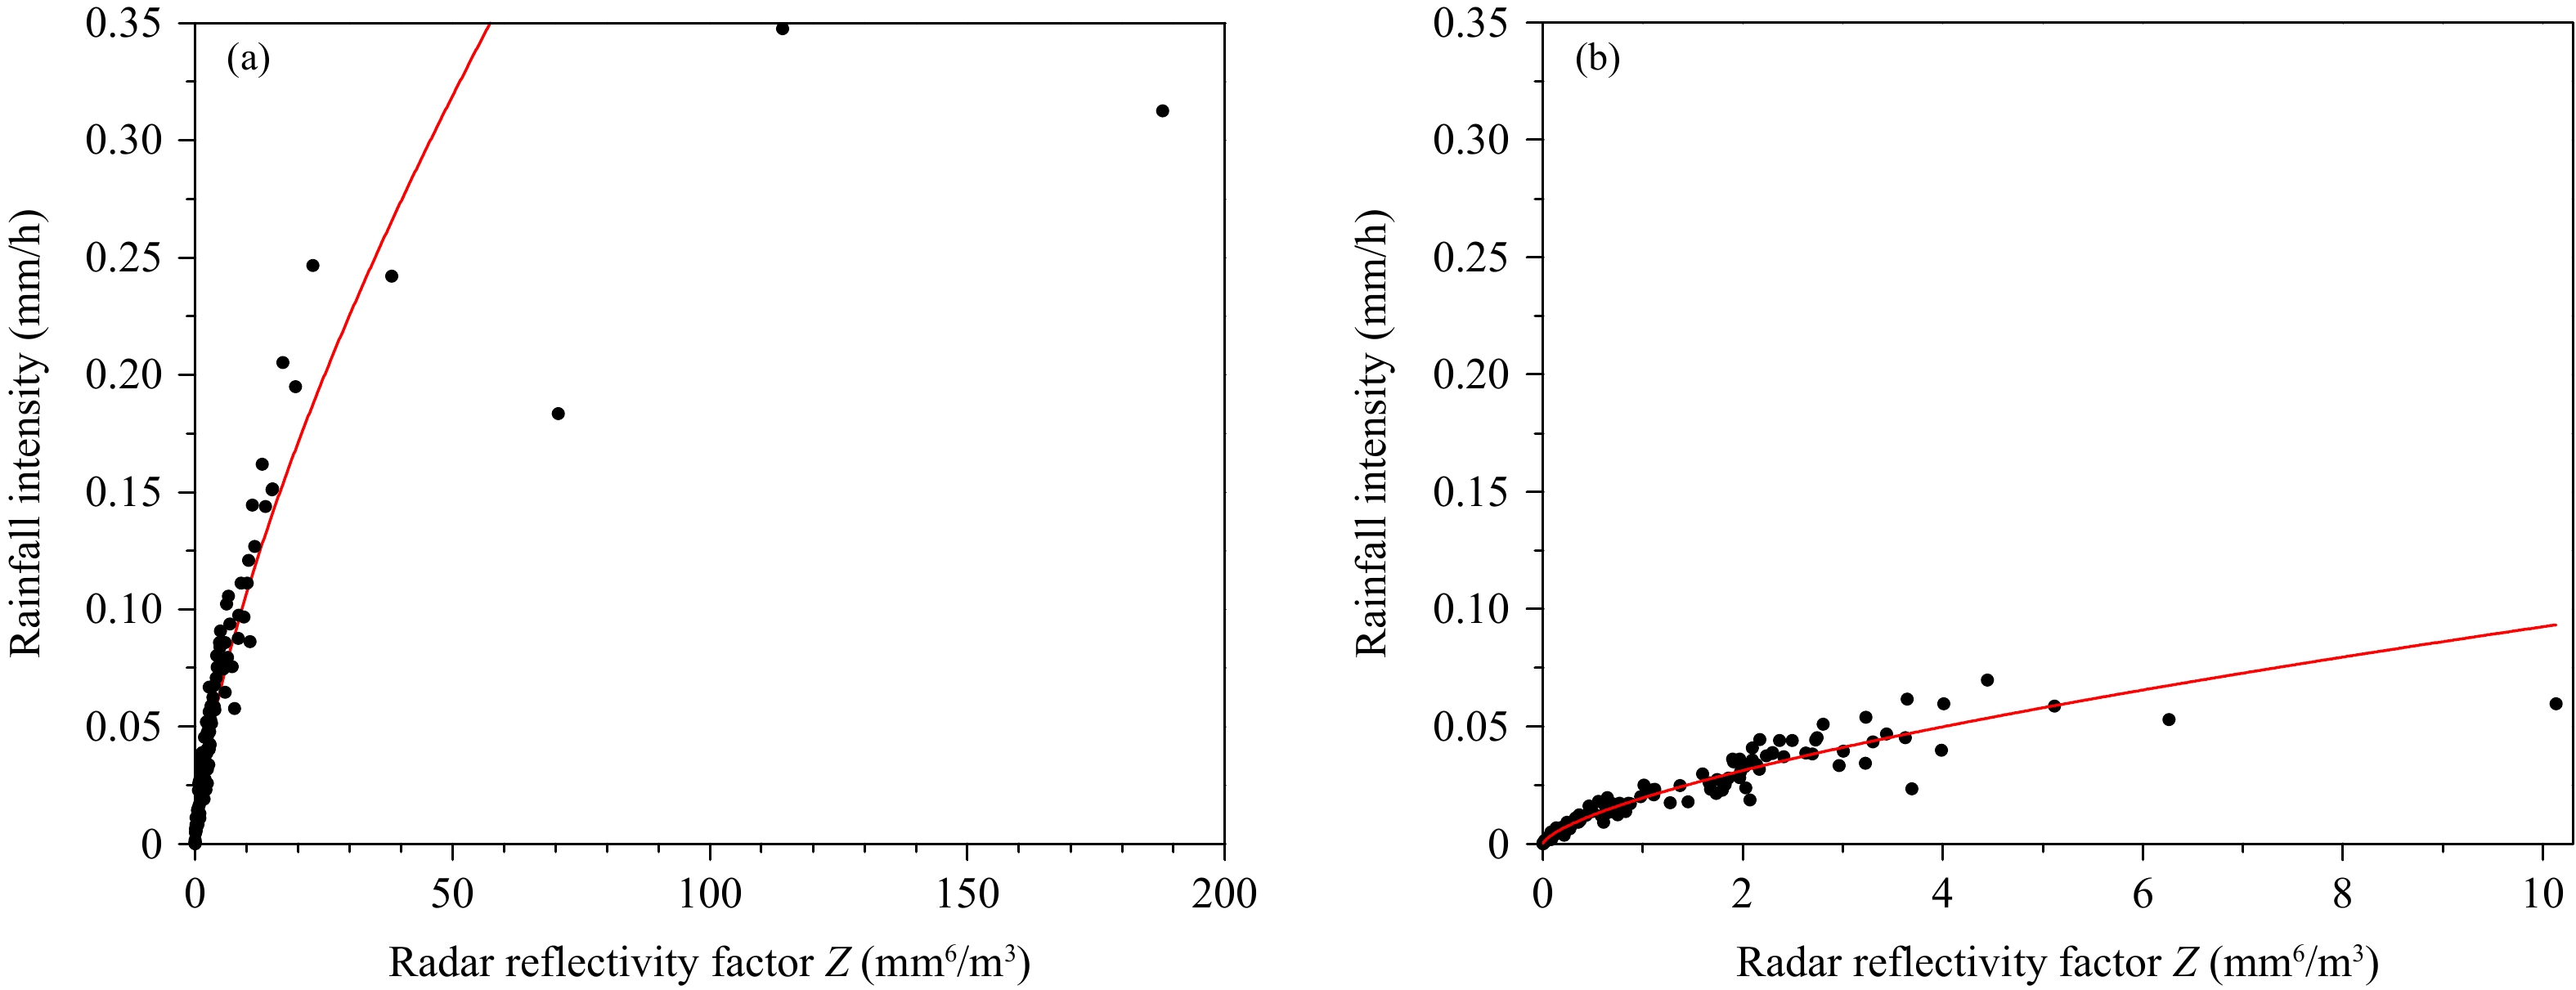
通过对增雨雷达回波和背景回波演变分析发现,02时53分—05时降水云系经过淳化站,取得雨滴谱样本共118份。03时21分—06时降水云系经过铜川站,取得雨滴谱样本共126份。分别使用淳化和铜川站的雨滴谱资料,计算得到两组Z和I(图7),建立两个Z-I拟合关系式(图7红线)分别为
|
| 图 7 淳化 (a) 和铜川 (b) 气象站雨滴谱计算雷达反射率因子 (Z) 和降雨强度 (I) 的散点分布 (a和b中红色曲线分别为用式(6) 和 (7) 拟合结果) Fig. 7 Scatter plots of rainfall intensity I and radar reflectivity factor Z calculated by raindrop spectrum at Chunhua (a) and Tongchuan (b) station (The red curves in (a) and (b) are the fitting results using Eqs.(6) and (7),respectively) |
| $ {I}_{1}=0.022336{Z}^{0.67976} $ | (6) |
| $ {I}_{2}=0.019612{Z}^{0.67388} $ | (7) |
式中,I1为淳化站Z-I关系式,相关系数为0.87;I2为铜川站Z-I关系式,相关系数为0.94。
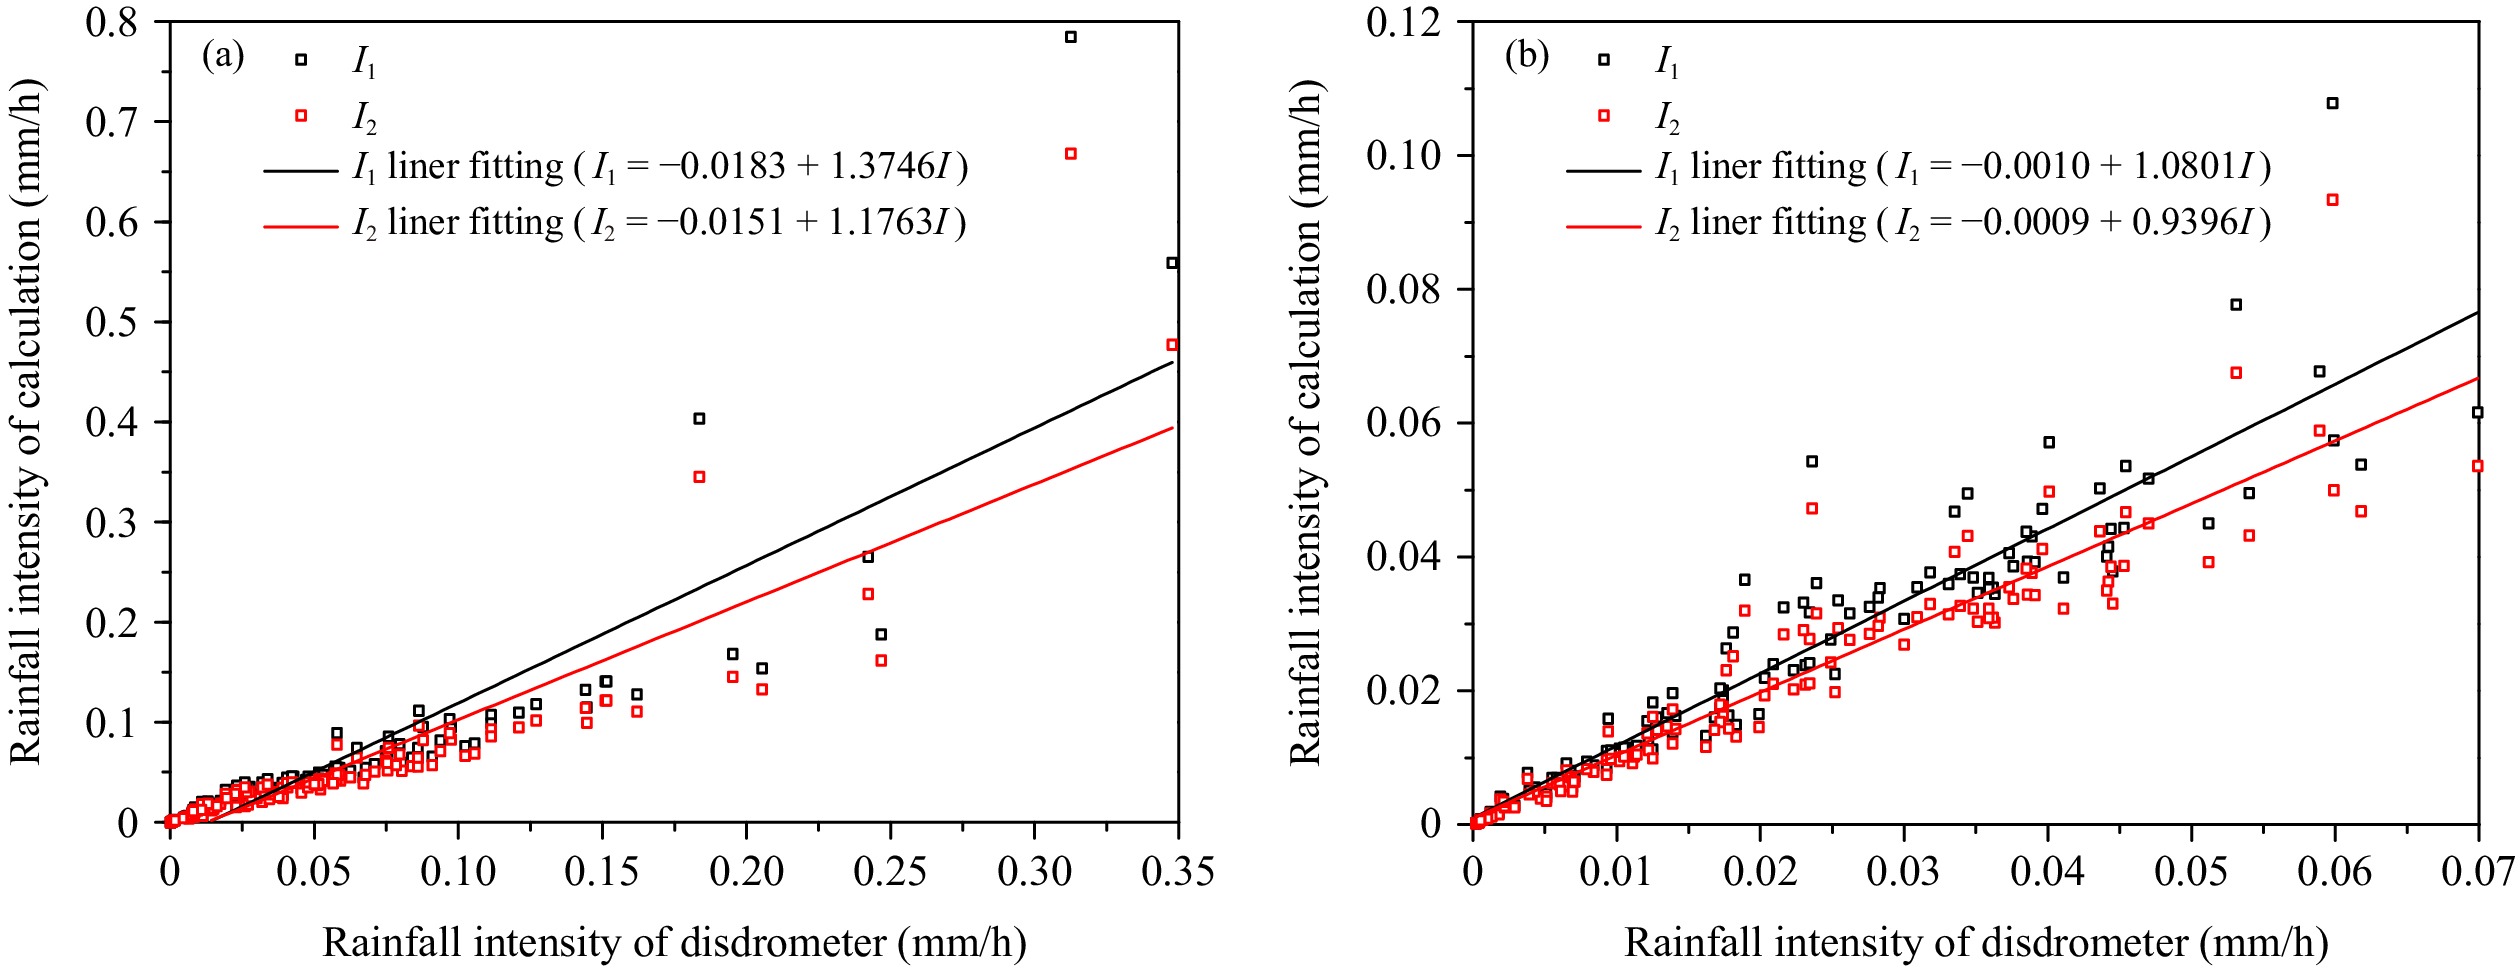
6 增雨量的时、空分布和增雨总量首先比较两个拟合关系式对增雨量计算的代表性。用雨滴谱计算的I作为实测值,分析淳化站(02时53分—05时)、铜川站(03时21分—06时)测量值(I)与用式(6)和(7)估算雨强I1、I2的散点分布(图8)可知,式(6)结果总体大于测量值。这是由于淳化站处在增雨影响回波的初期,云体过冷水含量充沛,催化效应产生了较多的大雨滴落到地面,导致拟合公式偏向较大雨强。
|
| 图 8 淳化 (a) 和铜川站 (b) 实测雨强 (I) 和计算雨强 (I1、I2) 的散点分布 Fig. 8 Scatter plots of measured rainfall intensity (I) and calculated rainfall intensity (I1 and I2) at Chunhua (a) and Tongchuan (b) stations |
增雨回波对应的地面雨量是本研究关注的重点。通过进一步分析可知增雨雷达回波经过淳化站(03时25—35分)时式(6)和(7)估算雨量的平均相对误差为46%和41%,经过铜川站(04时32分—05时11分)时估算雨量平均相对误差都为16%(表略),拟合关系式(7)计算结果总体上更接近实测值,故文中采用拟合关系式(7)计算降雨量。
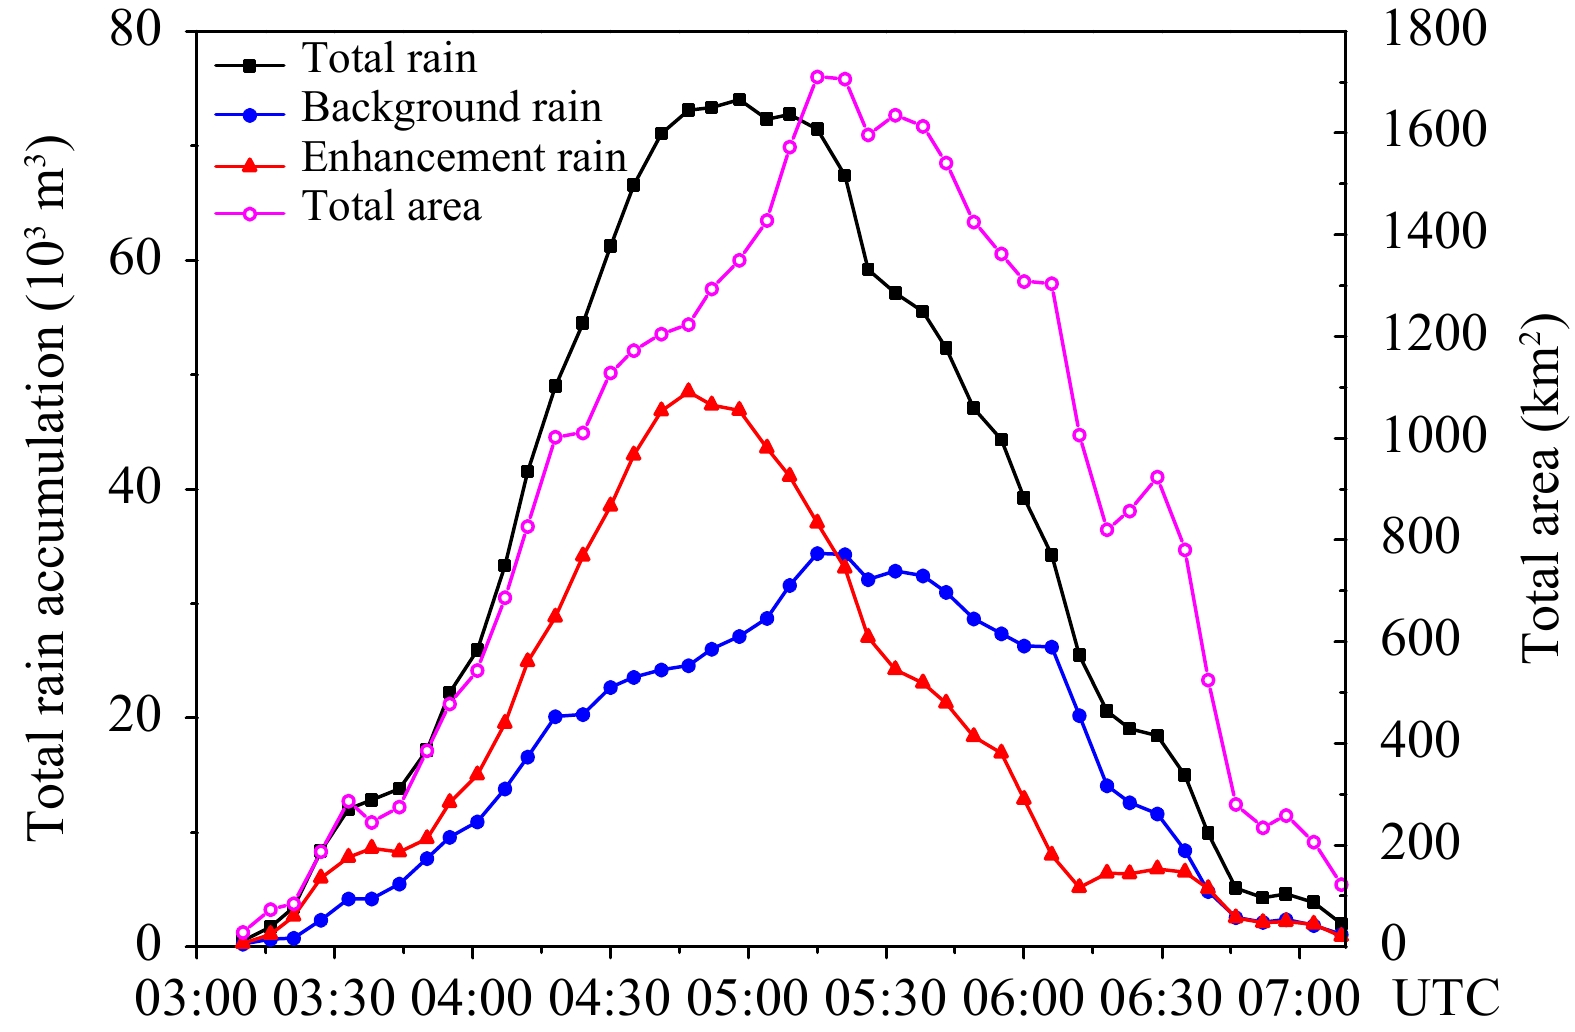
首先,对增雨影响回波强度和背景回波强度分别应用关系式(7),得到单个时次增雨影响区每个位置的总降水雨强和自然降水雨强,再计算增雨影响区内6 min总的降水量和自然降水量,总降水量减去自然降水量为增雨量。然后,在增雨影响时段(03时10分—07时09分),逐次重复上述过程,得到每个时次的总降雨量、自然降雨量和增雨量(图9)。分析图9可知,总降雨量、增雨量、增雨影响回波面积、自然降雨量随时间先增后减。总降雨量峰值与增雨量峰值同步,早于自然降雨峰值,说明增雨作业改变了降雨随时间的变化,降雨极值出现时间提前,促进降雨发生。增雨量在催化后146 min (04时47分)达最大4.9×10⁴ m3。增雨影响回波面积在催化后174 min (05时15分)达到最大(1711 km2),面积峰值滞后增雨量峰值出现。另外,催化后180 min(05时21分),自然降雨量大于增雨量,也就是说,作业3 h后,增雨作用小于自然降雨。
|
| 图 9 增雨影响回波产生的地面总降雨量、云体自然降雨量、增加雨量和增雨面积的时间演变 Fig. 9 Temporal evolution of total surface precipitation,natural precipitation,artificial precipitation enhancement and affected area during the seeding |
增雨影响时段,逐次将增雨影响回波投影到地面得到增雨影响区(图10a),其面积为5448 km2。在增雨影响区内,逐次分别叠加自然降雨量、总降雨量、增雨量,得到相应的空间分布(图10b—d)。分析图10可知,增雨影响区位于播撒线下游,呈条带状,与播撒结束时形成的播撒线平行,影响区形状与播撒线相关;增雨影响区内总降雨量空间分布为中间大边缘小,高值区位于淳化北部和耀州地区,与增雨量空间分布一致,而与自然降雨分布关联性不大,说明增雨改变了降雨空间分布。计算得到增雨影响区总降雨总量和增雨总量分别为1.518×10⁶ m3和8.04×10⁵ m3,影响区内增雨率达53%。

|
| 图 10 增雨影响区 (a)、累计总降雨量 (b)、自然降雨 (c) 和人工增加降雨 (d) 的空间分布 (蓝色实线和红色点虚线同图2) Fig. 10 Spatial distributions of areas affected by precipitation enhancement (a),cumulative total precipitation (b),natural precipitation (c) and artificial precipitation enhancement (d) (The blue solid line and the red dotted line are the same as that shown in Fig.2) |
增雨作业成功的基本指标是观测到地面降雨量超过预期的自然降雨量。当前,从自然降雨的变化中直接探测人工催化增加的降雨量仍然具有极大的难度。针对这一难题,文中提出了利用雷达回波和雨滴谱数据计算地面增雨量的方法,对一次飞机冷云增雨作业进行了增雨量定量估算,得到主要结论如下:
(1)增雨影响时间约4 h,影响区面积为5448 km2。该区总降雨总量和增雨总量分别为1.518×10⁶ m3和8.04×10⁵ m3,增雨影响区内增雨率达53%。
(2)总降雨强度、增雨强度、自然降雨强度随时间先增后减,总降雨强度峰值与增雨强度峰值同步,早于自然降雨雨强峰值;增雨影响区位于播撒线下游,呈条带状,与播撒线有关,区域内总降雨量空间分布为中间大边缘小,与增雨量空间分布一致。说明此次增雨作业改变了降雨时、空分布,促进降雨形成,增加了地面降雨量。
增雨率不是一个固定量,对于不同云系、不同作业时机、作业部位都有所不同,仅对这次作业而言,增雨影响区内增雨率达53%。增雨率计算还存在许多不确定性,例如,位于淳化与铜川之间海拔高度为1500—1800 m的黄土高原沟壑纵横,对云系发生、发展可能产生不同影响;天气系统和云系自身发展演变,Z-I拟合关系式的误差等因素,都会影响增雨率计算。
本研究呈现了一次增雨云系从产生地面降雨到消散的完整过程,尽管只是一次飞机增雨个例,却是基于增雨物理效应检验的增雨定量估算,这些结果向着定量评估增雨效果迈出了关键一步。利用文中提出的增雨定量评估方法,可对其他的增雨作业个例开展效果评估,这对提高中国人工增雨效果评估的科学水平具有重要的推动作用。
此方法应用时,需把握两个关键环节,一是增雨作业一定要在满足作业条件的云体和部位实施,这样雷达和雨滴谱仪才能观测到相应的增雨响应;二是作业云体会随着高空气流移动,应追踪作业云体的时、空演变,准确分离增雨影响区,以及确定增雨影响区的自然降雨回波强度。
此方法能较好地回答增雨作业的增雨总量、影响时间、影响面积等问题,遗憾的是没有更多观测资料(增雨响应)支持新方法的应用。目前,中国已经建成较完备的雷达和雨滴谱观测网(每个地面气象站布设了激光雨滴谱仪),文中结果就是基于常规气象观测网取得的,因此,现有气象观测网基本可以满足飞机增雨效果检验要求。应用新方法检验增雨效果,必须满足的条件是雷达和雨滴谱仪观测到增雨响应,这里还存在许多亟待解决的科学问题,今后仍需不断探索。
致 谢:本研究得到南京信息工程大学大气物理学院楚志刚博士在泾河雷达基数据处理方面的帮助,使用了风云卫星遥感数据服务网(http://satellite.nsmc.org.cn)提供的FY-3C数据,在此一并表示感谢。
戴进, 余兴, Rosenfeld D等. 2006. 一次过冷层状云催化云迹微物理特征的卫星遥感分析. 气象学报, 64(5): 622-630. Dai J, Yu X, Rosenfeld D, et al. 2006. Analysis of satellite observed microphysical signatures of cloud seeding tracks in supercooled layer clouds. Acta Meteor Sinica, 64(5): 622-630. DOI:10.3321/j.issn:0577-6619.2006.05.009 (in Chinese) |
段婧, 楼小凤, 卢广献等. 2017. 国际人工影响天气技术新进展. 气象, 43(12): 1562-1571. Duan J, Lou X F, Lu G X, et al. 2017. International recent progress in weather modification technologies. Meteor Mon, 43(12): 1562-1571. DOI:10.7519/j.issn.10000526.2017.12.012 (in Chinese) |
郭学良, 方春刚, 卢广献等. 2019. 2008—2018年我国人工影响天气技术及应用进展. 应用气象学报, 30(6): 641-650. Guo X L, Fang C G, Lu G X, et al. 2019. Progresses of weather modification technologies and applications in China from 2008 to 2018. J Appl Meteor Sci, 30(6): 641-650. DOI:10.11898/1001-7313.20190601 (in Chinese) |
河北省气象局. 1973. 1963年3月8日干冰催化层性冷云试验报告∥全国人工降水、防雹科技座谈会报告选编(上). 北京: 中央气象局研究所, 121-126. Meteorological Bureau of Hebei Province. 1973. A report of dry ice seeding stratiform cold cloud on March 8, 1963∥Selected Edition Report of National Symposium on Artificial Precipitation and Hail Suppression (Volume I). Beijing: Institute of the Central Meteorological Administration, 121-126(in Chinese)
|
洪延超, 雷恒池. 2012. 云降水物理和人工影响天气研究进展和思考. 气候与环境研究, 17(6): 951-967. Hong Y C, Lei H C. 2012. Research advance and thinking of the cloud precipitation physics and weather modification. Climatic Environ Res, 17(6): 951-967. DOI:10.3878/j.issn.1006-9585.2012.06.32 (in Chinese) |
雷恒池, 洪延超, 赵震等. 2008. 近年来云降水物理和人工影响天气研究进展. 大气科学, 32(4): 967-974. Lei H C, Hong Y C, Zhao Z, et al. 2008. Advances in cloud and precipitation physics and weather modification in recent years. Chinese J Atmos Sci, 32(4): 967-974. DOI:10.3878/j.issn.1006-9895.2008.04.21 (in Chinese) |
刘晴, 姚展予. 2013. 飞机增雨作业物理检验方法探究及个例分析. 气象, 39(10): 1359-1368. Liu Q, Yao Z Y. 2013. On physical eveluation of aircraft cloud seeding and case study. Meteor Mon, 39(10): 1359-1368. DOI:10.7519/j.issn.1000-0526.2013.10.015 (in Chinese) |
刘卫国, 陶玥, 周毓荃等. 2021. 基于飞机真实轨迹的一次层状云催化的增雨效果及其作用机制的模拟研究. 气象学报, 79(2): 340-358. Liu W G, Tao Y, Zhou Y Q, et al. 2021. Simulation of stratiform cloud seeding, its rainfall enhancement effect and mechanism study based on a real trajectory of aircraft. Acta Meteor Sinica, 79(2): 340-358. (in Chinese) |
刘香娥, 何晖, 高茜等. 2021. 中尺度碘化银催化数值模式在人工影响天气业务中的应用试验. 气象学报, 79(2): 359-368. Liu X E, He H, Gao Q, et al. 2021. Research on application of the mesoscale silver iodide seeding numerical model. Acta Meteor Sinica, 79(2): 359-368. (in Chinese) |
毛节泰, 郑国光. 2006. 对人工影响天气若干问题的探讨. 应用气象学报, 17(5): 643-646. Mao J T, Zheng G G. 2006. Discussions on some weather modification issues. J Appl Meteor Sci, 17(5): 643-646. DOI:10.3969/j.issn.1001-7313.2006.05.015 (in Chinese) |
余兴, 戴进, 雷恒池等. 2005. NOAA卫星云图反映播云物理效应. 科学通报, 50(1): 77-83. Yu X, Dai J, Lei H C, et al. 2005. Physical effect of cloud seeding revealed by NOAA satellite imagery. Chinese Sci Bull, 50(1): 45-52
|
Dong X B, Zhao C F, Yang Y, et al. 2020. Distinct change of supercooled liquid cloud properties by aerosols from an aircraft-based seeding experiment. Earth Space Sci, 7(8): e2020EA001196. |
French J R, Friedrich K, Tessendorf S A, et al. 2018. Precipitation formation from orographic cloud seeding. Proc Natl Acad Sci USA, 115(6): 1168-1173. DOI:10.1073/pnas.1716995115 |
Friedrich K, Ikeda K, Tessendorf S A, et al. 2020. Quantifying snowfall from orographic cloud seeding. Proc Natl Acad Sci USA, 117(10): 5190-5195. DOI:10.1073/pnas.1917204117 |
Haupt S E, Rauber R M, Carmichael B, et al. 2018. 100 years of progress in applied meteorology. PartⅠ: Basic applications. Meteorological Mono- graphs, 59: 22.1-22.33. DOI:10.1175/AMSMONOGRAPHS-D-18-0004.1 |
Rosenfeld D, Yu X, Dai J. 2005. Satellite-retrieved microstructure of AgI seeding tracks in supercooled layer clouds. J Appl Meteor, 44(6): 760-767. DOI:10.1175/JAM2225.1 |
Tessendorf S A, French J R, Friedrich K, et al. 2019. A transformational approach to winter orographic weather modification research: The SNOWIE project. Bull Amer Meteor Soc, 100(1): 71-92. DOI:10.1175/BAMS-D-17-0152.1 |
Wang J, Yue Z G, Rosenfeld D, et al. 2021. The evolution of an AgI cloud-seeding track in central China as seen by a combination of radar, satellite, and disdrometer observations. J Geophys Res:Atmos, 126(11): e2020JD033914. |
Yu X, Dai J, Rosenfeld D, et al. 2005. Comparison of model-predicted transport and diffusion of seeding material with NOAA satellite-observed seeding track in supercooled layer clouds. J Appl Meteor, 44(6): 749-759. DOI:10.1175/JAM2224.1 |
 2021, Vol. 79


