 2021, Vol. 79
中国气象学会主办。
文章信息
- 李昱薇, 傅刚, 陈莅佳, 孙柏堂. 2021.
- LI Yuwei, FU Gang, CHEN Lijia, SUN Baitang. 2021.
- 2018年1月北大西洋上一个具有“T”型锋面结构的超强爆发性气旋的分析
- Analysis of a super explosive cyclone with frontal "T-bone" structure over the Northern Atlantic in January 2018
- 气象学报, 79(3): 387-399.
- Acta Meteorologica Sinica, 79(3): 387-399.
- http://dx.doi.org/10.11676/qxxb2021.025
文章历史
-
2020-12-03 收稿
2021-02-25 改回


2. 中国海洋大学海洋气象学系,青岛,266100;
3. 中国海洋大学物理海洋教育部重点实验室,青岛,266100;
4. 莱西市气象局,莱西,266622
2. Department of Marine Meteorology,Ocean University of China,Qingdao 266100,China;
3. Key Laboratory of Physical Oceanography,Ocean University of China,Qingdao 266100,China;
4. Laixi Meteorological Bureau,Laixi 266622,China
爆发性气旋(Explosive Extratropical Cyclone,简称EC)是指在短时间内快速发展的中纬度温带气旋(傅刚等,2017),Sanders等(1980)最早给出爆发性气旋定义:在24 h内气旋的海表面中心气压值下降超过24 hPa,即气旋的海表面中心气压加深率大于1 hPa/h的温带气旋。Yoshida等(2004)采用12 h降压时间间隔对爆发性气旋定义中的时间间隔进行了修正。Sun等(2018)对北半球1979—2016年的爆发性气旋进行统计分析,得到北大西洋上空中心纬度分布的平均值为49.96°N,所以将北大西洋区域爆发性气旋的地转调整纬度修正为50°N。
在卫星云图上,爆发性气旋往往会伴有明显的紧密螺旋云团,且在天气图上常常能够分析出锋面系统。锋面与温带地区频繁发生的降水、气温和风的急剧变化等天气现象有关(Simmonds,et al,2012),是锋面气旋产生的关键因素。因此,对锋面系统的研究是对温带气旋发展研究的重要组成部分。
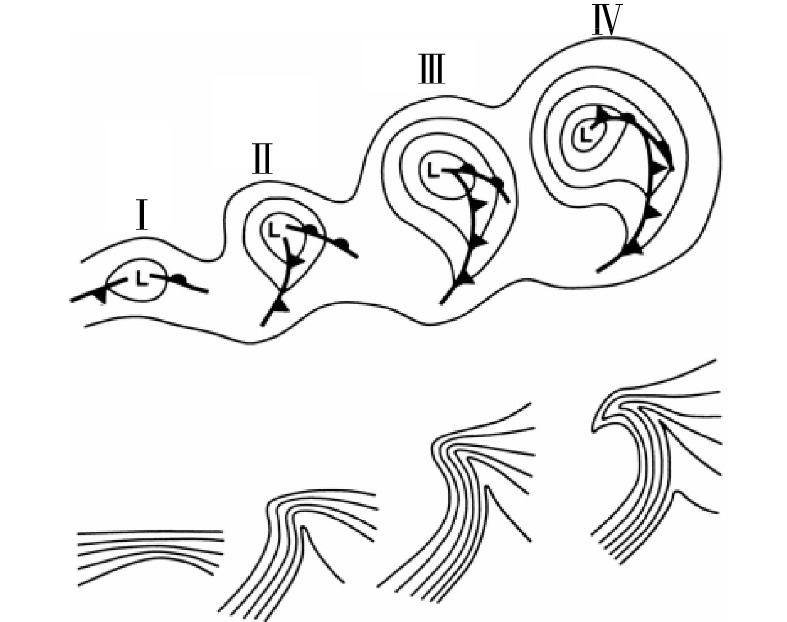
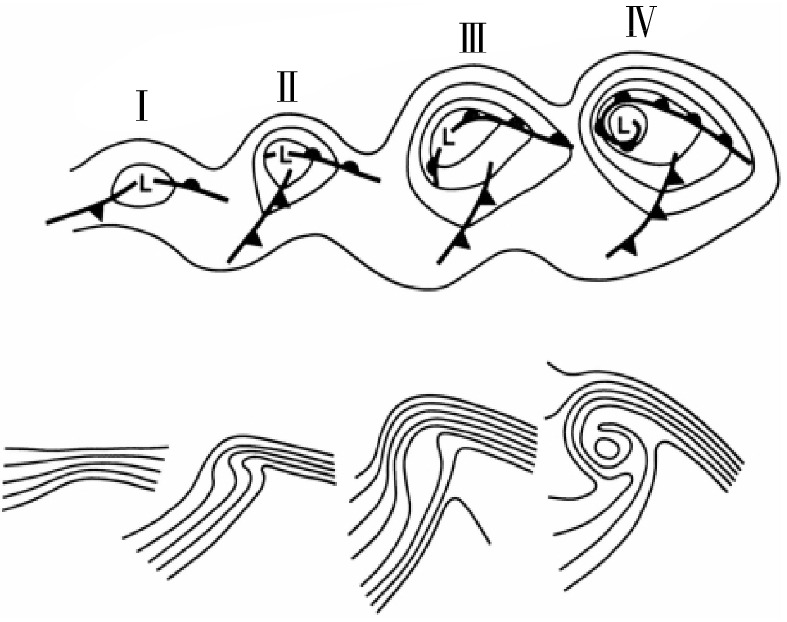
陶祖钰等(2014)以锋面气旋模型为例将天气学划分为“古代”、经典、近代和现代4个阶段。近百年前,以Bjerknes等(1922)为代表的挪威学派提出了经典锋面气旋模型,该模型可以较好地描述大陆上多数温带气旋的发展过程(熊秋芬等,2013)。随着观测资料和数值模式的进步,Shapiro等(1990)发现,海洋上的爆发性气旋在发展过程中往往具有“T”型(T-bone)锋面结构和锋区“后弯”(bent-back)现象,而不存在冷锋赶上暖锋形成的锢囚锋,修正了经典锋面气旋模型。尽管关于温带气旋发展和演变有许多不同观点,但挪威气旋模型和Shapiro-Keyser气旋模型是目前被普遍接受的两种模型(Schultz,et al,1998),具体描述见表1。
| 挪威气旋模型 | Shapiro-Keyser 气旋模型 | |
| 概念模型图(Schultz,et al,1998) |
|
|
| 阶段划分 | (Ⅰ)初始锋面波动阶段; (Ⅱ)和(Ⅲ)气旋发展阶段,冷锋绕低压快速移动使暖区变窄; (Ⅳ)形成锢囚锋的成熟阶段。 |
(Ⅰ)初始锋面波动阶段; (Ⅱ)冷、暖锋锋面断裂,向极地一侧的冷锋减弱; (Ⅲ)形成“T”型结构,锋区向气旋中心后部弯曲; (Ⅳ)暖核被隔离。 |
| 特征 | 锢囚过程开始时,冷锋赶上暖锋,气旋的扇形暖区逐渐缩小至消失,被抬升到高空(陶祖钰等,2014)。气旋中心部位的温度梯度很小、甚至不存在温度梯度。气旋具有近似南北向、狭长且强的冷锋和短而宽且弱的暖锋(熊秋芬等,2013)。 | 锋区向气旋中心的后方弯曲,暖空气和冷空气同时向气旋中心卷入使气旋中心形成暖核和狭窄的干冷缝(熊秋芬等,2013)。气旋中心附近与环形锋面相伴的温度梯度非常大,存在东西向拉长的暖锋和较弱的冷锋。 |
在北大西洋上,爆发性气旋频繁发生且是影响北美东岸和欧洲最严重的自然灾害之一,学者们对此区域的爆发性气旋个例较为关注,对1978年以来大西洋上6个著名的爆发性气旋进行了研究(Gyakum,1983;Uccellini,et al,1985;Odell,et al,2013;Wernli,et al,2002;Liberato,et al,2013;Chadenas,et al,2014),它们都具有显著的挪威气旋锋面结构。然而,在过去的几十年中学者们对Shapiro-Keyser气旋模型的个例鲜有研究。
2018年1月3—6日在西北大西洋上发生了一个具有“T”型锋面结构的超强爆发性气旋,该气旋被命名为“格雷森”(Storm Grayson)。它经历了强烈的爆发性发展过程,给美国东海岸带来了低温和暴雪灾害,并造成了人员伤亡,引发社会关注。文中旨在研究该超强爆发性气旋快速发展的机制以及“T”型锋面结构的成因和特征,寻找二者的内在关联,以期为该类型爆发性气旋的有效预报和预警提供科学依据。
2 资 料使用的资料如下:
(1)欧洲中期天气预报中心(ECMWF)提供的ERA-Interim再分析资料,包括:海表面气压、10 m高度风场和2 m高度温度场,不同气压层上的位势高度、气温、比湿、风场和垂直风速等物理量,空间分辨率为0.5°×0.5°,时间间隔为6 h(http://apps.ecmwf.int/dataests/data/interim-full-daily)。
(2)麦迪逊-威斯康星大学气象卫星研究所(CIMSS)提供的地球静止环境业务卫星(GOES-EAST)红外云图,覆盖区域包括西北太平洋、东北太平洋、北大西洋、东大西洋、印度洋、大洋洲等,时间间隔为3 h(http://tropic.ssec.wisc.edu/archive)。
3 气旋的时、空结构 3.1 演变过程该气旋于2018年1月3日12时(世界时,下同)在美国东南部,巴哈马以北(25°N,79°W)附近洋面生成(图1a),气旋中心气压约1012.2 hPa(图1b)。气旋在沿北美洲东岸向东北方向移动的过程中快速发展,生成后6 h爆发性发展,1月3日18时气旋中心气压下降率达2.6 hPa/h,24 h气旋中心气压下降了48.7 hPa。4日00时气旋中心气压下降率达到最大(3.94 hPa/h)。5日06 时气旋中心气压下降到最低(956.4 hPa)。随后气旋在美国东北部(51°N,64°W)附近登陆并移出研究范围。

|
| 图 1 2018年1月3日12时—6日06 时 (a) 气旋中心移动路径 (实心点) 及4日12时海表面气压场 (实线,单位:hPa) 和2 m高度温度与海表温度差 (色阶,单位:°C),(b) 气旋海表面中心气压 (实线,单位:hPa) 及中心气压下降率 (虚线,单位:hPa/h) 随时间变化 Fig. 1 (a) The moving track of cyclone center (dot) from 12:00 UTC 3 to 06:00 UTC 6 January 2018 and sea level pressure (solid line,unit:hPa) and the difference between 2 m height temperature and sea surface temperature (shaded,unit:°C) at 12:00 UTC 4 January 2018,(b) time series of central sea level pressure (solid line,unit:hPa) of the cyclone and its deepening rate (dotted line,unit:hPa/h) |
该爆发性气旋伴随有明显的紧密螺旋云团(图2),可分析出锋面系统。基于850 hPa假相当位温梯度和10 m高度风变化识别和定位锋面(Schemm,et al,2015),锋面结构的演变过程划分为以下4个阶段:

|
| 图 2 2018年1月3日12 时—5日06时GOES-EAST卫星红外波段云顶亮温 (色阶,单位:K),850 hPa假相当位温 (实线,单位:K) 和10 m高度风场 (全风羽,单位:m/s),以及冷锋锋面 (蓝线) 和暖锋锋面 (红线)(a. 3日12时,b. 3日18时,c. 4日00时,d. 4日06时,e. 4日12时,f. 4日18时,g. 5日00时,h. 5日06时) Fig. 2 Cloud top brightness temperature (shaded,unit:K) of GOES-EAST satellite infrared imagery,pseudo-equivalent potential temperature (solid line,unit:K) at 850 hPa and horizontal wind (full barb,unit:m/s) at 10 m height from 12:00 UTC 3 to 06:00 UTC 5 January 2018,with the cold front (blue line) and warm front (red line)(a. 12:00 UTC 3,b. 18:00 UTC 3,c. 00:00 UTC 4,d. 06:00 UTC 4,e. 12:00 UTC 4,f. 18:00 UTC 4,g. 00:00 UTC 5,h. 06:00 UTC 5) |
Ⅰ. 初始锋面波动(3日12—18 时):气旋的冷、暖锋相连接(图2b),冷空气来自北美大陆,与东南部洋面上的暖空气交汇。

|
| 图 2 Fig. 2 Continued |
Ⅱ. 冷、暖锋锋面断裂,向极地一侧的冷锋减弱(3日19时—4日00时):随着气旋式环流加强,低压中心南部的冷锋锋区假相当位温(θse)梯度减小,向极地一侧的冷锋减弱,暖锋锋区收缩变窄,水平向东部延伸(图2c),原来连续的冷、暖锋发生断裂。
Ⅲ. 形成“T”型结构,锋区向气旋中心后部弯曲(4日01—12时):低压中心北部的暖锋锋区加强,且锋区不断向气旋中心后部发展,形成后弯锋(图2d、e),冷锋锋区则继续减弱东移,东移的冷锋与暖锋呈现近似垂直的“T”型结构。
Ⅳ. 暖核被隔离(4日13时—5日06时):气旋逐渐成熟,假相当位温(θse)等值线包围低压中心,在低压中心附近形成相对暖的中心,“暖核”被隔离(图2f—h)。
3.2 外部环流背景气旋中心附近,美国东南部近海岸海表温度受墨西哥湾流影响异常偏高,水平梯度较大。气旋在较暖的湾流上空生成,沿湾流延伸方向快速发展(图1a)。4日12时,气旋中心附近2 m高度气温比海温低约9°C,近岸海-气温差超过15°C,来自北美大陆西北的冷空气进入温暖的洋面,使得上层大气感热通量和潜热释放增大,促进气旋快速发展。
在天气形势上,300 hPa高空急流建立,呈西南—东北向,与等位势高度线走向基本一致,随着槽线东移,高空急流弯曲,断裂为南、北两部分(图3a)。气旋中心位于高空急流入口处南部,高空对应强辐散区,水平散度超过10−4 s−1。地面气旋中心位于500 hPa位势高度场的槽前,伴有超过3×10⁻⁸ s−2的正涡度平流(图3b),温度槽落后于位势高度槽。850 hPa高度上(图3c),气旋中心南部及东北部上空等温线较密集,等温线与等位势高度线近乎垂直,大气斜压性较强。4日12时,850 hPa等温线密集区及大气斜压性大值区与锋区基本一致,呈“T”型结构,冷、暖平流的位置与冷、暖锋区相对应,气旋中心东北部暖平流较强,较弱的冷平流覆盖气旋中心以南。海表面气压场上(图3d),气旋的水平尺度及大风区面积逐渐增大,气旋东部及南部有明显的气旋式风切变。超过25 m/s的风速大值区环绕气旋西南东3个方向,风速在锋区辐合,由水平辐合导致的锋生作用较强,有利于锋面发展。

|
| 图 3 2018年1月4日12时大尺度环流背景场 (a. 300 hPa位势高度 (实线,单位:gpm)、水平辐散场 (虚线,单位:10−5 s−1) 和急流 (全风羽,单位:m/s);b. 500 hPa位势高度(实线,单位:gpm)、气温(虚线,单位:°C) 和涡度平流 (色阶,单位:10−9 s−1);c. 850 hPa位势高度 (实线,单位:gpm)、气温 (虚线,单位:°C) 和温度平流(色阶,单位:10−4 K/s);d. 海表面气压场(实线,单位:hPa)、气温(虚线,单位:°C)、全风速 (色阶,单位:m/s)和风场 (全风羽,单位:m/s)) Fig. 3 Weather maps at 12:00 UTC 4 January 2018 (a. geopotential height (solid line,unit:gpm),horizontal divergence (dotted line,unit:10−5 s−1) and jet stream (full barb,unit:m/s) at 300 hPa;b. geopotential height (solid line,unit:gpm),air temperature (dotted line,unit:°C) and vorticity advection (shaded,unit:10−9 s−1) at 500 hPa;c. geopotential height (solid line,unit:gpm),air temperature (dotted line,unit:°C) and temperature advection (shaded,unit:10−4K/s) at 850 hPa;d. sea level pressure (solid line,unit:hPa),air temperature (dotted line,unit:°C),total wind speed (shaded,unit:m/s) and horizontal wind (full barb,unit:m/s)) |
锋生函数(F)是定量描述锋生和锋消的重要物理量。Petterssen(1936)把大气锋生定义为水平位温梯度沿气块轨迹的时间变化率,即,F>0时代表有锋生作用,F<0时为锋消作用,F=0时既无锋生也无锋消。4日12时,950 hPa锋生函数大值区略前置于等位温线密集区,反映了锋面的发展和移动方向(图4a)。锋生区主要位于气旋中心北部向东延伸的暖锋锋区及断裂的冷锋锋区,呈“T”型结构,锋生函数大值中心为2.4×10⁻⁷ K/(m·s),气旋中心西侧存在锋消,锋生作用大于锋消作用,锋面将继续发展。垂直结构上,暖锋系统深厚,超过10−8 K/(m·s)的锋生函数可达400 hPa高度(图4d),冷锋系统较弱,等位温线的垂直分布在低层呈“鼻状”结构,这与来自北美大陆的冷空气被较高温度的洋面加热有关。

|
| 图 4 2018年1月4日12 时气旋水平(a—c)及垂直(d—f)结构 (a. 950 hPa锋生函数 (色阶,单位:10−9 K/(m·s)) 和位温(实线,单位:K),b. 900 hPa全风速 (色阶,单位:m/s)、风场 (全风羽,单位:m/s) 和相对涡度 (实线,单位:10−4 s−1),c. 850 hPa大气视热源(色阶,单位:K/d) 和湿焓(实线,单位:103 J/kg);d—f分别为a—c中沿AB的垂直剖面) Fig. 4 Horizontal and vertical cross section analysis at 12:00 UTC 4 January 2018 (a. frontogenetical function (shaded,unit:10−9 K/(m·s)) and potential temperature (solid line,unit:K) at 950 hPa;b. total wind speed (shaded,unit:m/s),horizontal wind (full barb,unit:m/s) and relative vorticity (solid line,unit:10−4 s−1) at 900 hPa;c. apparent heat source (shaded,unit:K/d) and enthalpy of moist air (solid line,unit:103 J/kg) at 850 hPa;d—f show the vertical cross section analyses a—c,respectively) |
由于气旋发展迅速,低层相对涡度急剧增大,低压中心南部来自西北方向的干冷空气随气旋式环流快速向东推进,与暖湿气流在气旋中心东南部交汇。4日12时,相对涡度大值区围绕气旋中心分布(图4b),系统较为深厚,气旋中心上部整层伴有大于10−4 s−1的相对涡度,900 hPa附近相对涡度超过6×10⁻⁴ s−1(图4e)。东南部高空急流下传,800 hPa出现风速达45 m/s的低空急流,西北部低层也存在一个明显的急流中心,高低空急流耦合,气旋快速发展。
大气视热源(Q1)为单位时间内单位质量空气的加热率,代表辐射、潜热释放和表面热通量等带来的加热。研究(Hsu,et al,2011)表明,大气中视热源的加热作用是影响天气系统发生、发展的重要热力强迫因子。湿焓为湿空气的显热能和潜热能之和,高湿焓区对应高温、高湿的能量聚集区。4日12时,大气视热源主要分布在冷暖锋区和后弯区,气旋中心东北部和南部的湿焓梯度大值区几乎垂直,气旋中心附近伴有超过3.6×10³ J/kg的湿焓(图4c)。在垂直结构上,低层后弯锋区的大气视热源和湿焓梯度较大,能量在此堆积(图4f)。
4 气旋的发展机制分析 4.1 WRF数值模拟由于本研究所使用的ERA-Interim再分析资料的时间间隔为6 h,难以对气旋演变过程进行详细且精准的描述。所以采用WRFv3.7.1进行数值模拟,主要参数设置见表2。区域中心为(36°N,72°W),模拟时段3日00时—6日06 时,得到水平分辨率为15 km,时间间隔为1 h的模拟结果。
| WRF参数 | 模式设置 |
| 水平分辨率 | Δx=Δy=15 km |
| 初始时刻 | 1月3日00时 |
| 时间步长 | 60 s |
| 格点数目 | 500×300×35 |
| 微物理方案 | Lin方案(Lin,et al,1983) |
| 长波辐射方案 | RRTM方案(Mlawer,et al,1997) |
| 短波辐射方案 | Dudhia方案(Dudhia,1989) |
| 积云参数化方案 | Kain-Fritsch方案(Kain,2004) |
| 大气边界层方案 | YSU方案(Hong,et al,2006) |
对比验证可知,WRF模式模拟的气旋移动路径与ERA-Interim再分析资料得到的气旋移动路径较吻合(图5a)。尤其是在气旋快速降压阶段,两移动路径基本一致。海表面中心气压与ERA-Interim再分析资料得到的结果趋势相似,但数值整体偏低。WRF模式给出的气旋中心气压最低时刻为5日03时,比ERA-Interim约提前了3 h,中心气压最低值约为954 hPa(图5b)。分析得到的天气形势较一致(图略),WRF模式模拟(图5c、d)与ERA-Interim再分析资料(图2c、e)获得的低层温度场和风场配置及锋区的位置和强度均相似。总体而言,在该气旋的模拟中WRF模式模拟结果与ERA-Interim再分析资料有较好的一致性。下面将利用WRF模式模拟结果对气旋爆发性发展的机制进行分析。

|
| 图 5 WRF模式模拟结果 (实线) 和ERA-Interim再分析资料 (虚线) 确定的2018年1月3日12时—6日06时 (a) 气旋中心移动路径和 (b) 海表面中心气压随时间变化及WRF模式模拟4日00时(c)、12时(d)的850 hPa假相当位温 (实线,单位:K)、10 m风场 (全风羽,单位:m/s)、冷锋锋面 (灰线) 和暖锋锋面 (黑线) Fig. 5 (a) Moving tracks and (b) time series of central sea level pressure of cyclone provided by WRF modeling result (solid line) and ERA-Interim data (dotted line) from 12:00 UTC 3 to 06:00 UTC 6 January 2018,pseudo-equivalent potential temperature (solid line,unit:K) at 850 hPa and horizontal wind (full barb,unit:m/s) at 10 m height,with cold front (gray line) and warm front (black line) provided by WRF modeling result (c. 00:00 UTC 4,d. 12:00 UTC 4) |
前文定性分析表明,潜热释放、温度平流和涡度平流等因子对爆发性气旋快速发展具有重要作用,但是它们对气旋发展的具体贡献并不清楚。下面基于WRF模式模拟结果,利用Zwack-Okossi(简称Z-O)方程诊断分析该气旋快速发展的机制。
通过Z-O方程计算近地面地转涡度来诊断地面气旋的发展,此方法考虑到了大气各层的动力和热力强迫作用(Zwack,et al,1986)。文中采用Lupo等(1992)给出的Z-O方程广义形式
| $ \begin{split} \frac{{\partial {\zeta _{\rm{gl}}}}}{{\partial t}} =& P_{\rm d}\int\nolimits_{{p_{\rm t}}}^{{p_{\rm l}}} { - { V} {\text •} \nabla {\zeta _{\rm a}}{\rm d}}p -\\& P_{\rm d} \int\nolimits_{{p_{\rm t}}}^{{p_{\rm l}}} {\left[ {\frac{R}{f}\int\nolimits_{{p_{\rm t}}}^{{p_{\rm l}}} {{\nabla ^2}\left({ - { V} {\text •} \nabla T + \frac{{\dot Q}}{{{c_{\rm p}}}} + S\omega } \right)} {\rm d}\ln p} \right]} {\rm d}p+\\ & P_{\rm d}\int\nolimits_{{p_{\rm t}}}^{{p_{\rm l}}} \!\!\!- { k} {\text •} \nabla \times { F}{\rm d}p \!-\! P_{\rm d}\int\nolimits_{{p_{\rm t}}}^{{p_{\rm l}}} {\frac{{\partial {\zeta _{\rm{ag}}}}}{{\partial t}}{\rm d}p} \!-\! P_{\rm d}\int\nolimits_{{p_{\rm t}}}^{{p_{\rm l}}} {\omega \frac{{\partial {\zeta _{\rm a}}}}{{\partial p}}{\rm d}p}\!- \\ &P_{\rm d} \int\nolimits_{p_{\rm t}}^{p_{\rm l}}\left(\frac{\partial \omega}{\partial x} \frac{\partial v}{\partial p}-\frac{\partial \omega}{\partial y} \frac{\partial u}{\partial p}\right) {\rm d} p+P_{\rm d} \int_{p_{\rm t}}^{p_{\rm l}} \zeta_{\rm a} \frac{\partial \omega}{\partial p} {\rm d} p \end{split} $ | (1) |
式中,ζgl是近地面地转涡度(单位:s−1),
该爆发性气旋快速降压阶段,其中心气压下降率和Z-O方程中950 hPa地转涡度倾向随时间变化曲线趋势一致(图6)。随着气旋快速发展,二者均逐渐增大,至3日22时,气旋中心气压下降率达到最大(4.2 hPa/h),地转涡度倾向此时亦达到最大(1.65×10−9 s−1),随后逐渐减小。虽然地转涡度倾向的数值有所波动,但二者整体趋势一致。因此,利用Z-O方程对该爆发性气旋进行诊断分析是合适的。

|
| 图 6 2018年1月3日18时—5日03时气旋海表面中心气压加深速率 (实线) 和950 hPa地转涡度倾向的区域平均值 (虚线)随时间的变化 Fig. 6 Time series of the deepening rate of central sea level pressure (solid line) and the area-mean value of geostrophic vorticity tendency (dotted line) at 950 hPa from 18:00 UTC 3 to 03:00 UTC 5 January 2018 |
以气旋中心为中心的10°×10°范围内Z-O方程各因子平均值如图7所示。式(1)950 hPa地转涡度倾向主要受绝对涡度水平平流、温度水平平流、非绝热加热和绝热因子的影响,其余各因子的贡献非常小,不足以对地转涡度倾向的变化产生显著影响。因此,下文主要对气旋发展不同时刻Z-O方程中绝对涡度水平平流、温度水平平流、非绝热加热和绝热对地转涡度倾向的贡献进行分析。

|
| 图 7 Z-O方程各因子的区域平均值分布 (a. 3日18时,b. 3日22时,c. 4日12时,d. 5日03时) Fig. 7 Histograms of area-mean value of geostrophic vorticity tendency at 950 hPa and area-mean values of nine terms on the right-hand-side of Z-O equation (a. 18:00 UTC 3,b. 22:00 UTC 3,c. 12:00 UTC 4,d. 03:00 UTC 5 January 2018) |
气旋初始爆发阶段,非绝热加热对气旋快速发展有较大贡献(图8),这是因为西北冷空气进入温暖的洋面,海洋对上层大气潜热释放较强。气旋进一步发展,“T”型锋面结构显著,温度平流净贡献较大。随着气旋继续加深,平流对地转涡度倾向的贡献超过非绝热加热。绝热始终与非绝热位相相反,对地转涡度倾向为负的贡献。

|
| 图 8 2018年1月3日18时—5日03时Z-O方程部分因子的区域平均值随时间变化 Fig. 8 Time series of area-mean value of GVT (black solid line) at 950 hPa and area-mean values of the first four terms (VADV,TADV,LATH and ADIA terms showed with different grey lines) in the right-hand-side of Z-O equation from 18:00 UTC 3 to 03:00 UTC 5 January 2018 |
3日22时,气旋中心气压下降率最大,地转涡度倾向正值区主要位于气旋中心东北部,负值区位于气旋中心西南部,强度和分布范围均小于正值区(图略)。由于大气感热和潜热较强,非绝热加热作用显著,对地转涡度倾向的增大起主要作用。4日12时,气旋进一步发展,地转涡度倾向正值区和负值区的强度和范围都有所增大,正值区位于气旋东北部,正值中心超过1.5×10⁻⁸ s−1,负值区位于气旋西南部(图9)。温度平流正值区位于气旋中心以北,数值约为1.0×10⁻⁸ s−1,超过−5.0×10⁻⁹ s−1的负值区位于气旋中心南部,与地转涡度倾向的分布相似(图9b)。随着冷暖锋区发展,温度平流作用加强,气旋发展起重要作用。非绝热加热相对之前阶段显著减弱,正值区主要位于气旋中心东北部(图9c)。绝热因子与非绝热因子位相相反,整体以负值为主(图9d)。

|
| 图 9 2018年1月4日12时Z-O方程部分因子 (等值线,单位:10−9 s−1) 对地转涡度倾向 (色阶,单位:10−9 s−1) 的贡献 (a. VADV,b. TADV,c. LATH,d. ADIA;方框表示以气旋中心为中点10°×10°的区域) Fig. 9 Contributions of the first four terms (isoline,unit:10−9 s−1) in the right-hand-side of Z-O equation to the geostrophic vorticity tendency (shaded,unit:10−9 s−1) at 12:00 UTC 4 January 2018 (a. VADV,b. TADV,c. LATH,d. ADIA. Box shows the area within 10°×10° centered in the surface cyclone center) |
根据前文分析,气旋“T”型锋面结构的显著特征为冷锋锋区的位置偏东且强度较弱,所对应的冷平流较弱。在Z-O方程中,由于冷平流较弱,温度平流负贡献较小(图9b),使得区域范围内温度平流净贡献较大,数值约为8.2×10⁻¹⁰ s−1(图8),对地转涡度倾向作用显著。这就导致在“T”型锋面结构阶段,温度平流对气旋发展起重要作用,使其快速发展并得以维持。
综上所述,非绝热加热、温度平流和正涡度平流是气旋发展的主要影响因子。初始爆发阶段,非绝热加热起主要作用。随着冷暖锋区发展,区域范围内温度平流净贡献较大,“T”型锋面结构对气旋快速发展和维持起重要作用。
5 总 结对2018年1月3—6日发生在北大西洋上一个超强爆发性气旋进行了分析,该气旋具有显著的“T”型锋面结构,得到的主要结论如下:
(1)该爆发性气旋“T”型锋面结构的演变过程分为4个阶段:Ⅰ. 初始锋面波动;Ⅱ. 冷、暖锋锋面断裂,向极地一侧的冷锋减弱;Ⅲ. 形成“T”型结构,锋区向气旋中心后部弯曲;Ⅳ. 暖核被隔离。
(2)大气的高低层环流形势配置、低层较强的大气斜压性和暖洋流作用等外部因素为气旋的快速发展提供了良好的环流背景场。锋区锋生作用显著,非绝热加热较强,水汽输送条件较好,能量堆积,有利的内部条件使其快速发展,并具备显著的“T”型空间结构。
(3)基于天气预报模式WRF的模拟结果,利用Z-O方程诊断分析表明,非绝热加热、温度平流和涡度平流是该爆发性气旋发展的主要影响因子。初始爆发阶段,非绝热加热贡献较大。后期,平流作用加强,显著的“T”型锋面结构使温度平流净贡献较大,气旋快速发展并得以维持。
(4)气旋的爆发性发展和其具有的“T”型锋面结构存在一定的内在关联(图10)。由于气旋发展迅速,低层相对涡度急剧增大,低压中心南部来自西北方向的干冷空气随气旋式环流快速向东推进,与暖湿气流在气旋中心东南部交汇,由水平辐合导致的锋生作用较强,冷锋锋区位置偏东。受湾流影响,较暖的洋面对西北冷空气的加热作用使得交汇的冷、暖空气温度梯度较小,这就使得减弱东移的冷锋与暖锋形成了近似垂直的“T”型结构。正因冷锋锋区的位置偏东且强度较弱,所对应的冷平流较弱。在Z-O方程中,由于冷平流较弱,区域范围内温度平流负贡献较小,使得温度平流净贡献较大,对气旋发展起重要作用,使其快速发展并得以维持。

|
| 图 10 气旋爆发性发展和其“T”型锋面结构间的内在关联 Fig. 10 A diagram of the internal relationship between the explosive development of cyclone and its frontal "T-bone" structure |
傅刚, 张树钦, 庞华基等. 2017. 爆发性气旋研究的回顾. 海洋气象学报, 37(1): 10-19. Fu G, Zhang S Q, Pang H J, et al. 2017. Review of researches on explosive cyclones. J Mar Meteor, 37(1): 10-19. (in Chinese) |
陶祖钰, 熊秋芬, 郑永光等. 2014. 天气学的发展概要−关于锋面气旋学说的四个阶段. 气象学报, 72(5): 940-947. Tao Z Y, Xiong Q F, Zheng Y G, et al. 2014. Overview of advances in synoptic meteorology: Four stages of development in conceptual models of frontal cyclones. Acta Meteor Sinica, 72(5): 940-947. (in Chinese) |
熊秋芬, 牛宁, 章丽娜. 2013. 陆地上爆发性温带气旋的暖锋后弯结构分析. 气象学报, 71(2): 239-249. Xiong Q F, Niu N, Zhang L N. 2013. Analysis of the back-bent warm front structure associated with an explosive extratropical cyclone over land. Acta Meteor Sinica, 71(2): 239-249. (in Chinese) |
Bjerknes J, Solberg H. 1922. Life cycle of cyclones and the polar front theory of atmospheric circulation. Geophys Publ, 3(1): 3-18. |
Chadenas C, Creach A, Mercier D. 2014. The impact of storm Xynthia in 2010 on coastal flood prevention policy in France. J Coast Conserv, 18(5): 529-538. DOI:10.1007/s11852-013-0299-3 |
Dudhia J. 1989. Numerical study of convection observed during the winter monsoon experiment using a mesoscale two-dimensional model. J Atmos Sci, 46(20): 3077-3107. DOI:10.1175/1520-0469(1989)046<3077:NSOCOD>2.0.CO;2 |
Gyakum J R. 1983. On the evolution of the QE II storm. Ⅰ: Synoptic aspects
. Mon Wea Rev, 111(6): 1137-1155. DOI:10.1175/1520-0493(1983)111<1137:OTEOTI>2.0.CO;2 |
Hong S Y, Noh Y, Dudhia J. 2006. A new vertical diffusion package with an explicit treatment of entrainment processes. Mon Wea Rev, 134(9): 2318-2341. DOI:10.1175/MWR3199.1 |
Hsu P C, Li T. 2011. Interactions between boreal summer intraseasonal oscillations and synoptic-scale disturbances over the Western North Pacific. Part Ⅱ: Apparent heat and moisture sources and eddy momentum transport. J Climate, 24(3): 942-961. DOI:10.1175/2010JCLI3834.1 |
Kain J S. 2004. The Kain-Fritsch convective parameterization: An update. J Appl Meteor Climatol, 43(1): 170-181. DOI:10.1175/1520-0450(2004)043<0170:TKCPAU>2.0.CO;2 |
Liberato M L R, Pinto J G, Trigo R M, et al. 2013. Explosive development of winter storm Xynthia over the subtropical North Atlantic Ocean. Nat Hazards Earth Syst Sci, 13(9): 2239-2251. DOI:10.5194/nhess-13-2239-2013 |
Lin Y L, Farley R D, Orville H D. 1983. Bulk parameterization of the snow field in a cloud model. J Climate Appl Meteor Climatol, 22(6): 1065-1092. DOI:10.1175/1520-0450(1983)022<1065:BPOTSF>2.0.CO;2 |
Lupo A R, Smith P J, Zwack P. 1992. A diagnosis of the explosive development of two extratropical cyclones. Mon Wea Rev, 120(8): 1490-1523. DOI:10.1175/1520-0493(1992)120<1490:ADOTED>2.0.CO;2 |
Mlawer E J, Taubman S J, Brown P D, et al. 1997. Radiative transfer for inhomogeneous atmospheres: RRTM, a validated correlated-k model for the longwave. J Geophys Res Atmos, 102(D14): 16663-16682. DOI:10.1029/97JD00237 |
Odell L, Knippertz P, Pickering S, et al. 2013. The Braer storm revisited. Weather, 68(4): 105-111. DOI:10.1002/wea.2097 |
Petterssen S. 1936. Contribution to the theory of frontogenesis. Geophys Publ, 11(6): 127. |
Sanders F, Gyakum J R. 1980. Synoptic-dynamic climatology of the "Bomb". Mon Wea Rev, 108(10): 1589-1606. DOI:10.1175/1520-0493(1980)108<1589:SDCOT>2.0.CO;2 |
Schemm S, Rudeva I, Simmonds I. 2015. Extratropical fronts in the lower troposphere-global perspectives obtained from two automated methods. Quart J Roy Meteor Soc, 141(690): 1686-1698. DOI:10.1002/qj.2471 |
Schultz D M, Keyser D, Bosart L F. 1998. The effect of large-scale flow on low-level frontal structure and evolution in midlatitude cyclones. Mon Wea Rev, 126(7): 1767-1791. DOI:10.1175/1520-0493(1998)126<1767:TEOLSF>2.0.CO;2 |
Shapiro M A, Keyser D. 1990. Fronts, jet streams and the tropopause∥Newton C W, Holopainen E O. Extratropical Cyclones: The Erik Palmén Memorial Volume. Boston: American Meteorological Society, 167-191
|
Simmonds I, Keay K, Bye J A T. 2012. Identification and climatology of southern hemisphere mobile fronts in a modern reanalysis. J Climate, 25(6): 1945-1962. DOI:10.1175/JCLI-D-11-00100.1 |
Sun Y W, Fu G, Sun J L, et al. 2018. Spatial distribution and seasonal variation of explosive cyclones over the North Atlantic. J Ocean Univ China, 17(5): 1000-1010. DOI:10.1007/s11802-018-3703-7 |
Uccellini L W, Keyser D, Brill K F, et al. 1985. The presidents' day cyclone of 18-19 February 1979: Influence of upstream trough amplification and associated tropopause folding on rapid cyclogenesis. Mon Wea Rev, 113(6): 962-988. DOI:10.1175/1520-0493(1985)113<0962:TPDCOF>2.0.CO;2 |
Wernli H, Dirren S, Liniger M A, et al. 2002. Dynamical aspects of the life cycle of the winter storm 'Lothar' (24-26 December 1999). Quart J Roy Meteor Soc, 128(580): 405-429. DOI:10.1256/003590002321042036 |
Yoshida A, Asuma Y. 2004. Structures and environment of explosively developing extratropical cyclones in the Northwestern Pacific region. Mon Wea Rev, 132(5): 1121-1142. DOI:10.1175/1520-0493(2004)132<1121:SAEOED>2.0.CO;2 |
Zwack P, Okossi B. 1986. A new method for solving the quasi-geostrophic omega equation by incorporating surface pressure tendency data. Mon Wea Rev, 114(4): 655-666. DOI:10.1175/1520-0493(1986)114<0655:ANMFST>2.0.CO;2 |