 2019, Vol. 77
中国气象学会主办。
文章信息
- 张硕, 姚秀萍, 巩远发. 2019.
- ZHANG Shuo, YAO Xiuping, GONG Yuanfa. 2019.
- 基于客观判识的青藏高原横切变线结构及演变特征合成研究
- A synthetic study of the structure and evolution characteristics of a meridionally-oriented shearline over the Tibetan Plateau based on objective identification
- 气象学报, 77(6): 1086-1106.
- Acta Meteorologica Sinica, 77(6): 1086-1106.
- http://dx.doi.org/10.11676/qxxb2019.058
文章历史
-
2018-09-17 收稿
2019-06-17 改回


2. 中国气象局气象干部培训学院, 北京, 100081
2. China Meteorological Administration Training Center, Beijing 100081, China
青藏高原平均海拔高度超过4000 m,地面气压较低,其中的各种物理过程尤其是边界层的物理过程不同于低海拔地区,因而具有特殊的研究意义(Liou,et al,1987;Smith,et al,1992;叶笃正等,1977;Ye,1981)。以往研究(Flohn,1957;Yin,1949;Tanaka,et al,2001;Ueda, et al,2003;Duan,et al,2005;Wu,et al,2007;Murakami,1958)表明,青藏高原的动力和热力作用对东亚及全球的能量和水分循环都有重要影响,同时也影响青藏高原局地天气、气候,东亚的大气环境及其周围地区甚至全球的大气环流的变化。因此,以青藏高原机械强迫和热力强迫为核心的青藏高原气象学已成为现代天气和气候的重要研究领域(吴国雄等,2004)。
20世纪50年代开始,针对青藏高原研究展开的大气数据分析、理论研究、数值模拟及综合观测实验,不仅加深了对青藏高原大气运动特征的认知(Yanai,et al,1992;Wu,1984;Broccoli,et al,1992;王宇虹等,2017),还发现由于青藏高原特殊地形及独特的动力、热力作用形成了青藏高原上特有的低值系统,即青藏高原切变线(简称高原切变线)和青藏高原低涡(简称高原低涡)(罗四维,1963;徐国昌,1984;Shen,et al,1986;何光碧等,2009;李国平等,2016)。
对高原切变线的研究,最早始于20世纪50年代(叶笃正等,1957)。结果表明,高原切变线对青藏高原及其他地区降水影响显著,夏半年(5—10月)有超过50%的高原切变线可给青藏高原地区带来降水,青藏高原上40%的暴雨发生与高原切变线有关(Zhang,et al,2016)。此外,高原切变线的东移发展会影响长江中下游、黄淮流域等中国东部地区的大范围降水过程,甚至引发青藏高原周边地区大范围的暴雨、雷暴、暴雪等灾害性天气(叶笃正等, 1957, 1979;乔全明等,1984;邓远平等,2000;马林等,2003;徐建芬等,2000)。可见,高原切变线是青藏高原上及周边地区灾害性天气发生的触发因子之一(郁淑华等, 2007, 2013;Zhao,2015;Li,et al,2008;李国平,2002),研究高原切变线结构特征和移动机理对灾害天气预报、预警有意义。
第一次青藏高原大气科学试验后,青藏高原气象科学研究拉萨会战组(1981)对夏半年青藏高原切变线发生频率、移动、云系特征以及形成条件等做了深入分析,而后展开的一系列研究(薛智,1980;徐国昌,1984;刘富明等,1987;何光碧等,2011)进一步深化了对高原切变线的动力热力结构特征、发展维持机理、移动特征以及降水特征等方面的认识。
基于不同关注角度,对高原切变线分类不同。根据高原切变线的走向,分为2类,即准东西向的青藏高原横切变线(简称高原横切变线)和准南北向的青藏高原竖切变线(简称高原竖切变线),高原横切变线出现次数是高原竖切变线的两倍(青藏高原气象科学研究拉萨会战组,1981);根据高原切变线的热力特征,分为高原暖性、斜压性和冷性切变线等3类,分别与无风带、西风带和东风带相对应(乔全明等,1984;朱乾根等,2000);根据高原切变线在卫星云图上的形态特征,高原切变线附近云带分为3类——切变线云带、切变串涡云系和槽尾切变线云系(鲍玉章,1990)。
对高原切变线动力、热力特征的研究主要着眼于对基本气象要素场的分析。应用1979年青藏高原大气科学试验加密观测资料进行分析后发现,高原切变线较为浅薄,垂直伸展高度在400 hPa以下,位于气旋性环流中,随高度升高向北倾斜,东西风切变很强(陶诗言等,1984;吕君宁等,1983)。高原切变线在青藏高原相对暖湿区,位于暖中心以北,切变线以南伴随有正涡度中心和辐合中心,450 hPa以下辐合上升运动与正涡度带位置相对应(徐国昌,1984;何光碧等,2011)。此外,利用FY-2F卫星数据对高原切变线过程进行分析指出,在切变线活动期间,不同阶段的结构特征差异明显(罗雄等,2018)。
综上,在高原切变线研究上,已取得了不少研究成果,但是以往对高原切变线研究主要基于年限较短的统计分析,高原切变线的确定以主观判断为主,在研究高原切变线结构特征时,局限于一次青藏高原试验或者一次与强降水相关的典型个例,难免会造成对切变线结构认识的局限,而且对高原切变线发生、发展过程中不同阶段的结构特征研究也欠全面深入(姚秀萍等,2014;何光碧,2013)。基于此,本研究拟对1981—2016年36 a汛期6—8月的高原横切变线进行客观判识,挑选出高原横切变线典型个例,采用合成分析方法,研究合成后高原横切变线结构及演变特征,拟给出高原横切变线结构和演变的普遍特征,以期对高原横切变线结构特征有普适的、更为完善的认识。
2 资料与方法 2.1 资料选取近年来,再分析资料的运用成为青藏高原研究的基本途径(Tao ,et al,2006;Min ,et al,2013;Li ,et al,2013)。根据对不同再分析资料在青藏高原上运用的评价(刘超等,2015),文中选用欧洲中期天气预报中心(ECMWF)提供的Re-Analysis Interim data (ERA-Interim)(Dee,et al,2011)再分析资料,即1981—2016年6—8月逐日6 h间隔(每天4次),分辨率为1°×1°的资料,垂直方向27层。
2.2 高原横切变线的客观识别标准与方法高原切变线通常是指500 hPa等压面上3站以上风向对吹的辐合线,长度大于5个经/纬度,地面24 h的变温、变压很小(青藏高原气象科学研究拉萨会战组,1981)。在平均流场上高原横切变线是唯一能够清楚表现出来的青藏高原低值系统(徐国昌,1984)。
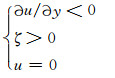
参考马嘉理等(2015)对切变线的客观判识技术,采用Zhang等(2016)对高原横切变线的客观判识方法,用纬向风的经向切变、相对涡度和纬向0风速线等3个参数来确定,即
|
(1) |
式中,u为纬向风速,
选取进行合成的高原横切变线个例的依据如下:(1)根据高原横切变线的位置判断,选取位于青藏高原主体(33°—35°N,80°—105°E)内的高原横切变线个例时次。(2)根据高原横切变线所处风场结构判断,选取切变线个例风场基本一致,即切变线北侧以偏东风为主,南侧以偏西风为主,切变线处于气旋性环流中的个例时次。(3)关注高原横切变线对青藏高原上降水影响程度,参考Zhang等(2016)对高原上横切变线附近出现暴雨的站点数的研究结果。文中选出高原横切变线附近至少5个站点出现暴雨(24 h累计降水量≥25 mm)的个例时次。
满足上述3个条件,从1981—2016年6—8月挑选出1989年6月24日18时、1992年6月23日18时、1992年6月27日18时、1994年6月17日18时、1999年6月24日18时、2010年6月6日18时、2012年6月2日18时、2004年7月22日18时、2007年7月17日18时、2011年7月2日18时、2016年7月5日18时、1993年8月8日18时、1986年8月24日18时共13个高原横切变线个例时次。
采用的合成方法是将所选取出来个例时次的各个物理量进行算术平均,所得资料即为合成资料。
以挑选出的个例时间为基准,并以相对涡度值来表征高原横切变线强度,定义高原横切变线演变过程包括:初始、强盛和减弱3个阶段。将上述个例时间前推8个时次得到的切变线进行合成,合成的高原横切变线为初始阶段的高原横切变线;将上述个例时间后推8个时次得到的切变线进行合成,合成的高原横切变线为减弱阶段的高原横切变线。
基于上述合成方法得到的合成高原横切变线如图 1所示。可以看出,高原横切变线整体呈东西走向,位于80°—100°E,横跨约20个经距(约2000 km),高原横切变线附近为明显的气旋式环流特征。

|
| 图 1 500 hPa高原横切变线风场分布 (a.初始阶段,b.强盛阶段,c.减弱阶段;黑色粗实线为高原横切变线,黑色边界线为海拔3000 m以上青藏高原边界,后图相同) Fig. 1 Distribution of 500 hPa wind field for the MOSL (a. initial phase, b. mature phase, c. weakening phase; The black bold line indicates the MOSL, and the black circle denotes the Tibetan Plateau, the same hereafter) |
在高原横切变线演变过程中,其南、北两侧的风场有明显差异,初始阶段(图 1a),高原横切变线西段(90°E以西),其北侧为偏东风,南侧为偏西风;高原横切变线东段(90°E以东),其北侧为东南风,南侧为西南风。强盛阶段(图 1b),高原横切变线西段,其北侧为东北风,南侧为西北风;高原横切变线东段,其北侧为东风,南侧为西南风,与初始阶段相比,切变线南北两侧风场强度明显加强,切变线所处的气旋式环流也更为显著。减弱阶段(图 1c),高原横切变线南、北两侧风速已显著减小。
3 基本环流特征 3.1 500 hPa形势特征500 hPa高度场和温度场(图 2)上,高原横切变线演变过程中,其东、西两侧分别为带状分布的西太平洋副热带高压(西太副高)和伊朗高压,具有鞍型场分布特征。温度场上,高原横切变线位于272 K等温线附近,即0℃线附近,暖中心北侧的暖区中。切变线北侧温度梯度较大。

|
| 图 2 500 hPa位势高度场和温度场分布 (a.初始阶段,b.强盛阶段,c.减弱阶段;黑色粗实线为高原横切变线,黑色细实线为位势高度(单位:dagpm),黑色虚线为温度(单位:K)) Fig. 2 Geopotential height and temperature distributions 500 hPa (a. initial phase, b. mature phase, c. weakening phase; the black bold line indicates the MOSL, the black thin contour line indicates geopotential height (unit: dagpm), the black dotted lines indicates temperature (unit: K)) |
初始阶段(图 2a),高原横切变线北侧中高纬度环流呈现两槽两脊的形势,西太副高588 dagpm等高线西脊点位于160°E附近,脊线位于25°N附近,切变线形成于(30°—40°N,80°—100°E),温度槽、脊均超前于高度场槽、脊,切变线位于槽前脊后控制区南侧。强盛阶段(图 2b),588 dagpm等高线西脊点西伸至140°E附近。减弱阶段(图 2c),588 dagpm等高线西脊点进一步西伸到135°E附近,环流调整为多波动的形势。整个演变过程中,伊朗高压强度不变,位置稳定在60°E附近。
由此可见,500 hPa东北半球两槽两脊的环流形势为高原横切变线存在提供有利环流背景,高原横切变线位于0℃线附近的暖中心北侧,演变过程中伴随着西太副高西移过程,伊朗高压相对稳定。
3.2 100 hPa形势特征从100 hPa位势高度场(图 3)上可以看到,青藏高原上空盘踞着巨大的南亚高压,高压脊线始终维持在30°N附近,高原横切变线始终位于南亚高压中心的东北位相、东西向脊线的东北侧。初始阶段(图 3a),高原横切变线北侧为两个高空脊,切变线位于两脊区之间槽区低层的南侧。高原横切变线从初始(图 3a)至减弱(图 3c)阶段,南亚高压主体(1672 dagpm等高线范围)及其东北位相的高空槽脊均向东移动,高空槽强度有所减弱。结合500 hPa上西太副高的变化,南亚高压和西太副高两者之间有“相向而行”变化特征。

|
| 图 3 100 hPa位势高度场 (a.初始阶段,b.强盛阶段,c.减弱阶段;黑色粗实线为高原横切变线,黑色细实线为位势高度(单位:dagpm)) Fig. 3 Geopotential height distribution at 100 hPa (a. initial phase, b. mature phase, c. weakening phase; the black bold line indicates the MOSL, the black thin contour lines indicate geopotential height (unit: dagpm)) |
从500 hPa高原横切变线位置演变(图 4a)可以看出,切变线位于80°—100°E,呈准东西向分布。从初始、强盛到减弱阶段,切变线南压且向东西方向伸展,以切变线西段85°—92°E附近南移最为明显。强盛阶段东西跨度最大,切变线最为平直。在强盛阶段和减弱阶段,高原横切变线西段出现断裂。

|
| 图 4 高原横切变线位置的空间演变结构 (a.500 hPa,虚线为初始阶段,实线为强盛阶段,长短线为减弱阶段,黑色边界线为海拔3000 m以上青藏高原边界;b.沿90°E垂直剖面) Fig. 4 Spatial evolution of the position of MOSL (a.500 hPa, the dotted line indicates the initial phase, the solid line indicates the mature phase, the long-short-dashed line indicates the weakening phase, the black circle denotes the Tibetan Plateau; b. Vertical cross section along 90°E) |
从图 4b给出的高原横切变线沿90°E的垂直剖面演变可以发现,高原横切变线在青藏高原上可以伸展至480 hPa,垂直厚度达到120 hPa(约1675 m)。垂直方向上切变线存在明显的北倾特征,从600 hPa的31°N附近北倾至35°N。从高原横切变线演变来看,550 hPa以上的上层,3个阶段南移特征明显;600—550 hPa的下层,经历先北抬、而后又南移的移动过程。高原横切变线随高度北倾的特征,以减弱阶段最为明显,强盛阶段最弱。
5 高原横切变线动力结构特征 5.1 水平动力结构特征500 hPa涡度场(图 5)上,高原横切变线位于正涡度带内,并穿过正涡度中心。初始阶段(图 5a)存在两个最大涡度中心,分别位于84°E和89°E附近,强度为5×10⁻⁵ s-1。强盛阶段(图 5b)伴随着高原横切变线东西伸展跨度的增大,正涡度范围增大、强度增强,其南北跨度约5个纬距,东西跨度约22个经距,正涡度中心演变为一个,位于92°E附近,强度达到8×10⁻⁵ s-1。减弱阶段(图 5c)正涡度区范围和强度均迅速减小,已不存在明显的正涡度中心。

|
| 图 5 500 hPa涡度分布 (a.初始阶段,b.强盛阶段,c.减弱阶段;黑色粗实线为高原横切变线,阴影区为涡度正值(单位:10-5 s-1), 橘黄色线为海拔3000 m以上青藏高原边界) Fig. 5 Vorticity distribution of 500 hPa (a. initial phase, b.mature phase, c. weakening phase; the black bold line indicates MOSL, shaded area indicates positive vorticity (unit: 10-5 s-1), the orange line denotes the Tibetan Plateau) |
500 hPa散度场(图 6)上,高原横切变线位于无辐散区附近。强辐合带呈西北—东南走向,位于80°—100°E。初始阶段(图 6a)强辐合带的辐合区中心位于高原横切变线西段南侧,强度为-2×10⁻⁵s-1;高原横切变线发展过程中,辐合区中心向东扩展、增强(图 6b),强度达到-3×10⁻⁵ s-1,并且在青藏高原东部形成一个新的辐合中心;随后辐合区中心断裂为3个小的区域,强度减弱至-2×10⁻⁵ s-1(图 6c)。

高原横切变线处于强上升运动中,且以切变线南侧的上升运动最为明显(图 7)。初始阶段(图 7a),高原横切变线西段南侧(31°—35°N,80°—87°E)存在强的上升运动区,中心强度为24×10-2 Pa/s;强盛阶段(图 7b),高原横切变线东段出现强度更强范围更广的上升运动区,中心强度达到30×10-2 Pa/s;减弱阶段(图 7c),高原横切变线附近的上升运动强度迅速减弱至12×10-2 Pa/s,切变线上东西两段已不存在明显上升运动区。

由此可见,高原横切变线附近为正涡度带,切变线走向与正涡度带轴线基本一致,强盛阶段正涡度带范围明显变大,强度变强。高原横切变线位于无辐散区附近;高原横切变线上以上升运动为主,尤以南侧上升运动最强,强盛阶段高原横切变线东西两段附近存在强烈上升运动区。
5.2 垂直动力结构特征图 8给出了涡度场沿90°E的垂直剖面演变。6—8月,由于地面的加热作用,青藏高原整体以上升运动为主,上升运动伸展至200 hPa左右。高原横切变线走向与正涡度带轴线基本一致,随高度向北倾斜,正涡度带伸展高度高于切变线伸展高度,达到350 hPa,相对而言,切变线在垂直方向上为浅薄系统,并具有一定的斜压性,正涡度中心位于切变线特征层次500 hPa上。

|
| 图 8 沿90°E涡度和垂直速度垂直剖面 (a.初始阶段,b.强盛阶段,c.减弱阶段;黑色粗实线为高原横切变线,黑色细等值线为垂直速度(单位:10-2 Pa/s),色阶为涡度正值(单位:10-5 s-1),灰色阴影为青藏高原) Fig. 8 Meridional-vertical cross sections of vorticity and vertical velocity along 90°E (a. initial phase, b. mature phase, c. weakening phase; the black bold line indicates MOSL, the black thin contour line indicates vertical velocity (unit: 10-2 Pa/s), areas shaded in red indicates positive vorticity (unit: 10-5 s-1), areas shaded in gray indicate the Tibetan Plateau) |
初始阶段(图 8a),高原横切变线附近南北两侧存在两个上升运动大值区,中心分别位于33°N和35°N附近;强盛阶段(图 8b),切变线南侧上升运动中心南移至32°N,北侧上升运动中心位置稳定不动,强度分别为16×10-2和12×10-2 Pa/s,正涡度带强度也出现显著增强,中心值由4×10-5增强到6×10-5 s-1;减弱阶段(图 8c),正涡度带强度迅速减弱,正涡度中心消失,上升运动强度有所减弱。此外,高原横切变线演变过程中,正涡度中心南移。
图 9给出的是散度场沿90°E的垂直剖面演变,高原横切变线附近为经向分布的带状辐合带,二者伸展高度相当,辐合中心位于550 hPa左右。600—100 hPa,散度场大致呈现辐合—辐散—辐合的分布特征。

初始阶段(图 9a),高原横切变线附近南北两侧存在两个辐合中心,分别位于33°N和35°N附近,中心强度均为-1.8×10⁻⁵ s-1;强盛阶段(图 9b),位于切变线南侧的辐合中心移至32°N,强度不变,北侧辐合中心位置稳定不动,但强度增强至-2.4×10⁻⁵ s-1;减弱阶段(图 9c),切变线附近的辐合带强度迅速减小。
由此可见,垂直方向上,高原横切变线附近有正涡度带和辐合带,正涡度带伸展高度高于辐合带伸展高度,切变线与正涡度带随高度向北倾斜,并完全位于上升运动中,切变线南北两侧伴随有辐合中心。强盛阶段,正涡度带和辐合带强度为最强。伴随高原横切变线南压过程,正涡度中心南移。
6 高原横切变线热力结构特征 6.1 水平热力结构特征温度偏差的定义为,将500 hPa温度减去高原横切变线东西向的主体区域(87°—93°E)相同层次的温度区域平均值。500 hPa温度偏差分布(图 10)上,高原横切变线主体位于相对暖区,其东西两侧为冷区控制,西侧冷区沿着青藏高原南缘边界向东伸展。初始阶段(图 10a)和强盛阶段(图 10b),切变线东侧的冷区维持在95°E以东,减弱阶段(图 10c),冷区向西扩展,冷空气侵入至切变线东段。

|
| 图 10 500 hPa温度偏差分布 (a.初始阶段,b.强盛阶段,c.减弱阶段;黑色粗实线为高原横切变线,黑色细等值线为温度偏差(单位:K)) Fig. 10 Spatial pattern of temperature deviation at 500 hPa (a. initial phase, b. mature phase, c. weakening phase; the black bold line indicates MOSL, the black thin contour lines indicates temperature deviation (unit: K)) |
为了探究水汽和温度对高原横切变线的共同作用,引入假相当位温,500 hPa假相当位温场(图 11)上,高原横切变线处于假相当位温大值中心北侧的相对暖湿区,西南气流对暖湿空气的输送使得切变线南侧为明显暖湿区,尤以切变线东段南侧最明显。强盛阶段(图 11b),高原横切变线附近等假相当位温线十分密集,切变线北侧(35°—36°N),假相当位温梯度较大,说明此处存在锋区。

|
| 图 11 500 hPa假相当位温和风场分布 (a.初始阶段,b.强盛阶段,c.减弱阶段;黑色粗实线为高原横切变线,黑色细等值线为假相当位温(单位:K)) Fig. 11 Pseudo-equivalent potential temperature and wind field at 500 Pa (a. initial phase, b. mature phase, c. weakening phase; the bold line indicates MOSL, the black thin contour lines indicate pseudo-equivalent potential temperature (unit: K)) |
为进一步揭示高原横切变线随高度变化的热力结构特征,利用温度偏差和假相当位温的垂直剖面来分析。
温度偏差的定义为,将各层温度减去高原横切变线东西向的主体区域(87°—93°E)相同层次的温度区域平均值。图 12给出温度偏差的垂直剖面演变。初始阶段(图 12a),高原横切变线附近(32°—35°N)为正温度偏差密集带,表现为暖区,垂直方向伸展至300 hPa左右,因此高原横切变线整体位于暖区内,正温度偏差中心最大值为0.3 K,位于切变线南侧33°N附近,正温度偏差带随高度存在北倾特征;强盛阶段(图 12b),高原横切变线附近的正温度偏差区范围为31°—36°N,范围有所增大,中心最大值北移至35°N附近,强度达到0.5 K,说明高原横切变线附近的暖区强度有所增强;减弱阶段(图 12c),高原横切变线附近的正温度偏差区范围迅速减小并南退,垂直伸展高度下降至切变线特征高度500 hPa以下,在切变线附近34°N出现负温度偏差,说明冷空气侵入切变线北段,此时高原横切变线南段位于暖区,北段位于冷区。

|
| 图 12 沿90°E温度偏差垂直剖面 (a.初始阶段,b.强盛阶段,c.减弱阶段;黑色粗实线为高原横切变线,黑色细等值线为温度偏差(单位:K),黑色阴影为青藏高原) Fig. 12 Meridional-vertical cross sections of temperature deviation along 90°E (a. initial phase, b. mature phase, c. weakening phase; the black bold line indicates MOSL, the black thin contour lines indicate temperature deviation (unit: K), black shaded area indicate the Tibetan Plateau) |
由此可见,高原横切变线整体位于暖区。正温度偏差带范围变大、中心最大值变大时,切变线变强;冷空气的侵入会使高原横切变线上的上升运动减弱,从而使其强度减弱。
图 13给出假相当位温和环流沿90°E的垂直剖面演变情况,假相当位温的垂直分布可以反映大气的稳定程度(张雅斌等,2016;罗雄等,2018)。

|
| 图 13 沿90°E假相当位温和环流(v×(-100ω))垂直剖面 (a.初始阶段,b.强盛阶段,c.减弱阶段;黑色粗实线为高原横切变线,黑色细等值线为假相当位温(单位:K),黑色阴影为青藏高原) Fig. 13 Meridional-vertical cross sections of Pseudo-equivalent potential temperature and circulation (v×(-100ω)) along 90°E (a. initial phase, b. mature phase, c. weakening phase; the black dold line indicates MOSL, the black thin contour lines indicate pseudo-equivalent potential temperature (unit: K), black shaded areas indicate the Tibetan Plateau) |
高原横切变线上空400 hPa以上假相当位温随气压降低而升高,说明切变线上空大气层结稳定。高原横切变线上以上升运动为主,300 hPa以上转为偏西风。初始(图 13a)和强盛(图 13b)阶段,600—500 hPa高度上,在高原横切变线的南侧有一个假相当位温>354 K的高温、高湿不稳定区,向北伸展至34°N附近,因此,切变线南侧大气层结整体表现为低层不稳定,高层稳定的分布特征。减弱阶段(图 13c),该不稳定区向南收缩,退至32°N以南。高原横切变线在演变发展过程中,一部分位于相对高温、高湿区,另一部分北倾深入北侧相对干冷区,以减弱阶段深入北侧干冷区域的情况最为明显。由此可见,干冷空气的侵入会使高原横切变线强度减弱甚至使其消亡。34°N以北是假相当位温线密集区,以强盛阶段最为密集,假相当位温线近乎于陡立,结合前面对假相当位温水平分布特征可知,该处是锋区所在,高原切变线伴随发生的暴雨降水过程可能出现在这里。
6.3 水汽通量散度垂直结构特征研究表明,高原切变线与水汽之间存在重要联系(李山山等,2017;罗雄等,2018),为了进一步探究高原横切变线演变过程中的水汽特征,引入水汽通量散度。
水汽通量散度的垂直剖面演变(图 14)上,高原横切变线附近为水汽辐合带,表明高原横切变线上有较强的水汽汇聚,水汽辐合带的伸展高度与切变线伸展高度相当,水汽辐合中心位于550 hPa左右。初始阶段(图 14a),33°N和35°N附近各存在一个中心强度为-1.2×10⁻⁵ g/(s·cm2·hPa)的水汽辐合中心;强盛阶段(图 14b),高原横切变线附近的水汽辐合带强度增强,32°N附近的水汽辐合中心强度达到-1.6×10⁻⁵ g/(s·cm2·hPa),说明在高原横切变线达到强盛阶段时,水汽也进一步向切变线处汇聚;减弱阶段(图 14c),高原横切变线附近的水汽辐合有所减弱。

|
| 图 14 沿90°E水汽通量散度垂直剖面 (a.初始阶段,b.强盛阶段,c.减弱阶段;黑色粗实线为高原横切变线,色阶为水汽通量散度负值(单位:10-5 g/(s·cm2·hPa)),灰色阴影为青藏高原) Fig. 14 Meridional-vertical cross sections of water vapor flux divergence along 90°E (a. initial phase, b. mature phase, c. weakening phase; the black dold line indicates MOSL, blue shaded areas indicate negative vapor flux divergence (unit: 10-5 g/(s·cm2·hPa)), areas shaded in gray indicate the Tibetan Plateau) |
由此可见,高原横切变线为水汽汇聚带,高原横切变线达到强盛阶段时,水汽辐合最强。
7 结论与讨论利用ECMWF逐日4次,分辨率为1°×1°的ERA-Interim再分析资料,选取1981—2016年6—8月中的13个高原横切变线个例进行合成分析,揭示了高原横切变线动力、热力结构特征及其在初始、强盛和减弱3个阶段演变发展过程中的特征,得到的主要结论如下:
(1) 高原横切变线呈准东西向分布,长度近2000 km,垂直方向可伸展至480 hPa附近,厚度接近2 km;高原横切变线为高原上浅薄的天气系统,具有一定的斜压性,并随高度升高向北倾斜。
(2) 500 hPa上北半球两槽两脊的环流形势为高原横切变线的发生和维持提供了背景条件。高原横切变线东、西两侧分别为西太副高和伊朗高压,位于高层南亚高压东西脊线的东北侧。高原横切变线演变过程中,青藏高原上空始终盘踞着南亚高压,并伴随西太副高的西移过程。
(3) 高原横切变线附近有正涡度带,高原横切变线走向与正涡度带轴线基本一致,并位于无辐散区附近,垂直方向上正涡度带伸展至350 hPa,辐合带伸展至400 hPa;切变线上以上升运动为主,其南侧为上升运动大值区,垂直方向上上升运动可伸展至200 hPa左右。
(4) 高原横切变线在演变过程中,其动力和热力结构呈现不同特征。高原横切变线附近的正涡度带强度、辐合带强度以及上升运动强度以强盛阶段为最强,初始阶段次之,减弱阶段最弱。正涡度中心和辐合中心分别位于500和550 hPa,中心强度以强盛阶段为最强,初始阶段次之,减弱阶段为最弱。
(5) 高原横切变线整体位于暖区,是明显的水汽汇聚带。切变线北侧存在锋区结构,锋区强度以强盛阶段为最强。冷暖空气势力强弱影响高原横切变线的强度,干冷空气的侵入会导致切变线强度减小甚至消亡。
通过合成分析,初步得到了高原横切变线结构上的普遍特征,研究结果有利于完善对高原横切变线的认识。本研究选取的高原横切变线个例都为青藏高原夏季时节,这正是青藏高原非绝热加热作用最强的季节,因此在这个过程中青藏高原非绝热加热作用对于高原横切变线结构特征及演变发展的影响机制是值得今后进一步探究的内容。此外,所得结论是基于特定一类的13个高原横切变线个例合成分析的结果,对于其他类型的高原横切变线的结构特征还需日后进一步探讨。
鲍玉章. 1990. 西藏高原切变线云系中雨以上降水的卫星云图分析. 成都气象学院学报, 4(4): 15-19. Bao Y Z. 1990. The analysis of satellite cloud chart for medium precipitation of shear line cloud system over the Tibetan Plateau. J Chengdu Inst Meteor, 4: 15-19. (in Chinese) |
邓远平, 程麟生, 张小玲. 2000. 三相云显式降水方案和高原东部"96.1"暴雪成因的中尺度数值模拟. 高原气象, 19(4): 401-414. Deng Y P, Cheng L S, Zhang X L. 2000. Three-phase cloud explicitey precipitation scheme and mesoscale numerical simulation for generated cause of the "96.1" snowstorm. Plateau Meteor, 19(4): 401-414. (in Chinese) |
何光碧, 高文良, 屠妮妮. 2009. 2000-2007年夏季青藏高原低涡切变线观测事实分析. 高原气象, 28(3): 549-555. He G B, Gao W L, Tu N N. 2009. The observational analysis of shear line and low vortex over the Tibetan Plateau in summer from 2000 to 2007. Plateau Meteor, 28(3): 549-555. (in Chinese) |
何光碧, 师锐. 2011. 夏季青藏高原不同类型切变线的动力、热力特征分析. 高原气象, 30(3): 568-575. He G B, Shi R. 2011. Studies on dynamic and thermal characteristics of different shear lines over Tibetan Plateau in summer. Plateau Meteor, 30(3): 568-575. (in Chinese) |
何光碧. 2013. 高原切变线研究回顾. 高原山地气象研究, 33(1): 90-96. He G B. 2013. Review of the Plateau shear-line studies. Plateau Mountain Meteor Res, 33(1): 90-96. DOI:10.3969/j.issn.1674-2184.2013.01.016 (in Chinese) |
李国平. 2002. 青藏高原动力气象学. 北京: 气象出版社, 251pp. Li G P. 2002. The Dynamic Meteorology Study of Tibetan Plateau. Beijing: China Meteorological Press, 251. (in Chinese)
|
李国平, 卢会国, 黄楚惠, 等. 2016. 青藏高原夏季地面热源的气候特征及其对高原低涡生成的影响. 大气科学, 40(1): 131-141. Li G P, Lu H G, Huang C H, et al. 2016. A climatology of the surface heat source on the Tibetan Plateau in summer and its impacts on the formation of the Tibetan Plateau vortex. Chinese J Atmos Sci, 40(1): 131-141. (in Chinese) |
李山山, 李国平. 2017. 一次鞍型场环流背景下高原东部切变线降水的湿Q矢量诊断分析. 高原气象, 36(2): 317-329. Li S S, Li G P. 2017. Diagnostic analysis based on wet Q-vector of a shear line with rain on the east side of Qinghai-Tibetan Plateau under the saddle pattern circulation background field. Plateau Meteor, 36(2): 317-329. (in Chinese) |
刘超, 刘屹岷, 刘伯奇. 2015. 6种地表热通量资料在伊朗-青藏高原地区的对比分析. 气象科学, 35(4): 398-404. Liu C, Liu Y M, Liu B Q. 2015. Comparison of six sensible heat flux datasets over the Iranian-Tibetan Plateaus. J Meteor Sci, 35(4): 398-404. (in Chinese) |
刘富明, 潘平山. 1987. 青藏高原横切变线南移的研究. 高原气象, 6(1): 56-64. Liu F M, Pan P S. 1987. A study on the moving southward of shear line with quasi E-W orientation over Qinghai-Xizang Plateau. Plateau Meteor, 6(1): 56-64. (in Chinese) |
罗四维. 1963. 冬季我国高原东侧切变线形成的分析. 气象学报, 33(3): 305-319. Luo S W. 1963. Formation analysis of shear line over the eastern Plateau in winter. Acta Meteor Sinica, 33(3): 305-319. (in Chinese) |
罗雄, 李国平. 2018. 一次高原切变线过程的数值模拟与阶段性结构特征. 高原气象, 37(2): 406-419. Luo X, Li G P. 2018. Numerical simulation and stage structure characteristics of a plateau shear line process. Plateau Meteor, 37(2): 406-419. (in Chinese) |
吕君宁, 黄福均. 1984. 青藏高原天气尺度系统的分析研究. 气象, (5): 2-4. Lv J N, Huang F J. 1984. Analysis and research on the weather scale system of Qinghai-Tibet Plateau. Mon, (5): 2-4. (in Chinese) |
马嘉理, 姚秀萍. 2015. 1981-2013年6-7月江淮地区切变线及暴雨统计分析. 气象学报, 73(5): 883-894. Ma J L, Yao X P. 2015. Statistical analysis of the shear lines and torrential rains over the Yangtze-Huaihe river region during June-July in 1981-2013. Acta Meteor Sinica, 73(5): 883-894. (in Chinese) |
马林, 张青梅, 赵春宁, 等. 2003. 青藏高原东部牧区春季雪灾天气的形成及其预报. 自然灾害学报, 12(3): 61-68. Ma L, Zhang Q M, Zhao C N, et al. 2003. Formation and forecast of spring snow-disaster weather in the eastern pasture-area of Qinghai-Xizang Plateau. J Nat Disast, 12(3): 61-68. DOI:10.3969/j.issn.1004-4574.2003.03.010 (in Chinese) |
乔全明, 谭海清. 1984. 夏季青藏高原500毫巴切变线的结构与大尺度环流. 高原气象, 3(3): 50-57. Qiao Q M, Tan H Q. 1984. The structure of 500 mb shear line and large scale circulation over Qingzang Plateau in summer. Plateau Meteor, 3(3): 50-57. (in Chinese) |
青藏高原气象科学研究拉萨会战组. 1981. 夏半年青藏高原500毫巴低涡切变线的研究. 北京: 科学出版社. Lhasa Battle Group of Meteorological Sciences on the Qinghai-Tibet Plateau. 1981. Study on 500 mb Low Vortex Shear Line of Tibet Plateau. Beijing: Science Press. (in Chinese)
|
陶诗言, 罗四维, 张鸿村. 1984. 1979年5-8月青藏高原气象科学实验及其观测系统. 气象, (7): 2-5. Tao S Y, Luo S W, Zhang H C. 1984. The meteorological science experiment and observation system of the Qinghai-Tibet Plateau in May-August. Meteor Mon, (7): 2-5. (in Chinese) |
王宇虹, 徐国强. 2017. 青藏高原地形重力波拖曳的初步分析及数值模拟研究. 气象学报, 75(2): 275-287. Wang Y H, Xu G Q. 2017. Preliminary analysis of the gravity wave drag on Qinghai-Tibet Plateau and its numerical simulation. Acta Meteor Sinica, 75(2): 275-287. (in Chinese) |
吴国雄, 毛江玉, 段安民, 等. 2004. 青藏高原影响亚洲夏季气候研究的最新进展. 气象学报, 62(5): 528-540. Wu G X, Mao J Y, Duan A M, et al. 2004. Recent progress in the study on the impacts of Tibetan Plateau on Asian summer climate. Acta Meteor Sinica, 62(5): 528-540. DOI:10.3321/j.issn:0577-6619.2004.05.002 (in Chinese) |
徐国昌. 1984. 500毫巴高原切变线的天气气候特征. 高原气象, 3(1): 36-41. Xu G C. 1984. The climatologically synoptic characteristics of the shear line on the 500 mb surface over the Qinghai-Xizang Plateau. Plateau Meteor, 3(1): 36-41. (in Chinese) |
徐建芬, 陶健红, 夏建平. 2000. 青藏高原切变线暴雪中尺度分析及其涡源研究. 高原气象, 19(2): 187-197. Xu J F, Tao J H, Xia J P. 2000. A meso-scale analysis of Qinghai-Xizang Plateau snow storm and its vortex source study. Plateau Meteor, 19(2): 187-197. DOI:10.3321/j.issn:1000-0534.2000.02.008 (in Chinese) |
薛智. 1980. 青藏高原暴雨切变线特征个例分析. 气象学报, 38(2): 142-149. Xue Z. 1980. A case study of a shear line producing heavy rainfall on Qinghai-Xizang Plateau. Acta Meteor Sinica, 38(2): 142-149. (in Chinese) |
姚秀萍, 孙建元, 康岚, 等. 2014. 高原切变线研究的若干进展. 高原气象, 33(1): 294-300. Yao X P, Sun J Y, Kang L, et al. 2014. Advances on research of shear convergence line over Qinghai-Xizang Plateau. Plateau Meteor, 33(1): 294-300. (in Chinese) |
叶笃正, 罗四维, 朱抱真. 1957. 西藏高原及其附近的流场结构和对流层大气的热量平衡. 气象学报, 28(2): 108-121. Ye D Z, Luo S W, Zhu B Z. 1957. The wind structure and heat balance in the lower troposphere over Tibetan Plateau and its surrounding. Acta Meteor Sinica, 28(2): 108-121. (in Chinese) |
叶笃正, 高由禧, 陈乾. 1977. 青藏高原及其紧邻地区夏季环流的若干特征. 大气科学, 1(4): 289-299. Ye D Z, Gao Y X, Chen Q. 1977. On some features of the summer atmospheric circulation over the Tsinghai-Tibetan Plateau and its neighbourhood. Chinese J Atmos Sci, 1(4): 289-299. DOI:10.3878/j.issn.1006-9895.1977.04.06 (in Chinese) |
叶笃正, 高由禧. 1979. 青藏高原气象学. 北京: 科学出版社. Ye D Z, Gao Y X. 1979. Meteorology of the Qinghai-Xizang Plateau. Beijing: Science Press. (in Chinese)
|
郁淑华, 高文良, 顾清源. 2007. 近年来影响我国东部洪涝的高原东移涡环流场特征分析. 高原气象, 26(3): 466-475. Yu S H, Gao W L, Gu Q Y. 2007. The middle-upper circulation analyses of the Plateau vortex moving out of Plateau and influencing flood in East China in recent years. Plateau Meteor, 26(3): 466-475. DOI:10.3321/j.issn:1000-0534.2007.03.005 (in Chinese) |
郁淑华, 高文良, 彭骏. 2013. 近13年青藏高原切变线活动及其对中国降水影响的若干统计. 高原气象, 32(6): 1527-1537. Yu S H, Gao W L, Peng J. 2013. Statistical analysis of shear line activity in QXP and its influence on rainfall in China in recent 13 years. Plateau Meteor, 32(6): 1527-1537. (in Chinese) |
张雅斌, 马晓华, 冉令坤, 等. 2016. 关中地区两次初夏区域性暴雨过程特征分析. 高原气象, 35(3): 708-725. Zhang Y B, Ma X H, Ran L K, et al. 2016. Characteristic analysis on two regional rainstorms at Guanzhong in early summer. Plateau Meteor, 35(3): 708-725. (in Chinese) |
朱乾根, 林锦瑞, 寿绍文, 等. 2000. 天气学原理和方法. 4版. 北京: 气象出版社, 368. Zhu Q G, Lin J R, Shou S W, et al. 2000. The Principles and Methods of Weather. 4th ed. Beijing: China Meteorological Press, 368. (in Chinese)
|
Broccoli A J, Manabe S. 1992. The effects of orography on midlatitude northern hemisphere dry climates. J Climate, 5(11): 1181-1201. DOI:10.1175/1520-0442(1992)005<1181:TEOOOM>2.0.CO;2 |
Dee D P, Uppala S M, Simmons A J, et al. 2011. The ERA-interim reanalysis:Configuration and performance of the data assimilation system. Quart J Roy Meteor Soc, 137(656): 553-597. DOI:10.1002/qj.828 |
Duan A M, Wu G X. 2005. Role of the Tibetan Plateau thermal forcing in the summer climate patterns over subtropical Asia. Climate Dyn, 24(7-8): 793-807. DOI:10.1007/s00382-004-0488-8 |
Flohn H. 1957. Large-scale aspects of the "summer monsoon" in South and East Asia. J Meteor Soc Japan, 35A: 180-186. DOI:10.2151/jmsj1923.35A.0_180 |
Li R, Min Q, Wu X, et al. 2013. Retrieving latent heating vertical structure from cloud and precipitation profiles. Part Ⅱ:Deep convective and stratiform rain processes. J Quant Spectrosc Radiat Transfer, 122: 47-63. DOI:10.1016/j.jqsrt.2012.11.029 |
Li Y D, Wang Y, Song Y, et al. 2008. Characteristics of summer convective systems initiated over the Tibetan Plateau. Part Ⅰ:Origin, track, development, and precipitation. J Appl Meteor Clim, 47(10): 2679-2694. |
Liou K N, Chou H C. 1987. Atmospheric radiation: Progress and prospects//Proceedings of the Beijing International Radiation Symposium, Beijing, China, August 26-30, 1986. Science Press, 699pp
|
Min Q L, Li R, Wu X Q, et al. 2013. Retrieving latent heating vertical structure from cloud and precipitation profiles. Part Ⅰ:Warm rain processes. J Quant Spectrosc Radiat Transfer, 122: 31-46. DOI:10.1016/j.jqsrt.2012.11.030 |
Murakami T. 1958. The sudden change of upper westerlies near the Tibetan Plateau at the beginning of summer season. J Meteor Soc Japan, 36(6): 239-247. DOI:10.2151/jmsj1923.36.6_239 |
Shen R, Reiter E R, Bresch J F. 1986. Numerical simulation of the development of vortices over the Qinghai-Xizang (Tibet) Plateau. Meteor Atmos Phys, 35(1-2): 70-95. DOI:10.1007/BF01029526 |
Smith E A, Shi L. 1992. Surface forcing of the infrared cooling profile over the Tibetan Plateau. Part Ⅰ:Influence of relative longwave radiative heating at high altitude. J Atmos Sci, 49(10): 805-822. |
Tanaka K, Ishikawa H, Hayashi T, et al. 2001. Surface energy budget at Amdo on the Tibetan Plateau using GAME/Tibet IOP98 data. J Meteor Soc Japan, 79(1B): 505-517. DOI:10.2151/jmsj.79.505 |
Tao W K, Smith E A, Adler R F, et al. 2006. Retrieval of latent heating from TRMM measurements. Bull Amer Meteor Soc, 87(11): 1555-1572. DOI:10.1175/BAMS-87-11-1555 |
Ueda H, Kamahori H, Yamazaki N. 2003. Seasonal contrasting features of heat and moisture budgets between the eastern and western Tibetan Plateau during the GAME IOP. J Climate, 16(14): 2309-2324. DOI:10.1175/2757.1 |
Wu G X. 1984. The nonlinear response of the atmosphere to large-scale mechanical and thermal forcing. J Atmos Sci, 41(16): 2456-2476. DOI:10.1175/1520-0469(1984)041<2456:TNROTA>2.0.CO;2 |
Wu G X, Liu Y M, Zhang Q, et al. 2007. The influence of mechanical and thermal forcing by the Tibetan Plateau on Asian Climate. J Hydrometeorol, 8(4): 770-789. DOI:10.1175/JHM609.1 |
Yanai M, Li C F, Song Z S. 1992. Seasonal heating of the Tibetan Plateau and its effects on the evolution of the Asian summer monsoon. J Meteor Soc Japan, 70(1B): 319-351. DOI:10.2151/jmsj1965.70.1B_319 |
Ye D Z. 1981. Some characteristics of the summer circulation over the Qinghai-Xizang (Tibet) Plateau and its neighborhood. Bull Amer Meteor Soc, 62(1): 14-19. DOI:10.1175/1520-0477(1981)062<0014:SCOTSC>2.0.CO;2 |
Yin M T. 1949. Synoptic-aerologic study of the onset of the summer monsoon over India and Burma. J Meteor, 6(6): 393-400. DOI:10.1175/1520-0469(1949)006<0393:SASOTO>2.0.CO;2 |
Zhang X, Yao X P, Ma J L, et al. 2016. Climatology of transverse shear lines related to heavy rainfall over the Tibetan Plateau during boreal summer. J Meteor Res, 30(6): 915-926. DOI:10.1007/s13351-016-6952-7 |
Zhao Y C. 2015. A study on the heavy-rain-producing mesoscale convective system associated with diurnal variation of radiation and topography in the eastern slope of the western Sichuan plateau. Meteor Atmos Phys, 127(2): 123-146. DOI:10.1007/s00703-014-0356-y |