中国气象学会主办。
文章信息
- 徐珺, 毕宝贵, 谌芸, 陈涛, 宫宇, 李嘉睿. 2018.
- XU Jun, BI Baogui, CHEN Yun, CHEN Tao, GONG Yu, LI Jiarui. 2018.
- “5.7”广州局地突发特大暴雨中尺度特征及成因分析
- Mesoscale characteristics and mechanism analysis of the unexpected local torrential rain in Guangzhou on 7 May 2017
- 气象学报, 76(4): 511-524.
- Acta Meteorologica Sinica, 76(4): 511-524.
- http://dx.doi.org/10.11676/qxxb2018.016
-
文章历史
- 2017-08-04 收稿
- 2018-02-14 改回
2. 国家气象中心, 北京, 100081
2. National Meteorological Center of China, Beijing 100081, China
2017年5月7日广州突发特大暴雨过程,00—16时花都东部、增城西部等地多站累计雨量超过300 mm,最大453 mm,增城新塘镇小时雨量184.7 mm为广东省历史第2位,3 h雨量382.6 mm破广东省历史极值。小时雨量大、强降雨持续时间长,广州多地出现城市内涝、山体滑坡、洪水和泥石流等灾害。然而该次过程发生于副热带高压边缘、无明显的低空急流等天气系统配合,为弱强迫背景下的华南前汛期暴雨,加之强降雨集中爆发于广州北部山区,珠江三角洲地形复杂,其触发和组织维持机制等问题引起了气象科研和预报工作者的广泛关注。
目前中国国家级定量降水预报业务对明显强迫系统导致的大范围暴雨过程具有较高的预报能力,而对弱强迫背景下中尺度局地突发极端降水预报能力极为有限,数值天气预报模式也表现出明显的局限性。对直接造成该次极端降水过程的热带中尺度对流系统和热带云团,中外在降水效率(Mohr, et al, 1999; Luo, et al, 2013)、触发和维持(Rotunno, et al, 1988; Weisman, 1992;Leary, et al, 1979; Yanai, et al, 1973; Li, et al, 2006)等方面已有大量可以参考的研究。
强降雨主要集中在珠三角喇叭口地形附近,地形作用明显。如果复杂地形背景下大气是浮力不稳定的,那么大气对地形响应是激发出积雨云,这些积雨云将进一步演化为中尺度对流系统(Houze,2014)。喇叭口地形的辐合作用,不仅地形抬升明显,且易形成偏南风辐合区和中尺度辐合线,影响暖湿气流输送,造成暖湿气流上升、对流云发展,有利于暴雨产生和加强(李真光等,1981;黄士松,1986)。在暖季华南地区存在多个降水中心,其中大部分降水中心与局地地形的抬升和阻挡作用密切相关,在无低空急流日,内陆山区的迎风坡上存在明显的对流发生高频中心(Chen,et al, 2014, 2015; Xu, 2013;Xu,et al, 2012; 孙健等,2002)。华南地区数百米高的山地可造成近地层辐合与上升运动的增强, 引起局地中尺度对流的发展(李博等,2013)。当大范围系统风较弱时,珠三角大气边界层还受海陆风、城市热岛环流和山谷风共同影响(范绍佳等,2006),2015年世界银行发布的《东亚变化中的城市图景:度量十年的空间增长》指出,无论就地域还是人口规模,珠江三角洲地区在2010年就已成为全球最大城市群。对于其中城市热岛对降水的作用目前也有一些可以参考的数值模拟和统计研究(Zhang, et al, 2011;马新野,2014)。
虽然对这种无明显天气系统配合的局地突发特大暴雨可以借鉴的理论研究不少,但目前仅有Wang等(2014)对广东阳江一次无明显低空急流等天气系统配合的中尺度暴雨进行了深入地观测研究,其他深入的个例观测研究非常少,更多侧重对数值模拟和对流统计分析。那么对流如何触发?极端小时雨量和长时间强降水如何形成?本研究拟通过5 min自动气象站、分钟雨量、风廓线雷达、葵花8号气象卫星10 min分辨率增强红外等高时、空分辨率观测以及NCEP分析场数据的天气尺度和中尺度诊断分析,讨论以上问题并总结出概念模型为认识该类暴雨提供参考。
2 降水特点和环境场分析 2.1 降水特点7日00—16时(北京时,下同)强降水先后影响广州、东莞等地,共有89个站雨量超过100 mm(图 1b)。大暴雨主要由3 h左右大于20 mm/h的短时强降水造成,大于20 mm/h的短时强降水占总雨量的79%,大于50 mm/h的占37%(图 1d)。按雨团移动和形状特点分为两阶段:第1阶段(00—09时)雨团中心位置稳定,其中00—04时降水中心位于花都王子山(图 1a、b)南侧,最大小时雨量120 mm,05—09时位于增城和花都,05—07时增城新塘镇小时雨量分别为184.7和150 mm(图 1c,图 1a、b);第2阶段(09—16时)带状雨团快速移经番禺、东莞等地。本研究关注第1阶段降水,其发生于复杂地形地区,局地中尺度对流特征明显。

|
| 图 1 (a) 广东省地形(A:王子山,B:白云山,方框:图 1b区域), (b)5月7日00—16时累积雨量,HD:花都、ZC:增城,GZ:广州市区,PY:番禺(色阶:地形高度;等值线:降雨量,分别为50、100、250、300、400 mm), (c)最大雨量站(折线)、最大小时雨量站(直方图)小时雨量,(d)大于20和50 mm/h的大暴雨降水信息统计(圆点:50 mm/h,菱形:20 mm/h,横轴:总降水时间,纵轴:超过相应阈值小时雨量的降水时间) Figure 1 (a) Topography of Guangdong province (A:Wangzi Moutain, B:Baiyun Moutain. The rectangle indicates the area in Figure 1b). (b) Accumulated precipitation from 00:00 to 16:00 BT 7 May (shaded: terrain height, contours: precipitation of 50, 100, 250, 300, 400 mm respectively). (c) Hourly rainfall variation at the maximum precipitation station (solid line) and maximum hourly precipitation (histogram). (d) Statistics of precipitation and corresponding time periods for hourly precipitation greater than 20 and 50 mm/h (rhombus:>20 mm/h, dot: >50 mm/h. Abscissa: total precipitation duration, ordinate: precipitation duration above the thresholds) |
该次过程无明显天气尺度影响系统如低空急流、锋面等的强迫。7日02时850和700 hPa中国南海北部至广东一带东南偏南风风速仅为4—6 m/s(图 2b)。6日夜间广西中部500 hPa高空短波槽前(图 2a)有低层切变发展东移(图 2b—d),近地层南下冷空气与东南偏南暖湿气流在广东、广西交界至广东北部交汇(图 2c、d),广西南部至广东北部地面为低压倒槽,相应广西、广东交界至广东西部有对流系统发展东移(图 2e)。与此同时,6日夜间江南东部地面高压入海(图 2e),广东南部沿海为中心强度超过12 m/s的偏东风。伴随近地层切变辐合系统的东移,珠三角近地层南风分量7日02时相对6日20时明显加强,地面至925 hPa呈现南风风速辐合(图 2c、d)。广州位于副热带高压边缘,过增城降雨中心的垂直剖面(图 2f)显示对流不稳定仅存在于700 hPa以下,300 hPa以上为下沉气流,且并无明显天气系统强迫,对流不会发展很高。

|
| 图 2 (a) 6日20时500 hPa高度场(实线,单位:dagpm)、风场(方框:暴雨区,黑粗线:槽线), (b)7日02时850 hPa风场、假相当位温场(填色,单位:K, 黑线:切变线), (c)6日20时950 hPa风场、水平风散度(虚线,单位:10-6 s-1,黑实线:切变线), (d)7日02时950 hPa风场、水平风散度(虚线,单位:10-6 s-1,黑实线:切变线), (e)6日20时地面10 m风场、假相当位温(填色)、海平面气压(实线,单位:hPa)和葵花8号气象卫星TBB(Black Body Temperature, 绿虚线), (f)7日02时NCEP分析场过113.5°E剖面假相当位温(填色)和风场(流线)(三角:降水中心纬度) Figure 2 (a) 500 hPa geopotential height (contours, unit: dagpm) and wind field (rectangle: torrential rain area, thick black line: trough line) at 20:00 BT 6 May; (b) 850 hPa wind field and pseudo-equivalent potential temperature (shaded, unit: K. The black line indicates the shear line at 02:00 7 May); (c) 950 hPa convergence (dashed contours, unit:10-6 s-1) and winds at 20:00 6 May (The black solid line indicates the shear line); (d) 950 hPa convergence (dashed contours, unit: 10-6 s-1) and winds at 02:00 7 May (The black solid line shows the shear line); (e) 10 m-surface winds, sea level pressure (contours, unit: hPa), pseudo-equivalent potential temperature (shaded) and Himawari 8 TBB (green dotted lines) at 20:00 6 May; (f) cross-section of pseudo-equivalent potential temperature (shaded) and winds (streamlines) along 113.5°E (triangle: the latitude of rain center) |
6日20时和7日02时清远探空表明对流有效位能达到714和529 J/kg,抬升凝结高度均在925 hPa附近、自由对流高度在850 hPa附近,阳江的抬升凝结高度则接近1000 hPa、自由对流高度接近925 hPa,对流有效位能达到1185 J/kg。较低的抬升凝结高度和自由对流高度使得不需要很强的抬升即可触发对流,珠三角附近的整层可降水量在强降水发生前和过程中均在60 mm以上,符合极端降水产生的一般性能量和水汽条件。
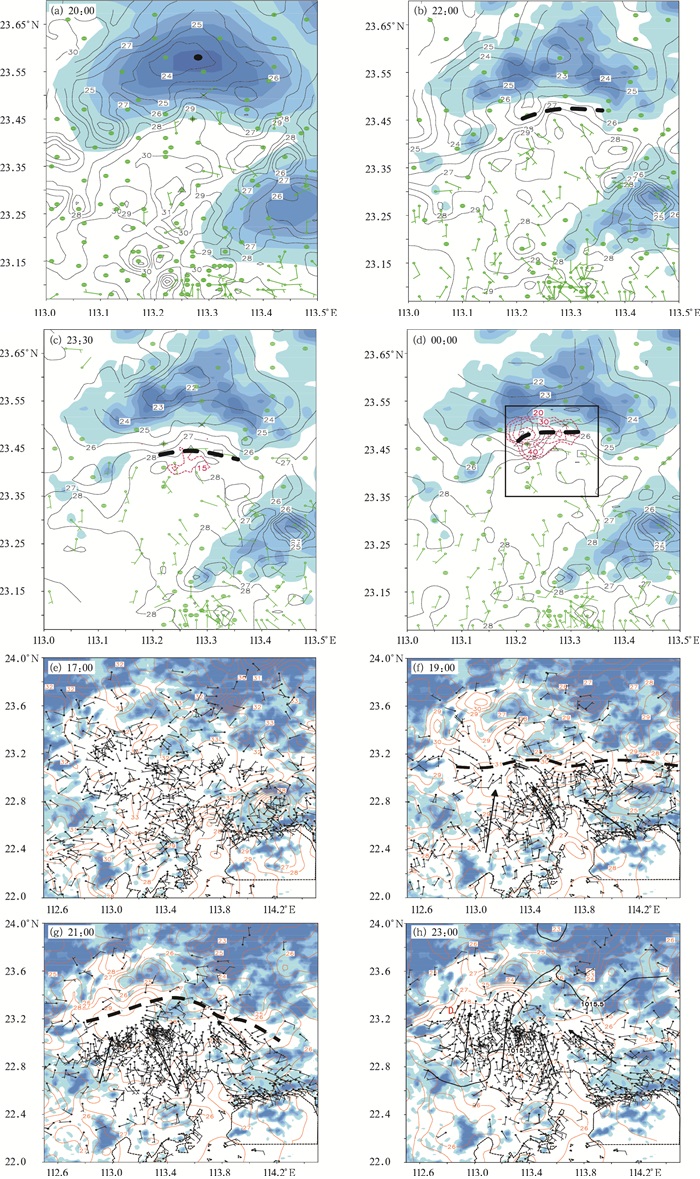
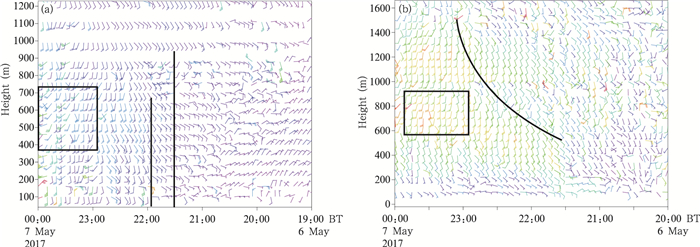
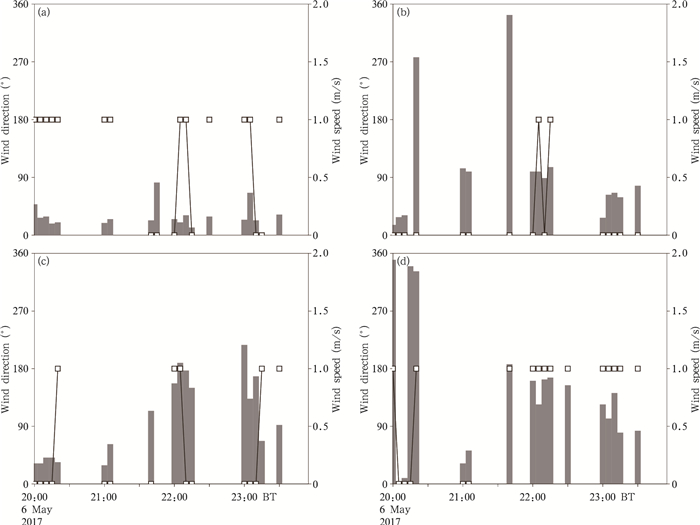
3 中尺度对流系统触发过程6日夜间珠三角近地层为有利的南风辐合背景,喇叭口地形增强了边界层风速辐合:17时偏南风前沿位于广东东南部沿海(图 3e),19时后配合珠三角北部山区入夜山风加强形成地面风速辐合线,21—22时辐合线迅速向北(图 3f—h)推进。风廓线雷达观测显示地面辐合线于22时前后移过花都(图 4a左侧黑线)。200至800 m高度的辐合线则于21时30分前移过(图 4a右侧黑线),随后花都和从化相应高度偏南风加强(图 4),而地面辐合线移速变慢。选取王子山前和花都站以北四站分析辐合线两侧风场变化:22时地面辐合线到达花山镇两龙墟以北(图 3b),22时—7日00时王子山山风和南风对峙使辐合线在山前和两龙墟之间十千米范围内南北摆动(图 3b—d、图 5)。6日23时30分地面风速辐合区附近出现超过15 dBz的雷达回波(图 3c),回波顶高3 km,云底高500—600 m。
|
| 图 3 (a—d) 6日5 min自动气象站温度(等值线,单位:℃)、风场(风矢)、地形高度(蓝色阴影)、广州雷达组合反射率回波(红虚线);(e—h)风场(风矢)、温度(红线,单位:℃)、地形高度(填色,最小值40 m,间隔60 m)、1015.5 hPa海平面气压等压线(黑线,单位:hPa,黑色虚线:地面辐合线,D:低压环流中心) Figure 3 (a-d) Temperature (contours, unit: ℃) collected at automatic weather stations at 5 min intervals, winds (barbed arrow), terrain height (shaded), and Guangzhou radar composite reflectivity (red dotted lines) on 6 May; (e-h) temperature (red contours, unit: ℃) observed at automatic weather stations at 5 min intervals, winds (barbed arrow), terrain height (shaded) and 1015.5 hPa sea-level pressure isobar (black line, unit: hPa) (The dotted line indicates the convergence line and "D" denotes the low circulation center on 6 May) |
|
| 图 4 (a) 花都(23.42°N, 113.24°E), (b)从化(23.57°N, 113.62°E)风廓线 Figure 4 Wind profiles at (a) Huadu (23.42°N, 113.24°E) and (b) Conghua (23.57°N, 113.62°E) |
|
| 图 5 (a) 花都区花山镇花城小学,(b)狮岭镇芙蓉大道,(c)花山镇两龙墟,(d)花东镇槡梓路6日20时—7日00时自动站风向(直方,左坐标)、风速(折线方框,右坐标) Figure 5 Wind directions (histogram) and speeds (broken line) at station Huadu Huachengxiaoxue(a), Furong Dadao(b), Huashan Lianglongxu(c), Huadongzheng Shangzilu(d) from 20:00 6 May to 00:00 7 May |
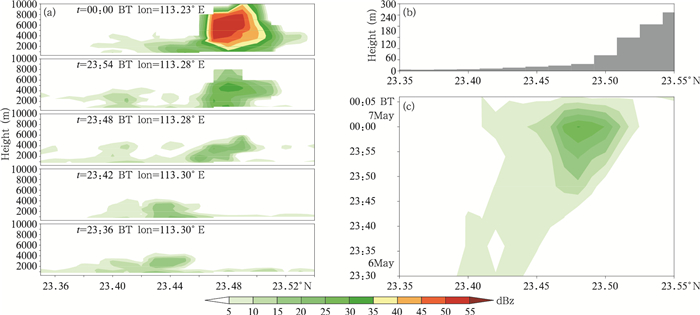
追踪图 3d方框范围内的云团(图 6),6日23时42分前云团向北移动和增强缓慢。广州雷达23时48分之前未观测到超过35 dBz的对流回波,而23时42分至48分在花都附近400—600 m高度观测到超过17 m/s的径向速度(图略),花都、从化(图 4a、b方框)、广州、珠海(图略)风廓线雷达均在该时段和高度范围内观测到风速的增强,相应云团迅速移至山前高温度梯度区,对流迅速向山坡方向传播并显著增强(图 6),至7日00时对流在此区域迅速爆发,最强回波超过52 dBz(图 3d),回波顶高10 km。那么对流为何在高温度梯度区爆发?
|
| 图 6 (a) 广州雷达过组合反射率回波中心的回波经向剖面(时间和经度见图标识), (b)纬向平均地形高度,(c)图 3d方框范围内3 km高度雷达回波纬向平均的经向-时间分布 Figure 6 (a) Meridional-vertical profiles of Guangzhou radar echo (time and longitude are shown in each panel); (b) Zonal mean terrain height and (c) latitude-time distribution of zonally averaged radar echo at 3 km altitude over the rectangle area shown in Fig. 3d |
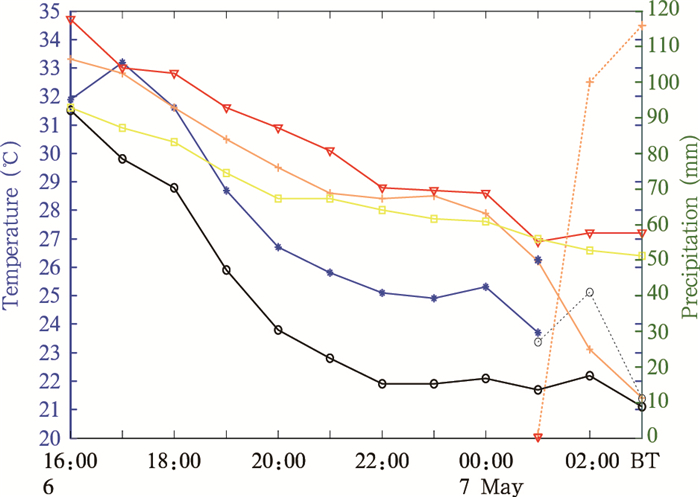
6日20时—7日00时,王子山前有高温度梯度区(图 3a—d)。选取图 3a王子山上(海拔122 m,圆圈)、山前高温中心(海拔20 m,三角形)附近4个站(图 7)分析其温度变化,山上和高温中心16时温差仅为3℃,18时后山上和山前温度迅速下降,高温中心和市区则下降缓慢,于22时形成7℃温差。6日20时—7日00时广州中南部、佛山及其以南的珠江三角洲地区有29—30℃的暖中心(图 3f—h)。已有研究表明珠江三角洲城市热岛效应在2000—2009年可以达到2.16℃(马新野,2014),随着城市化进程加快,2017年的城市热岛效应或许高于该值。马新野(2014)在长三角城市热岛研究中指出城市范围扩展对气温影响的气温升高幅度在19—20时达到最高点,对应高温度梯度形成时段。当边界层辐合线移至该高温度梯度区后,受温度梯度影响将在暖空气一侧出现上升、冷空气一侧出现下沉环流,从而加强高温度梯度区的上升运动(Trapp,2013;Koch,1984)。Zhang等(2011)的数值模拟也表明城市下游高温度梯度区存在上升运动,这种上升运动有利于对流触发。
|
| 图 7 花都区梯面镇红山村(圆点)、花山镇花城小学(叉号)、白云区人和镇江八中路(三角形)、天河区五山街东莞庄路(方框)、花都最大小时雨量站花山镇两龙墟(十字)(站点位置见图 3a相应形状标识) 6日16时—7日03时温度(实线)、降水(虚线)变化 Figure 7 Temperature (solid lines) and precipitation (dotted lines) at station Hongshan (dot), Huacheng Xiaoxue (x mark), Renhezhenjiang Bazhonglu (triangle), Dongguanzhuanglu (rectangle), and Huadu Lianglongxu (+ mark) from 16:00 BT May 6 to 03:00 BT May 7 (station locations are shown in Fig. 3a with the corresponding marks) |
综上触发过程为:小尺度地形辐射降温配合城市热岛在山前形成高温度梯度区,山风与南风对峙使地面辐合线在山前移速变慢有助于热带云团的生成;地形阻挡抬升和高温度梯度加强上升运动,南风风速脉动使云团迅速向山前移动,最终对流爆发。
4 中尺度对流系统的组织和维持通过葵花8号气象卫星、FY-2E、FY-2G云顶亮温和广州雷达、分钟雨量和5 min自动站数据研究中尺度对流系统的活动特点,以分析极端雨强的产生和持续时间长的成因。
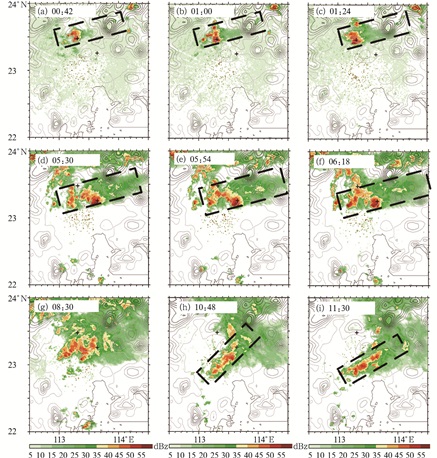
4.1 中尺度对流系统活动特点雷达回波演变分为准静止对流系统(7日00—09时)和线状对流阶段(09—16时)。00时—02时30分对流中心位于王子山前(图 8a—d)。02时18分起东南偏南风风速辐合配合地形在广州白云山东侧触发新对流,其迅速增强并与花都向南移动的对流系统合并,于05时前后成为中心位于增城新塘镇的对流系统。同时,对流单体迅速衰减,并在环境风作用下向东北方向移动形成狭长的层云云带。
|
| 图 8 广州番禺(23°N,113.36°E)雷达组合反射率(色阶)和地形高度 (等值线,最小值40 m、间隔60 m,十字:暴雨中心) Figure 8 Guangzhou (23°N, 113.36°E) composite reflectivity (shaded) and terrain height (contours, with the minimum of 40 m at 60 m intervals. The symbol "+" indicates the rain center) |
05—08时最强降水时段回波中心稳定位于花都南部和增城附近,最低云顶亮温接近-60℃,冷区(低于-32℃的亮温区域)尺度最大仅为88.13 km。05—07时雷达回波(图 9b)表现为高于55 dBz强回波中心稳定位于白云山东南侧地形“豁口”处新塘镇附近。最大小时雨量站的分钟雨量(图 9a)显示05时18分前雨强约为2 mm/min。05时10分至30分从化、珠海、广州风廓线雷达在400—800 m高度观测到偏南风风速增大(图略),05时18分回波中心面积迅速扩大,05时20分—06时10分分钟降水量普遍大于3.5 mm。06时12分后大于55 dBz的回波分散为3个中心,降水减弱(图 8a)。对流系统西侧和南侧不断有对流新生并入使系统迅速增强(图 8e—i,图 9b)。然而,风暴平均引导气流为西南风,中尺度对流系统的单体移动方向和传播方向近乎相反导致系统移动非常缓慢,后向传播特征明显,多个暖区暴雨个例均表现出相似的传播特点(徐珺等,2014;谌芸等,2012;陈明轩等,2013)。

|
| 图 9 (a)最大小时雨量站温度(红线)、分钟雨量(蓝线)及风速(风矢)随时间变化, (b)广州番禺(23°N, 113.36°E)雷达回波强度高于55 dBz范围(黑点:最大小时雨量站。05时(黑),05时18分(红),05时36分(绿),05时54分(蓝),22时12分(靛),22时30分(粉),色阶:地形高度,最小值40 m,间隔60 m) Figure 9 Variation of 1-min precipitation (blue line), and wind (barbed arrow) and air temperature at the station of maximum hourly-precipitation (a); (b) area with radar echo above 55 dBz over area of Guangzhou (23°N, 113.36°E) (at 05:00 BT (black), 05:18 (red), 05:36(green), 05:54(blue), 22:12(purple) and 22:30(pink). Shaded area shows terrain height with minimum of 40 m and 60 m intervals) |
7日08时前后随对流系统的发展地面出现气旋性环流,配合地面显著的东南偏南风,对流系统演变为线状对流(图 8i—l),随后向东南移速加快,强降水趋于结束。
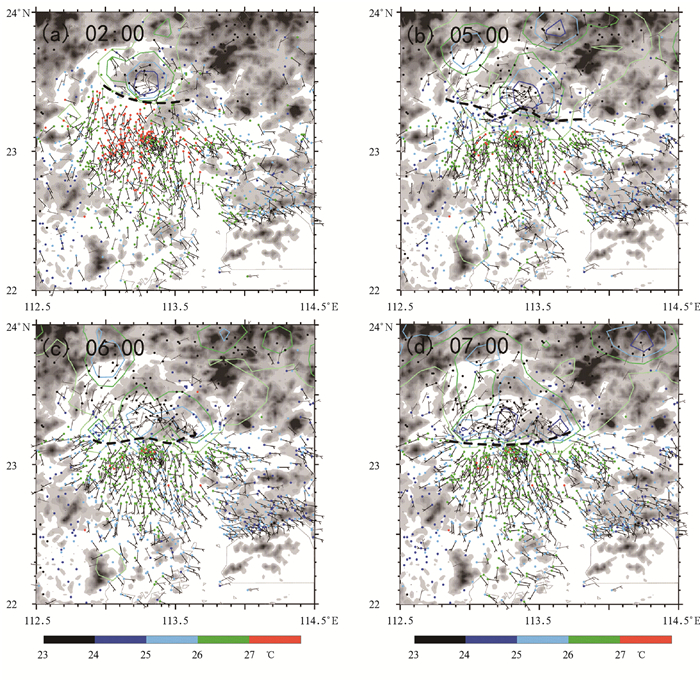
4.2 中尺度对流系统的组织和维持为何强降水回波中心稳定位于增城新塘镇附近呢?首先,弱冷池驱动对流系统连续性传播。冷池前沿10 km范围内存在3℃左右的温度过渡区(图 10),06时强降水发生后温度下降2℃,但偏北风风速不变(图 9a),冷池风速仅为2—4 m/s,最大6 m/s,入流速度也仅为2—4 m/s,新生对流不断沿主体对流生成而非远离,且直接并入主体系统使得强降水回波面积快速增大(图 8b),导致增城极端雨强产生。图 11主体对流西侧和南侧的对流回波剖面及图 8e—h增城附近等回波强度密集带也证实了这一点。
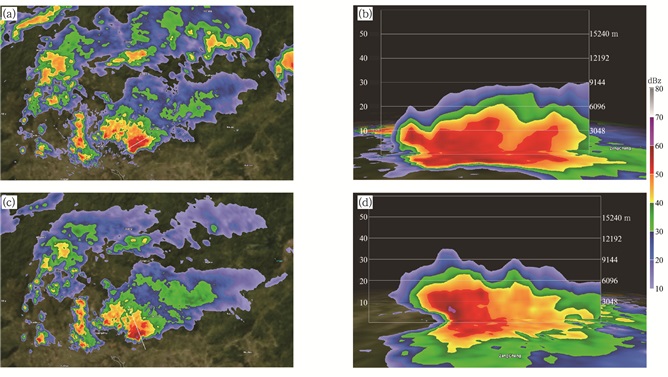
另外,结合图 10b—d,05—07时白云山东南侧地形“豁口”的南侧为东南偏南进口风,在冷池和地形抬升辐合的共同作用下,新生对流表现为不断在地形“豁口”处生成(图 9b、11),使强降水中心稳定位于增城附近。为何极端雨强情况下冷池出流却很弱呢?回波剖面显示回波顶高在10 km以下,大于30 dBz的回波主体位于6 km以下(0℃层高度4.8 km左右),最强回波超过62 dBz但在3 km以下。可见该次过程为非典型深对流,以暖云降水为主。一般认为出流强度可以由以下因素决定:融化和蒸发过程、降水拖拽以及中层入流(Houze,2014;陈明轩等,2012;刘香娥等,2012;康红等,2016),在暖云为主体的降水过程中,融化过程少、整层高湿蒸发过程少、无明显的中高层天气系统导致几乎无明显中层入流,以降水拖拽为主所以出流较弱。因而,一旦降水出现便形成较大面积的热带积雨云,且主体对流减弱为层云降水后为新生对流提供了更多的水汽,导致了极高的降水效率(Houze,2014)。Houze(2014)也指出热带一个云顶在0℃以下的塔状积云经常可以产生极强的降水。
|
| 图 10 5 min自动气象站风速(风矢)、温度(圆点,数值见色标)、小时雨量(等值线,分别为1、5、10、20 mm)和冷池边界(黑虚线) Figure 10 Temperature (color dots) and wind (barbed arrow) collected at automatic weather stations at 5-min intervals, hourly rainfall (contours, 1, 5, 10, 20 mm respectively), and the cold pool periphery (black dashed line) |
|
| 图 11 7日04时24分广州番禺(23°N, 113.36°E)0.5°仰角回波(a), 过图a白线的回波剖面(b), 2.4°仰角回波(c), 过图c白线的回波剖面(d) Figure 11 (a) Radar echoes at 0.5° elevation in Guangzhou at 04:24 BT 7 May and echo profiles through the white line shown in (a), and (c) radar echoes at 2.4° elevation and (d) echo profiles through the white line shown in (c) |
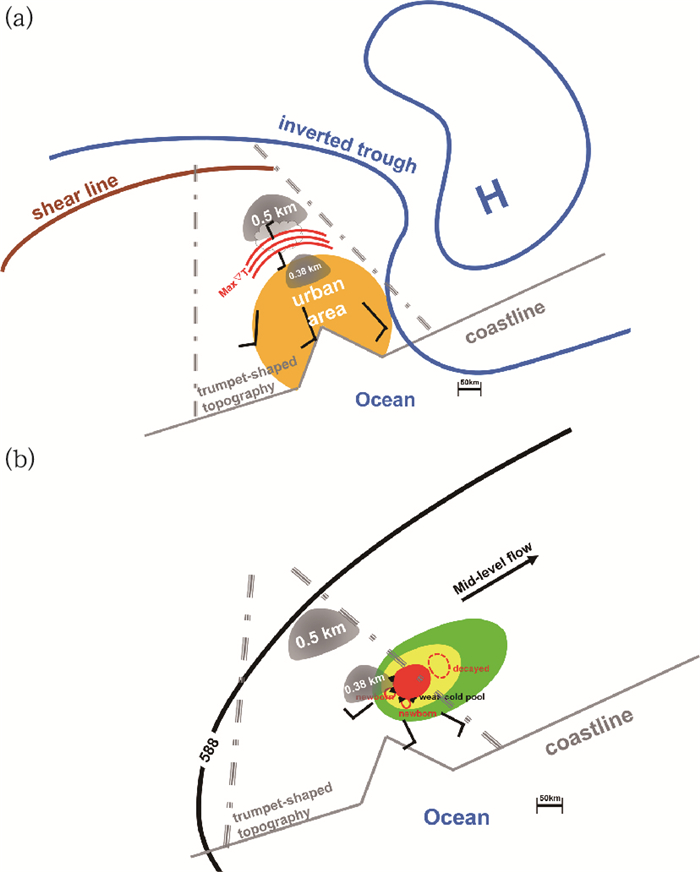
该次过程集中爆发于副热带高压边缘、低层切变系统南侧,为弱强迫背景华南前汛期暴雨。降水主要发生在复杂地形地区,局地中尺度对流特征明显,单点小时雨量大、强降水持续时间长。本研究对直接导致极端降雨的中尺度对流系统的触发和维持过程进行探讨并总结出了概念模型(图 12):
|
| 图 12 广州“5.7”特大暴雨概念模型(灰色阴影:地形,点断线:40 m以上地形高度边界,示意地形汇流峡口),(a)触发(红线:地面等温线,示意高温度梯度区,棕线:低层切变线,云:对流);(b)组织和维持(彩色阴影:雷达回波) Figure 12 Conceptual model of the torrential rain hit Guangzhou on 7 May (shaded: terrain, dashed line: terrain height above 40 m, stationary front symbol: large temperature gradient and boundary layer convergence line): (a) trigger and (b) maintenance mechanism (shaded: radar echo) |
(1) 低层切变系统东移和北方高压系统入海为珠三角近地层提供了有利的南风辐合背景。喇叭口地形加强了这种风速辐合,边界层南风区域在有限时间内迅速向北扩展(图 12a)。
(2) 在有利的近地层风速辐合背景下,小尺度地形辐射降温配合城市热岛作用在山前形成大温度梯度区;山风与南风的对峙使得地面辐合线在山前位置相对稳定,有利于热带云团的产生。地形阻挡和两者之间的高温度梯度使上升运动加强,南风风速脉动使云团迅速向山前移动并最终在高温度梯度区爆发对流(图 12a)。
(3) 中尺度对流系统7日09时前具有准静止对流系统的特征;最强降水时段对流中心稳定于白云山东南侧地形“豁口”处,小尺度地形作用明显;该次过程为暖云为主体的非典型深对流,无明显的中层入流、融化蒸发过程少、冷池弱。弱冷池驱动对流连续性传播,强降水回波面积快速增大,产生极端雨强。中尺度对流系统的单体移动方向和传播方向近乎相反(图 12b)使系统移动非常缓慢,后向传播特征明显导致长时间强降水(图 12b)。
然而,本研究结论中的城市热岛和小尺度地形受热不均导致的高温度梯度区有助于触发对流目前仅有雷达和地面观测的支持,还需进一步的数值试验进行定量研究。那么,是否有更多观测事实和数值试验证明城市热岛配合地形辐射降温能够触发对流并对极端降水的产生有作用?随着中国城镇化进程的推进,从气候上城市热岛与地形配合是否会影响强降水的分布和强度?从云微物理角度如何解释弱强迫背景下对流系统的极端降水效率?β中尺度对流系统在发展和维持过程中的热力和动力结构怎样?与环境场的相互作用如何?如何利用高分辨率模式对此类极端降水的可预报性进行分析?如何衡量初值敏感性和物理过程敏感性?以及可否利用对流尺度集合预报提高其预报能力?这些问题都有待于进一步研究。
致谢: 感谢国家气象中心唐健、朱文剑、陈双、王皘在数据收集和雷达资料处理过程中的帮助。| 陈明轩, 王迎春. 2012. 低层垂直风切变和冷池相互作用影响华北地区一次飑线过程发展维持的数值模拟. 气象学报, 70(3): 371–386. Chen M X, Wang Y C. 2012. Numerical simulation study of interactional effects of the low-level vertical wind shear with the cold pool on a squall line evolution in North China. Acta Meteor Sinica, 70(3): 371–386. DOI:10.11676/qxxb2012.033 (in Chinese) |
| 陈明轩, 王迎春, 肖现, 等. 2013. 北京"7.21"暴雨雨团的发生和传播机理. 气象学报, 71(4): 569–592. Chen M X, Wang Y C, Xiao X, et al. 2013. Initiation and propagation mechanism for the Beijing extreme heavy rainstorm clusters on 21 July 2012. Acta Meteor Sinica, 71(4): 569–592. DOI:10.11676/qxxb2013.053 (in Chinese) |
| 谌芸, 孙军, 徐珺, 等. 2012. 北京721特大暴雨极端性分析及思考(一)观测分析及思考. 气象, 38(10): 1255–1266. Chen Y, Sun J, Xu J, et al. 2012. Analysis and thinking on the extremes of the 21 July 2012 torrential rain in Beijing Part Ⅰ:Observation and thinking. Meteor Mon, 38(10): 1255–1266. DOI:10.7519/j.issn.1000-0526.2012.10.012 (in Chinese) |
| 范绍佳, 王安宇, 樊琦, 等. 2006. 珠江三角洲大气边界层特征及其概念模型. 中国环境科学, 26(S1): 4–6. Fan S J, Wang A Y, Fan Q, et al. 2006. Atmospheric boundary layer features of Pearl River Delta and its conception model. China Environ Sci, 26(S1): 4–6. (in Chinese) |
| 黄士松. 1986. 华南前汛期暴雨. 广州: 广东科技出版社-244pp. Huang S S. 1986. Rain storm in South China in Early Su mmer. Guangzhou: Guangzhou Science and Technology Press-244pp. |
| 康红, 费建芳, 黄小刚, 等. 2016. 一次弱弓形飑线后方入流特征的观测分析. 气象学报, 74(2): 176–188. Kang H, Fei J F, Huang X G, et al. 2016. The observational analysis of the characteristics of rear inflow in a weak-bow squall line. Acta Meteor Sinica, 74(2): 176–188. (in Chinese) |
| 李博, 刘黎平, 赵思雄, 等. 2013. 局地低矮地形对华南暴雨影响的数值试验. 高原气象, 32(6): 1638–1650. Li B, Liu L P, Zhao S X, et al. 2013. Numerical experiment of the effect of local low terrain on heavy rainstorm of South China. Plateau Meteor, 32(6): 1638–1650. DOI:10.7522/j.issn.1000-0534.2012.00156 (in Chinese) |
| 李真光, 梁必骐, 包澄澜. 1981. 华南前汛期暴雨的成因与预报问题//华南前汛期暴雨文集编辑小组. 华南前汛期暴雨文集. 北京: 气象出版社, 1-8. Li Z G, Liang B Q, Bao C L. 1981. Mechanism and prediction of pre-rainy season heavy rainfall in South China//Collected Papers of Pre-Rainy Season Heavy Rainfall in South China. Beijing: China Meteorological Press, 1-8 (in Chinese) |
| 刘香娥, 郭学良. 2012. 灾害性大风发生机理与飑线结构特征的个例分析模拟研究. 大气科学, 36(6): 1150–1164. Liu X E, Guo X L. 2012. Analysis and numerical simulation research on severe surface wind formation mechanism and structural characteristics of a squall line case. Chinese J Atmos Sci, 36(6): 1150–1164. DOI:10.3878/j.issn.1006-9895.2012.11212 (in Chinese) |
| 马新野. 2014. 不同气候带城市化效应的差异和城市扩展对区域气候的影响[D]. 南京: 南京大学, 1, 62, 101. Ma X Y. 2014. The difference of urbanization effect over different climate zones and the impact of urban expansion on regional climate[D]. Nanjing: Nanjing University, 1, 62, 101 (in Chinese) http://cdmd.cnki.com.cn/Article/CDMD-10284-1014418687.htm |
| 孙健, 赵平, 周秀骥. 2002. 一次华南暴雨的中尺度结构及复杂地形的影响. 气象学报, 60(3): 333–342. Sun J, Zhao P, Zhou X J. 2002. The mesoscale structure of a South China rainstorm and the influence of complex topography. Acta Meteor Sinica, 60(3): 333–342. DOI:10.11676/qxxb2002.040 (in Chinese) |
| 徐珺, 杨舒楠, 孙军, 等. 2014. 北方一次暖区大暴雨强降水成因探讨. 气象, 40(12): 1455–1463. Xu J, Yang S N, Sun J, et al. 2014. Discussion on the formation of a warm sector torrential rain case in North China. Meteor Mon, 40(12): 1455–1463. DOI:10.7519/j.issn.1000-0526.2014.12.004 (in Chinese) |
| Chen X C, Zhao K, Xue M. 2014. Spatial and temporal characteristics of warm season convection over Pearl River Delta region, China, based on 3 years of operational radar data. J Geophys Res, 119(12): 12447–12465. |
| Chen X C, Zhao K, Xue M, et al. 2015. Radar-observed diurnal cycle and propagation of convection over the Pearl River Delta during Mei-Yu season. J Geophys Res, 120(24): 12557–12575. |
| Houze Jr R A. 2014. Cloud Dynamics. 2nd ed. Amsterdam: Elsevier, 275-277 |
| Koch S E. 1984. The role of an apparent mesoscale frontogenetic circulation in squall line initiation. Mon Wea Rev, 112(10): 2090–2111. DOI:10.1175/1520-0493(1984)112<2090:TROAAM>2.0.CO;2 |
| Leary C A, Houze Jr R A. 1979. The structure and evolution of convection in a tropical cloud cluster. J Atmos Sci, 36(3): 437–457. DOI:10.1175/1520-0469(1979)036<0437:TSAEOC>2.0.CO;2 |
| Li B, Wielicki B A, Minnis P, et al. 2006. The effect of environmental conditions on tropical deep convective systems observed from the TRMM satellite. J Climate, 19(22): 5745–5761. DOI:10.1175/JCLI3940.1 |
| Luo Y L, Wang H, Zhang R H, et al. 2013. Comparison of rainfall characteristics and convective properties of monsoon precipitation systems over South China and the Yangtze and Huai River Basin. J Climate, 26(1): 110–132. DOI:10.1175/JCLI-D-12-00100.1 |
| Mohr K I, Famiglietti J S, Zipser E J. 1999. The contribution to tropical rainfall with respect to convective system type, size, and intensity estimated from the 85-GHz ice-scattering signature. J Appl Meteor, 38(5): 596–606. DOI:10.1175/1520-0450(1999)038<0596:TCTTRW>2.0.CO;2 |
| Rotunno R, Klemp J B, Weisman M L. 1988. A theory for strong, long-lived squall lines. J Atmos Sci, 45(3): 463–485. DOI:10.1175/1520-0469(1988)045<0463:ATFSLL>2.0.CO;2 |
| Trapp R J. 2013. Mesoscale-Convective Processes in the Atmosphere. Cambridge, USA: Cambridge University Press: 140-141. |
| Wang H, Luo Y L, Jou B J D. 2014. Initiation, maintenance, and properties of convection in an extreme rainfall event during SCMREX:Observational analysis. J Geophys Res, 119(13): 13206–13232. |
| Weisman M L. 1992. The role of convectively generated rear-inflow jets in the evolution of long-lived mesoconvective systems. J Atmos Sci, 49(19): 1826–1847. DOI:10.1175/1520-0469(1992)049<1826:TROCGR>2.0.CO;2 |
| Xu W X, Zipser E J. 2012. Properties of deep convection in tropical continental, monsoon, and oceanic rainfall regimes. Geophys Res Lett, 39(7): L07802. |
| Xu W X, Zipser E J, Chen Y L, et al. 2012. An orography-associated extreme rainfall event during TiMREX:Initiation, storm evolution, and maintenance. Mon Wea Rev, 140(8): 2555–2574. DOI:10.1175/MWR-D-11-00208.1 |
| Xu W X. 2013. Precipitation and convective characteristics of su mmer deep convection over East Asia observed by TRMM. Mon Wea Rev, 141(5): 1577–1592. DOI:10.1175/MWR-D-12-00177.1 |
| Yanai M, Esbensen S, Chu J H. 1973. Determination of bulk properties of tropical cloud clusters from large-scale heat and moisture budgets. J Atmos Sci, 30(4): 611–627. DOI:10.1175/1520-0469(1973)030<0611:DOBPOT>2.0.CO;2 |
| Zhang D L, Shou Y X, Dickerson R R, et al. 2011. Impact of upstream urbanization on the urban heat island effects along the Washington-Baltimore Corridor. J Appl Meteor Climatol, 50(10): 2012–2029. DOI:10.1175/JAMC-D-10-05008.1 |
 2018, Vol. 76


