中国气象学会主办。
文章信息
- 索春男, 田文寿, 谢飞, 雒佳丽, 张健恺. 2017.
- SUO Chunnan, TIAN Wenshou, XIE Fei, LUO Jiali, ZHANG Jiankai. 2017.
- 1997年和2011年春季北极臭氧损耗事件的对比分析
- A comparative analysis of Arctic ozone depletion events in the spring of 1997 and 2011
- 气象学报, 75(3): 492-505.
- Acta Meteorologica Sinica, 75(3): 492-505.
- http://dx.doi.org/10.11676/qxxb2017.030
-
文章历史
- 2016-08-10 收稿
- 2017-02-28 改回
2. 北京师范大学全球变化与地球系统科学研究院, 北京, 100875
2. College of Global Change and Earth System Science, Beijing Normal University, Beijing 100875, China
自从发现平流层环流异常可以影响地面的天气过程后(Baldwin, et al, 2001;Chen et al,2013, 郑彬等,2007),平流层环流的变化就成了研究的热点(Bian et al,2005, Chen et al,2008, 陈权亮等, 2007, 2009;Ren, et al,2012)。其实,平流层化学成分对大气有显著的辐射强迫,也可以通过影响动力过程影响全球气候(胡永云等, 2008, 2009;吕达仁等, 2003, 2009;刘毅等,2009;Tian, et al,2009;Xie, et al,2008)。关于平流层大气化学成分变化工作,中国学者也做了大量的研究(毕云等, 2007, 2008;陈月娟等, 1998, 2009;郭世昌等,2008;施春华等,2009;郑彬等,2008)。
平流层臭氧是平流层最重要的化学成分之一,是防止紫外线侵害地球的卫士。自Farman等(1985)首次发现了南极臭氧空洞现象以来,科学家们经过大量的研究揭示了南极春季臭氧空洞的形成原因(McIntyre,1989;Proffitt, et al,1989;Solomon, et al,1986;Molina, et al,1987;McElroy, et al,1986;Poole, et al,1988;Waibel, et al,1999;Tilmes, et al,2004),发现南极强大极涡里的化学过程导致了南极臭氧洞的形成。北极上空由于没有南极上空那样强大稳定的极涡存在,达不到像南极极涡那样低的温度(Andrews,1989;Schoeberl, et al,1992),北极上空并没有出现持续存在的臭氧空洞。但是,由于北极极涡强度不如南极稳定,相比南极极涡会更易受到动力过程的影响,因此,北极春季臭氧年际变化很大(Tilmes, et al,2004;Müller, et al,1997)。近年来有观测表明,北极上空也出现了强度可与南极臭氧洞比拟的臭氧空洞(Lefèvre, et al,1998;Manney, et al,2011;Krzyścin,2012)。尽管北极地区臭氧空洞事件只是偶尔出现,但这样的事件究竟是什么原因造成,未来这样的事件是否会更频繁发生备受全球科学家的关注,也是本研究关注的问题。
1997和2011年是有资料记录以来发现的北极地区臭氧损耗最强烈的两年(Lefèvre, et al,1998;Coy, et al,1997;Manney, et al,2011),因此,揭示造成这两年臭氧损耗加剧的原因和机理有利于更好地预测或预报未来北极臭氧的变化。已有学者对这两年的臭氧损耗进行了研究,如Lefèvre等(1998)利用三维化学传输模式模拟了1997年北极臭氧损耗过程,发现臭氧除了大量化学损耗外,动力过程贡献了70 DU的大气臭氧柱总减少量,即动力过程也是造成1997年北极臭氧“空洞”的主要原因之一。但其并没有进一步分析是什么动力过程导致北极大气臭氧柱总量的减少。Manney等(2011)认为,2011年北极极涡持续偏强造成活性氯浓度偏高,是破坏臭氧并造成当年北极臭氧低谷的根本原因,并认为北极臭氧空洞是完全可能形成的。Kuttippurath等(2012)则对比分析了1997和2011年北极上空的臭氧损耗过程,指出由于2010年冬季北极温度更低,因此,2011年春季的臭氧化学损耗更强烈,但其并没有给出北极气温的变冷是哪些动力因素导致的。
对于北极平流层臭氧的化学损耗,Tabazadeh等(2000)指出,当北极极地平流层云(PSCs)在极区存在时间超过两周时,对北极平流层臭氧的损耗将超过30%。Schulz等(2001)对北极平流层臭氧损耗的阈值条件进行了研究,认为温度是决定北极臭氧含量的主要因素,当温度达到阈值温度TNAT(三水硝酸化合物(NAT)形成温度)则会发生化学臭氧损耗。但北极臭氧变化相对南极更加复杂,因为其更容易受动力过程影响。以往的研究已表明厄尔尼诺-南方涛动(ENSO)对北半球中纬度地区和极地平流层臭氧均有显著影响(Zhang et al,2014, 2015, 2016;Xie et al,2014a, 2014b)。有学者指出冬季ENSO处于冷(暖)位相时,北半球极涡趋于变强(变弱)(van Loon, et al,1982;Labitzke, et al,1989;Camp, et al,2007;Xie, et al,2012)。Manzini等(2006)和García-Herrera等(2006)的研究也表明,ENSO暖位相会在其随后的冬春季节诱发类似太平洋-北美(PNA)的波列并且导致平流层1波加强,极涡变暖,臭氧损耗减弱。除ENSO外,近些年研究表明,北太平洋海温异常也被证明是影响北极臭氧的重要因素(Garfinkel, et al,2015;Woo, et al,2015;Kren, et al,2016)。
综合来看,以往对于这两个个例的分析和对比并没有全面给出究竟是哪些动力过程导致这两年臭氧损耗的不同,动力和化学过程异常对不同高度臭氧损耗的贡献也没有进行定量化分析。为了解决以上这些问题,本研究对可能引起北极臭氧含量异常偏低的1997和2011年的化学过程和动力过程进行分析,试图揭示ENSO影响北极臭氧的特征和机理,探讨ENSO事件和北太平洋海温异常引起的动力过程异常对北极平流层臭氧异常的影响过程和机制。
2 资料、方法和模式介绍1979—2011年的臭氧柱总量以及臭氧混合比资料主要来自SLIMCAT模式模拟结果、TOMS(Total Ozone Mapping Spectrometer)大气臭氧卫星资料和MERRA (Modern-ERA Retrospective Analysis for Research and Applications)再分析资料。1979—2012年的臭氧损耗物质活性氯以及化学损耗的臭氧量均来自模式模拟结果。北半球位涡极大值以及北极地区极地平流层云中三水硝酸化合物(NAT)和冰核含量的日变化资料来自于臭氧监测网站(http://ozonewatch.gsfc.nasa.gov/meteorology/NH.html),同时文中利用Nino3指数来代表ENSO事件的变化情况,Nino3指数资料来自于网站(http://www.cpc.ncep.noaa.gov/data/indices/),时间跨度为1982—2014年。海表温度(SST)来自哈得来中心海温资料(Hadley Centre Sea-ice and Sea-surface Temperature Data Set Version1,HadISST1) 水平分辨率为1°×1°。位势高度以及计算E-P (Eliassen-Palm)通量的U、V风场以及气温(T)则均采用NCEP的再分析资料,时间跨度均为1979—2012年。
SLIMCAT模式是一个三维的不考虑化学与动力过程反馈的化学传输模式(Chipperfield, et al, 1996),主要用于模拟过去和当前的大气化学过程及大气成分的传输特征。模式采用σ-p混合坐标系,水平分辨率为5°×5°,模式采用欧洲中期天气预报中心(ECMWF)再分析资料作为驱动场,模式主要分为平流传输和动力化学模块。文中模式采用的平流方案基于Prather平流机制(Prather, 1986)。1979—2011年模式模拟的大气臭氧柱总量与TOMS卫星观测的大气臭氧柱总量对比如图 1所示。可以看出,模式模拟的全球平均臭氧柱总量与卫星资料的时间序列有很好的一致性,两种资料相关系数高达0.89,当然,模拟资料和观测资料也存在一定的差异(图 1b),但是平均正、负最大偏差基本在10%之内,因此,可认为模式资料有较高可信度。此外,从模拟资料和观测资料大气臭氧柱总量气候态的空间分布来看(图 1c、d),其空间特征也非常一致。

|
| 图 1 (a)TOMS卫星观测的(黑线)和SLIMCAT模拟的(红线)1979—2011年全球平均大气臭氧柱总量时间序列,(b)为(a)中两条线的差值,即模式资料与卫星资料的差值,(c)TOMS卫星观测的1979—2011年平均的大气臭氧柱总量全球分布,(d)模式模拟的1979—2011年平均大气臭氧柱总量的全球分布 Figure 1 (a) Time series of global mean total column ozone (TCO) based on the TOMS satellite data (black line) and SLIMCAT model output (red line), (b) differences between SLIMCAT and TOMS data, (c) 1979-2011 average TCO distribution from TOMS satellite data, (d) 1979-2011 average TCO distribution from SLIMCAT model output |
E-P通量可以代表与Brewer-Dobson环流(BDC)强度以及纬向平均流场有关的波活动,目前已广泛应用于分析行星波传播。Andrew等(1987)给出了E-P通量的计算表达式,其垂直分量表达式为

|
(1) |
式中,ρo为背景空气密度,θ为位温,a为地球半径,v为经向风,φ为地球纬度,f为科里奥利参数,下标z表示对高度z的导数。横线代表纬向平均,v′和θ′均代表纬向偏差值。
若无特别说明,文中所提到的1997或2011年臭氧异常均指1997或2011年臭氧含量减去1979—2012年气候态所得到。
3 1997和2011年北极臭氧变化个例分析及化学过程在其中的作用图 2a给出了1979—2012年逐年3月基于SLIMCAT模拟资料和TOMS卫星资料以及MERRA资料的北极地区平均大气臭氧柱总量异常的逐年变化。这里只给出3月,是因为3月通常是北极臭氧消耗最严重的时段(Manney, et al,2011)。3套资料均显示,在1997和2011年3月北极地区大气臭氧柱总量都存在极端异常偏低的现象,是近30年大气臭氧柱总量负异常最大的两年。从模式结果来看,这两年3月的异常值约达到90 DU,而卫星资料结果显示异常偏低最大值也超过了60 DU。图 2b给出了利用SLIMCAT模拟的1997和2011年北极地区从上一年12月至当年4月大气臭氧柱总量异常的逐日变化,可见这两年的大气臭氧柱总量负异常均是从2月开始,3月中下旬达到异常最大值约为90 DU。但是,2011年3月中下旬之前的大气臭氧柱总量负异常值在同一时间点上要大于1997年的大气臭氧柱总量,量级约为20 DU。随后从4月开始大气臭氧柱总量开始恢复,很明显,2011年的大气臭氧柱总量恢复速度要比1997年快得多。下面将详细分析这两年臭氧异常的产生原因。由于SLIMCAT模拟结果与观测资料和再分析资料对比均非常好(图 1),为便于机制的分析,后面的研究将主要用SLIMCAT模拟资料分析。

|
| 图 2 (a)1979—2015年逐年3月北极极区平均大气臭氧柱总量异常时间序列(TOMS卫星观测资料(蓝线)、SLIMCAT模拟资料(红线)和MERRA资料(橘黄线)),(b)基于SLIMCAT模拟资料得到的1997年(黑线)和2011年(红线)春季北极极区平均大气臭氧柱总量异常逐日变化 Figure 2 (a) Time series of Arctic average TCO anomalies in March during 1979-2015 from TOMS satellite data (blue line), SLIMCAT model output (red line) and MERRA reanalysis data (orange line); (b) Changes in daily Arctic average TCO anomalies from December to April in 1996-1997 (black line) and 2010-2011(red line) from SLIMCAT model |
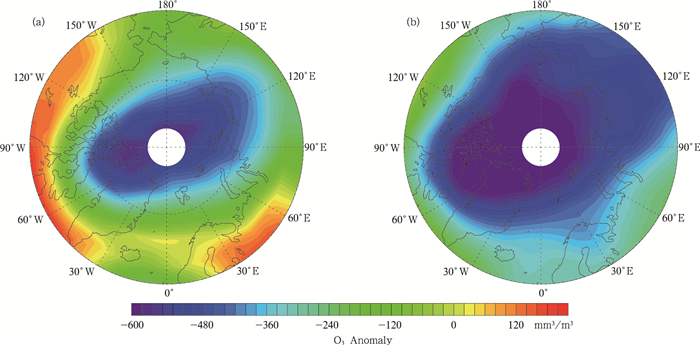
图 3给出了1997和2011年的3月基于SLIMCAT模拟的北半球100 hPa等压面上臭氧异常的分布。很明显这两年3月的臭氧异常偏低区域主要集中于北极地区,并且越靠近极地异常越大,尤其是2011年3月,臭氧异常偏低区域相对于1997更大,100 hPa等压面上2011年的臭氧损耗相比1997年3月明显偏强。这说明,1997和2011年春季北极臭氧在不同层结臭氧的损耗应该是不一样的。为了进一步了解1997和2011年北极春季的臭氧损耗的原因,首先需要了解究竟是哪个高度范围内发生了强烈的臭氧损耗。将极区(60°—90°N)上空平流层分成1—10、10—30、30—70及70—200 hPa 4层,分别计算各个层内大气臭氧柱总量在3月的异常含量,并利用模式模拟结果计算对应层内臭氧的化学损耗量(表 1)。
|
| 图 3 基于SLIMCAT模拟得到的1997年3月(a)和2011年3月(b)北半球100 hPa等压面上臭氧混合比异常分布 Figure 3 Anomalies of 100 hPa ozone mixing ratio in March of 1997 (a) and 2011 (b) in the northern hemisphere based on SLIMCAT model output |
| 气压层(hPa) | 1997年 | 2011年 | |||
| 臭氧柱异常值(DU) | 化学损耗值(DU) | 臭氧柱异常值(DU) | 化学损耗值(DU) | ||
| 1—10 | -4.77 | -0.91 | -1.90 | -0.90 | |
| 10—30 | -20.99 | -11.27 | -16.51 | -9.33 | |
| 30—70 | -30.39 | -33.75 | -31.21 | -35.56 | |
| 70—200 | -24.87 | -23.48 | -30.59 | -30.66 | |
从表 1可以看出,1997和2011年3月平流层的各个层结均存在臭氧消耗,但较大的臭氧负异常主要发生在中下平流层,即30—70和70—200 hPa两层。中下平流层内大气臭氧柱总量的负异常之和已将近-60 DU,占整层大气臭氧柱总量异常的80%。对比平流层不同高度的臭氧异常和臭氧化学损耗量可以看出,在平流层30 hPa以上,1997和2011年3月化学损耗的大气臭氧柱总量占此层大气臭氧柱总量的减少量的50%,表示在此平流层层结臭氧的动力损耗有重要的贡献。Krzyścin等(2012)指出北极平流层臭氧动力损耗是由于Brewer-Dobson环流减弱导致的。再分析资料表明,1997和2011年3月Brewer-Dobson环流均在异常减弱(图略),从而导致上平流层中纬度Brewer-Dobson环流经向输送减弱,更少的高浓度臭氧空气从中纬度向北极输送,这样就造成了这两年北极上平流层臭氧的动力减少。这亦说明,在上平流层化学过程和动力过程共同导致了1997和2011年3月大气臭氧柱总量的负异常。从表 1还可以看出,在1997和2011年3月北极地区30 hPa以上平流层动力过程对臭氧减少的贡献与化学损耗对臭氧减少的贡献旗鼓相当。但是在30—200 hPa,臭氧的化学损耗量与此层结的大气臭氧柱总量异常基本相当。这表明1997和2011年3月30—200 hPa的臭氧异常偏低主要是臭氧化学损耗导致的。
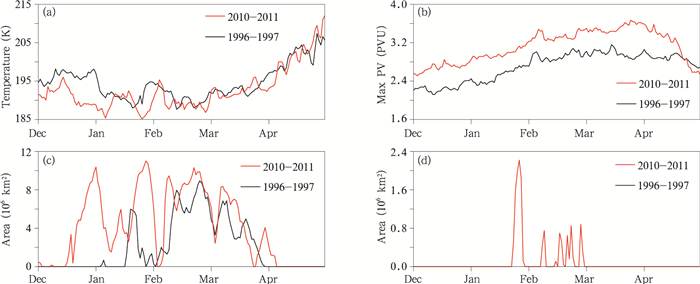
从图 2b中可以看到,3月中旬之前2011与1997年北极臭氧柱总量异常约相差20 DU。在平流层中下层区域2011年的臭氧柱总量异常明显强于1997年(图略)。根据上面的分析,这应与平流层中下层的臭氧化学损耗有关。以往的研究已表明,极地平流层中下部的温度是否足够低而形成极地平流层云是臭氧损耗程度的关键(Poole, et al,1988)。图 4a给出了2011和1997年上一年12月至当年5月北极地区30—200 hPa最低温度的变化。可以看出,2011和1997年北极中低平流层最低温度从冬季开始均表现出下降趋势,直到3月末才开始升温。以往研究也指出,2011年极涡持续异常偏强偏冷至4月初才结束(Hu, et al,2013),图 4a也表明2011年最低温度基本低于1997年。从图 4b可以看到,2010—2011年冬春季北极460 K等熵面上位涡极大值比1996—1997年位涡极大值要大将近1 PVU,表明2011年春季极涡强度强于1997年,这解释了为什么2011年北极温度比1997年更低(图 4a)。王振亚等(2004)指出,极地平流层云可以分为Ⅰ型和Ⅱ型两种。Ⅰ型极地平流层云的形成温度低于-80℃,主要成分为三水硝酸化合物;Ⅱ型极地平流层云的形成温度更低,主要由水冰组成。图 4c、d给出了这两年冬春季460 K等熵面上硝酸型极地平流层云和水冰极地平流层云的面积变化情况。可以看出,2010—2011年冬春季北极极地平流层中硝酸型极地平流层云的面积都要明显大于1996—1997年。图 4d中进一步发现,2010—2011年还有水冰极地平流层云存在。
|
| (北半球位涡极大值以及北极地区极地平流层云中三水硝酸化合物和冰核含量的日变化资料引自臭氧监测网站http://ozonewatch.gsfc.nasa.gov/meteorology/NH.html) 图 4 上一年12月至当年4月(a)30—200 hPa北极地区最低温度的时间序列,(b)460 K等熵面上北半球位涡极大值变化,(c)30—200 hPa硝酸型极地平流层云面积总和变化,(d)30—200 hPa水冰极地平流层云面积总和变化 (Information of PV, PSCs NAT Area and PSCs Ice Area are from http://ozonewatch.gsfc.nasa.gov/meteorology/NH.html) Figure 4 (a) Variations of minimum temperature between 30-200 hPa in Arctic during Dec 1996-Apr 1997 and Dec 2010-Apr 2011, and variations of maximum PV (b), PSCs NAT Area (c), and PSCs Ice Area (d) on the 460 K isentropic surface during Dec 1996-Apr 1997 and Dec 2010-Apr 2011 |
以往研究表明,极地臭氧的化学损耗主要是由于在极地平流层云粒子表面生成的臭氧损耗物活性氯的非均相化学反应(McElroy, et al,1986)所导致的,图 5进一步给出了1997和2011年北极地区(60°—90°N)30—200 hPa活性氯在上一年12月至当年5月的逐日变化。可以看出,1997和2011年北极地区中低平流层的活性氯含量从1月初开始增加,至3月中旬活性氯含量达到最大值,对比2011和1997年活性氯含量水平可见2011年3月北极中低平流层活性氯含量高于1997年3月。

|
| 图 5 1997年(a)和2011年(b)冬春季北极地区(60°—90°N)活性氯随时间变化的高度剖面以及2011年与1997年两者的差值(c) Figure 5 (a) Pressure-time cross-section of Arctic Cl during Jan 1997-Apr 1997, (b) same as (a) but for Jan 2011-Apr 2011, (c) is the difference between (b) and (a) ((b) minus (a)) |
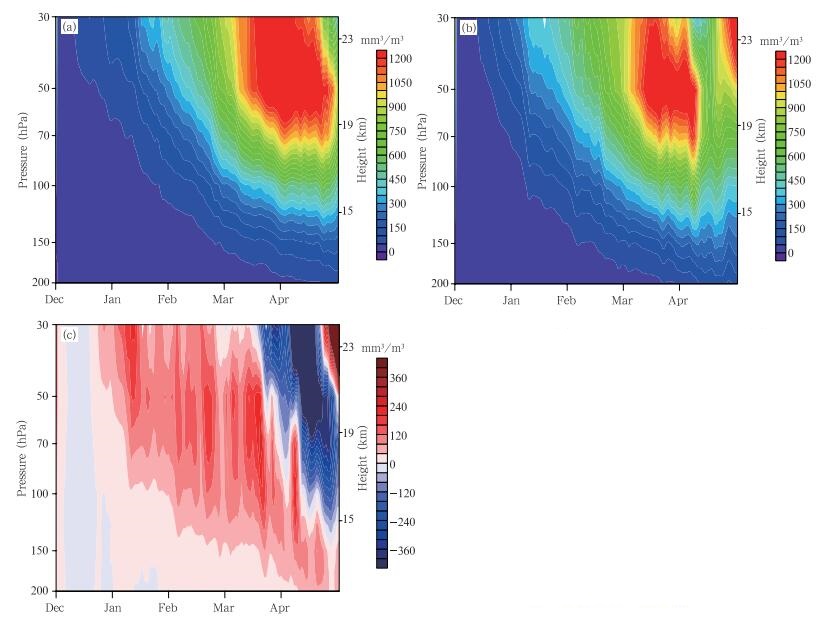
活性氯的含量代表着臭氧化学消耗的强弱。图 6给出的是北极地区(60°—90°N)30—200 hPa高度内1997和2011年臭氧化学损耗以及它们的差值(2011年减去1997年)随时间的变化。可以发现,在这两年冬春季中下平流层均发生了较强的臭氧化学损耗,文中利用MLS卫星资料对模式分析主要高度的臭氧异常现象进行了验证,MLS资料显示在2011年2和3月10—200 hPa臭氧混合比存在较大的负异常,与模式模拟结果有很好的对应(图略)。但是在3月中旬以前,2011年的臭氧化学损耗明显大于1997年(图 6a)。结合北极平流层温度和极地平流层云的形成以及极区臭氧化学损耗物活性含量可知,2011年北极中低平流层最低温度异常偏低,极涡强度强于1997年,导致当年北极上空形成了更多的硝酸型极地平流层云和对生成活性氯产生催化效率更高的Ⅱ型极地平流层云,生成了更多的活性氯,使得2011年3月中旬之前北极地区中下平流层的臭氧化学损耗强于1997年。这与图 2b结果一致,2011年3月下旬之前的大气臭氧柱总量负异常要大于1997年3月下旬之前的大气臭氧柱总量。
|
| (臭氧化学损耗量通过SLIMCAT模式中关闭化学过程的臭氧含量与不关闭化学过程的臭氧含量差值得到) 图 6 1996—1997年(a)和2010—2011年(b)冬春季北极地区(60°—90°N)臭氧化学损耗量随时间变化的高度剖面以及(b)与(a)的差值(c) (Ozone chemical loss is the difference between ozone output from SLIMCAT model without and with disabled chemistry) Figure 6 Pressure-time cross-section of Arctic ozone chemical loss during Dec 1996-Apr 1997, (b) same as (a) but for Dec 2010-Apr 2011, (c) shows the difference between (b) and (a) ((b) minus (a)) |
值得注意的是,从4月开始,1997年的化学损耗仍然很强,而2011年相对减弱,1997年明显强于2011年(图 6c)。这与图 2b显示的2011年4月以后臭氧开始快速恢复,而1997年4月以后臭氧仍然处于较大的负异常结果一致。
4 拉尼娜活动和北太平洋海温对1997和2011年北极极涡的影响前面分析了北极平流层温度的异常偏低通过化学过程损耗1997和2011年臭氧的机制,但是,导致北极平流层温度异常偏低的过程仍尚待深入研究。以往的研究指出,行星波扰动对极涡强度变化有直接的贡献,而ENSO的异常变化对行星波的扰动有重要的影响(van Loon, et al,1982;Labitzke, et al,1989;Manzini, et al,2006;García-Herrera, et al, 2006;Camp, et al,2007;Xie et al,2012, 2014a, 2014b;Zhang et al,2014, 2015)。因而文中先探究这两年极地平流层环流异常是否与ENSO活动导致的行星波活动变化有关系。
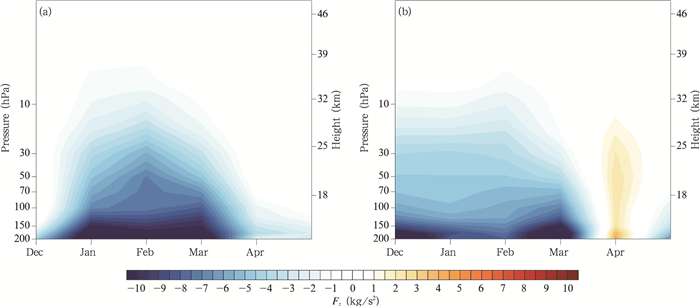
图 7为1996—1997和2010—2011年冬季北半球中纬度(45°—75°N)E-P通量垂直分量异常的高度时间分布。众所周知,1996—1997年和2010—2011年冬春季Nino3指数一直为负,表明这两年冬季同属于拉尼娜年,导致这两年E-P通量垂直分量异常偏小(图 7a、b),波活动上传异常减弱。由于中纬度上传波能量的抑制,导致极涡异常变冷和加强(图 4a),形成了北极极地平流层云(图 4c、d),促使非均相化学反应加强,产生的活性氯增加(图 5),对平流层臭氧产生了强烈的化学损耗。但是值得注意的是,2010—2011年,进入平流层的波活动从冬季12月开始就一直在减弱,而1996—1997年,减弱的行星波主要从1月才开始。这说明拉尼娜现象看上去并不足以解释这两年冬春季行星波减弱的差异,更不能完全解释2011年3月中旬之前中低平流层臭氧损耗明显强于1997年的原因。
|
| (计算E-P通量使用的U、V风场以及气温(T)则均采用NCEP的再分析资料) 图 7 1996—1997年(a)和2010—2011年(b)冬季中纬度(45°—75°N)E-P通量垂直分量异常高度时间分布 (All data used are extracted from NCEP reanalysis) Figure 7 Pressure-time cross-section of vertical component of E-P flux during Jan 1997-Apr 1997 (a) and Jan 2011-Apr 2011 (b) |
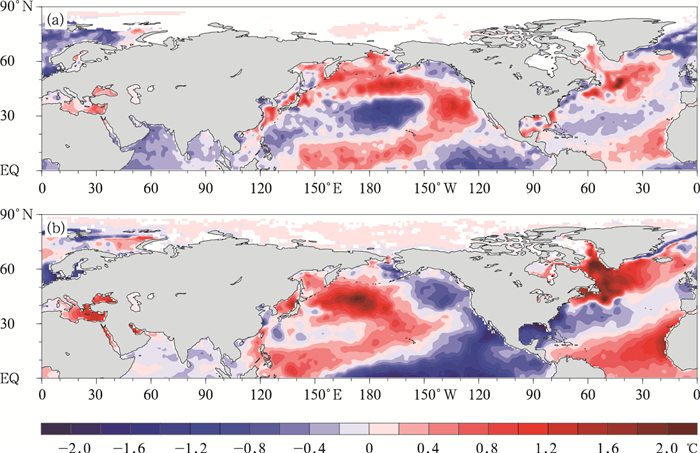
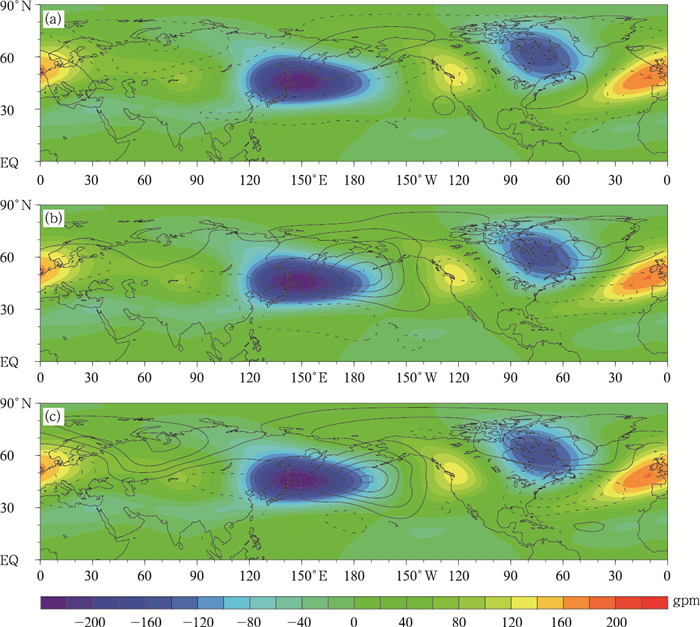
除了ENSO活动,同样对北半球波活动产生重要影响的还有北太平洋的海温(Garfinkel, et al,2015;Woo, et al,2015;Kren, et al,2016)。图 8给出了1996—1997和2010—2011年冬季北半球海温的异常分布,这两年北太平洋海温为正位相。以往研究表明,北半球海温正位相会使得北太平洋年代际振荡(NPO)负位相加强(吕庆平等,2015),阿留申低压强度会减弱。从图中可见虽然这两年冬季北太平洋地区海温均异常偏高,但2011年北太平洋地区海温异常偏高要明显强于1997年,并且1997年在北太平洋地区海温还存在较强的异常偏低现象。从图 9位势高度分布可以看出这两年冬季北太平洋地区位势高度为正异常,该区域位置对应为阿留申低压。槽区位势高度正异常,使阿留申低压以及东亚大槽减弱。在阿留申低压和东亚大槽的异常减弱情况下,西风加强,而不利于行星波的上传(Charney, et al,1961;陈文等,2006)。对比2011和1997年(图 9c),1997年冬季东亚大槽和阿留申低压减弱的强度明显小于2011年。即由于2010—2011年冬季北太平洋海温异常增强导致波上传活动减弱,进而使得当年极涡强于1997年,极区温度持续异常降低,形成了更多的硝酸型极地平流层云甚至形成了第二类极地平流层云。这使2011年臭氧损耗效率增大,中低平流层臭氧损耗异常强于1997年。
|
| (海温基于哈得来中心海温观测资料得到) 图 8 1996—1997年冬季(a)和2010—2011年冬季(b)北半球海温异常分布 (Data are from Hadley SST Center) Figure 8 Distributions of sea surface temperature anomalies in the winter of 1996-1997 (a) and 2010-2011 (b) |
|
| (位势高度资料基于NCEP再分析资料) 图 9 1996—1997年冬季(a)和2010—2011年冬季(b)北半球500 hPa位势高度异常分布(等值线代表位势高度异常值,实线代表正异常,虚线代表负异常;填充色冷色代表槽区,暖色代表脊区), (c)为(b)与(a)的差值 (Geopotential height data are extracted from NCEP reanalysis) Figure 9 Distributions of 500 hPa geopotential height anomalies in the winter of 1996-1997 (a) and 2010-2011 (b) (The contours represent the anomalies of geopotential height. Solid (dashed) lines represent positive (negative) anomalies; warm (cold) colors denote trough (ridge) regions), (c) shows the difference between (b) and (a) ((b) minus (a)) |
为了更好地说明北太平洋海温对北极臭氧的影响,图 10给出了1979—2011年冬季(DJF)北太平洋海温异常高于0.5和低于-0.5℃的年份并对这两种情况下的北半球3月臭氧混合比异常和位势涡度异常进行合成分析,可以看出当冬季北太平洋海温偏低时,北极地区极涡减弱,北极春季臭氧会表现出正异常,相反,当冬季北太平洋海温偏高时,北极极涡加强,北极地区春季臭氧会表现出负异常。

|
| (色阶为臭氧混合比,红色(蓝色)区域为正(负)异常,等值线为位势涡度异常,实线(虚线)代表正(负)异常) 图 10 基于哈得来海温资料1979—2011年冬季(DJF)北太平洋海温异常超过-0.5(a)和0.5℃(b)时合成的3月北半球臭氧混合比异常和位势涡度异常纬度-高度剖面 (The contours represent the anomalies of PV, solid (dashed) lines represent positive (negative) anomalies; The fill colors represent the anomalies of ozone mixing ratio, warm (cold) colors mean positive (negative) anomalies) Figure 10 Composite mean anomalies of ozone mixing ratio and PV in March corresponding to the period when North Pacific SST anomalies were below -0.5 ℃ (a) and over 0.5 ℃ (b) in winter during 1979-2011 |
最后一个值得注意的问题是,2011年4月平流层行星波开始迅速增加,而1997年4月并没有出现这种现象(图 7b)。Ren等(2012)的研究表明,ENSO事件除了能即时影响平流层外,其暖事件也会在11个月后引起北极极涡温度升高,极涡变弱。2010年春季发生了强的厄尔尼诺事件,这会在11个月以后导致2011年春季极涡内温度异常升高,极涡过早崩溃。而1997年春季并没有发生ENSO暖事件,当年的极涡在这时仍然维持(图略)。因此,2011年4月开始北极平流层中下层温度相比1997年迅速升高(图 4a),活性氯的生成量减少(图 5),臭氧的化学消耗减弱(图 6)。这就解释了前述留下的问题:从4月开始,1997年的化学损耗仍然很强,而2011年相对减弱,1997年明显强于2011年(图 6c)。这与图 2b显示的1997年4月以后臭氧还没有快速恢复,2011年4月以后臭氧开始快速恢复结果一致。
5 结论采用SLIMCAT化学传输模式、观测资料和再分析资料,对比分析了1997和2011年春季北极地区平流层臭氧异常偏低事件,并从化学和动力两方面分析了造成这两次事件的机制和成因。结果表明,1997和2011年同属于臭氧低谷年,这两年的3月北极地区平均大气臭氧柱总量异常偏低值量级都达到了约80 DU,是近30年臭氧异常偏低最为严重的两年。这两年中,30—200 hPa(中下平流层)区域的臭氧减少量占臭氧柱异常总量的80%。在1996—1997和2010—2011年的拉尼娜事件导致上传的行星波减少,使得北极极涡加强,平流层温度异常偏低引起更强的臭氧化学损耗。值得注意的是,对比1997和2011年不同层次臭氧异常情况发现,2011年北极地区中下平流层区域臭氧损耗要明显强于1997年,这可能与2010—2011年冬季北太平洋海温异常偏高强于1996—1997年有关。2010—2011年更强的北太平洋海温暖异常,通过减弱阿留申低压进一步减弱波活动导致极涡温度异常偏低,形成更多硝酸型极地平流层云和第二类极地平流层云,最终加速该年春季的臭氧化学损耗。
| 毕云, 陈月娟, 许利, 等. 2007. 利用HALOE资料分析中层大气中水汽和甲烷的分布特征. 大气科学, 31(3): 440–448. Bi Y, Chen Y J, Xu L, et al. 2007. Analysis of H2O and CH4 distribution characteristics in the middle atmosphere using HALOE data. Chinese J Atmos Sci, 31(3): 440–448. (in Chinese) |
| 毕云, 陈月娟, 周任君, 等. 2008. 青藏高原上空H2O和CH4的分布和变化趋势分析. 高原气象, 27(2): 249–258. Bi Y, Chen Y J, Zhou R J, et al. 2008. Study on H2O and CH4 distributions and variations over Qinghai-Xizang plateau using HALOE data. Plateau Meteor, 27(2): 249–258. (in Chinese) |
| 陈权亮, 陈月娟. 2007. 平流层剩余环流及其时间演变特征. 大气科学, 31(1): 137–144. Chen Q L, Chen Y J. 2007. Stratospheric residual circulation and its temporal and spatial evolution. Chinese J Atmos Sci, 31(1): 137–144. (in Chinese) |
| 陈权亮, 任景轩, 范广洲, 等. 2009. 行星波波动对平流层剩余环流的影响. 高原气象, 28(2): 402–410. Chen Q L, Ren J X, Fan G Z, et al. 2009. Impact of planetary wave on the stratospheric residual circulation. Plateau Meteor, 28(2): 402–410. (in Chinese) |
| 陈文, 康丽华. 2006. 北极涛动与东亚冬季气候在年际尺度上的联系:准定常行星波的作用. 大气科学, 30(5): 863–870. Chen W, Kang L H. 2006. Linkage between the Arctic Oscillation and winter climate over east Asia on the interannual timescale:Roles of quasi-stationary planetary waves. Chinese J Atmos Sci, 30(5): 863–870. (in Chinese) |
| 陈文, 魏科, 王林, 等. 2013. 东亚冬季风气候变异和机理以及平流层过程的影响. 大气科学, 37(2): 425–438. Chen W, Wei K, Wang L, et al. 2013. Climate variability and mechanisms of the East Asian winter monsoon and the impact from the stratosphere. Chinese J Atmos Sci, 37(2): 425–438. DOI:10.3878/j.issn.1006-9895.2012.12309 (in Chinese) |
| 陈月娟, 张弘, 毕训强. 1998. 南极臭氧洞对全球气候影响的数值试验. 中国科学技术大学学报, 28(6): 664–668. Chen Y J, Zhang H, Bi X Q. 1998. A numerical experiment on the impact of Antarctic ozone hole on the global climate. J China Univ Sci Technol, 28(6): 664–668. (in Chinese) |
| 陈月娟, 易明建, 毕云, 等. 2009. 平流层微量气体变化趋势的研究. 地球科学进展, 24(3): 308–319. Chen Y J, Yi M J, Bi Y, et al. 2009. A study of the trends of the trace gases in stratosphere. Adv Earth Sci, 24(3): 308–319. (in Chinese) |
| 郭世昌, 周泓, 吕达仁, 等. 2008. 平流层CH4的时空变化特征及其与O3的关系. 云南大学学报(自然科学版), 30(4): 381–387, 395. Guo S C, Zhou H, Lv D R, et al. 2008. Temporal and spatial features of atmospheric methane and its relation to ozone variation in the stratosphere. J Yunnan Univ, 30(4): 381–387, 395. (in Chinese) |
| 胡永云, 夏炎, 高梅, 等. 2008. 21世纪平流层温度变化和臭氧恢复. 气象学报, 66(6): 880–891. Hu Y Y, Xia Y, Gao M, et al. 2008. Stratospheric temperature changes and ozone recovery in the 21st century. Acta Meteor Sinica, 66(6): 880–891. DOI:10.11676/qxxb2008.080 (in Chinese) |
| 胡永云, 丁峰, 夏炎. 2009. 全球变化条件下的平流层大气长期变化趋势. 地球科学进展, 24(3): 242–251. Hu Y Y, Ding F, Xia Y. 2009. Stratospheric climate trends under conditions of global climate changes. Adv Earth Sci, 24(3): 242–251. (in Chinese) |
| 刘毅, 刘传熙. 2009. 利用WACCM-3模式对平流层动力、热力场及微量化学成分季节变化的数值模拟研究. 空间科学学报, 29(6): 580–590. Liu Y, Liu C X. 2009. Simulation studies on seasonal variations of the stratospheric dynamics and trace gases using coupled Chemistry-Climate Model WACCM-3. Chinese J Space Sci, 29(6): 580–590. DOI:10.11728/cjss2009.06.580 (in Chinese) |
| 吕达仁, 陈洪滨. 2003. 平流层和中层大气研究的进展. 大气科学, 27(4): 750–769. Lv D R, Chen H B. 2003. Advances in middle atmosphere physics research. Chinese J Atmos Sci, 27(4): 750–769. (in Chinese) |
| 吕达仁, 卞建春, 陈洪滨, 等. 2009. 平流层大气过程研究的前沿与重要性. 地球科学进展, 24(3): 221–228. Lv D R, Bian J C, Chen H B, et al. 2009. Frontiers and significance of research on stratospheric processes. Adv Earth Sci, 24(3): 221–228. (in Chinese) |
| 吕庆平, 张立凤, 戴文灏. 2015. 冬季北太平洋NPGO模态和NPO模态的耦合特征分析. 海洋预报, 32(6): 19–25. Lv Q P, Zhang L F, Dai W H. 2015. Coupling feature between the NPO mode and NPGO mode in North Pacific in winter. Mar Forecasts, 32(6): 19–25. DOI:10.11737/j.issn.1003-0239.2015.06.003 (in Chinese) |
| 施春华, 郑彬, 陈月娟, 等. 2009. 热带平流层水汽的准两年周期振荡. 地球物理学报, 52(10): 2428–2435. Shi C H, Zheng B, Chen Y J, et al. 2009. The quasi-biennial oscillation of water vapor in tropic stratosphere. Chinese J Geophys, 52(10): 2428–2435. DOI:10.3969/j.issn.0001-5733.2009.10.002 (in Chinese) |
| 王振亚, 周士康, 盛六四. 2004. 极地平流层云及其非均相化学. 化学进展, 16(1): 49–55. Wang Z Y, Zhou S K, Sheng L S. 2004. Polar stratospheric clouds and its heterogeneous chemistry. Progr Chem, 16(1): 49–55. (in Chinese) |
| 郑彬, 谷德军, 林爱兰, 等. 2007. 平流层准两年变化对南海夏季风影响机制的探讨. 中国科学D辑:地球科学, 50(9): 1424–1432. Zheng B, Gu D J, Lin A L, et al. 2007. Dynamical mechanism of the stratospheric quasi-biennial oscillation impact on the South China Sea Summer Monsoon. Sci China Ser D:Earth Sci, 50(9): 1424–1432. (in Chinese) |
| 郑彬, 施春华. 2008. 平流层准两年周期振荡对CH4双峰的影响. 热带气象学报, 24(2): 111–116. Zheng B, Shi C H. 2008. An influence of quasi-biennial oscillation on the double peaks of CH4 in the stratosphere. J Trop Meteor, 24(2): 111–116. (in Chinese) |
| Andrews D G, Holton J R, Leovy C B. 1987. Middle Atmosphere Dynamics. Orlando: Academic Press Inc: 489pp. |
| Andrews D G. 1989. Some comparisons between the middle atmosphere dynamics of the Southern and Northern Hemispheres. Pure Appl Geophys, 130(2-3): 213–232. DOI:10.1007/BF00874456 |
| Baldwin M P, Dunkerton T J. 2001. Stratospheric harbingers of anomalous weather regimes. Science, 294(5542): 581–584. DOI:10.1126/science.1063315 |
| Bian J C, Chen H B, Lu D R. 2005. Statistics of gravity waves in the lower stratosphere over Beijing based on high vertical resolution radiosonde. Sci China Ser D:Earth Sci, 48(9): 1548–1558. DOI:10.1360/03yd0512 |
| Camp C D, Tung K K. 2007. Stratospheric polar warming by ENSO in winter:A statistical study. Geophys Res Lett, 34(4). DOI:10.1029/2006GL028521 |
| Charney J G, Drazin P G. 1961. Propagation of planetary-scale disturbances from the lower into the upper atmosphere. J Geophys Res, 66(1): 83–109. DOI:10.1029/JZ066i001p00083 |
| Chen Z Y, Chen H B, Chen W, et al. 2008. Advances in the researches in middle and upper atmosphere in 2006-2008. Chinese J Space Sci, 28(5): 412–423. |
| Chipperfield M P, Santee M L, Froidevaux L, et al. 1996. Analysis of UARS data in the southern polar vortex in September 1992 using a chemical transport model. J Geophys Res, 101(D13): 18861–18881. DOI:10.1029/96JD00936 |
| Coy L, Nash E R, Newman P A. 1997. Meteorology of the polar vortex:Spring 1997. Geophys Res Lett, 24(22): 2693–2696. DOI:10.1029/97GL52832 |
| Farman J C, Gardiner B G, Shanklin J D. 1985. Large losses of total ozone in Antarctica reveal seasonal ClOx/NOx interaction. Nature, 315(6016): 207–210. DOI:10.1038/315207a0 |
| García-Herrera R, Calvo N, Garcia R R, et al. 2006. Propagation of ENSO temperature signals into the middle atmosphere:A comparison of two general circulation models and ERA-40 reanalysis data. J Geophys Res, 111(D6). DOI:10.1029/2005JD006061 |
| Garfinkel C I, Hurwitz M M, Oman L D. 2015. Effect of recent sea surface temperature trends on the Arctic stratospheric vortex. J Geophys Res, 120(11): 5404–5416. |
| Hu Y Y, Xia Y. 2013. Extremely cold and persistent stratospheric Arctic vortex in the winter of 2010-2011. Chinese Sci Bull, 58(25): 3155–3160. DOI:10.1007/s11434-013-5945-5 |
| Kren A C, Marsh D R, Smith A K, et al. 2016. Wintertime Northern Hemisphere response in the stratosphere to the Pacific decadal oscillation using the whole atmosphere community climate model. J Climate, 29(3): 1031–1049. DOI:10.1175/JCLI-D-15-0176.1 |
| Krzyścin J W. 2012. Extreme ozone loss over the Northern Hemisphere high latitudes in the early 2011. Tellus B, 64(1): 17347. DOI:10.3402/tellusb.v64i0.17347 |
| Kuttippurath J, Godin-Beekmann S, Lefèvre F, et al. 2012. Record-breaking ozone loss in the Arctic winter 2010/2011:Comparison with 1996/1997. Atmos Chem Phys, 12(15): 7073–7085. DOI:10.5194/acp-12-7073-2012 |
| Labitzke K, Van Loon H. 1989. The southern oscillation. Part IX:The influence of volcanic eruptions on the southern oscillation in the stratosphere. J Climate, 2(10): 1223–1226. DOI:10.1175/1520-0442(1989)002<1223:TSOPIT>2.0.CO;2 |
| Lefèvre F, Figarol F, Carslaw K S, et al. 1998. The 1997 Arctic Ozone depletion quantified from three-dimensional model simulations. Geophys Res Lett, 25(13): 2425–2428. DOI:10.1029/98GL51812 |
| Manney G L, Santee M L, Rex M, et al. 2011. Unprecedented Arctic ozone loss in 2011. Nature, 478(7370): 469–475. DOI:10.1038/nature10556 |
| Manzini E, Giorgetta M A, Esch M, et al. 2006. The influence of sea surface temperatures on the northern winter stratosphere:Ensemble simulations with the MAECHAM5 model. J Climate, 19(16): 3863–3881. DOI:10.1175/JCLI3826.1 |
| McElroy M B, Salawitch R J, Wofsy S C, et al. 1986. Reductions of Antarctic ozone due to synergistic interactions of chlorine and bromine. Nature, 321(6072): 759–762. DOI:10.1038/321759a0 |
| McIntyre M E. 1989. On the Antarctic ozone hole. J Atmos Terrestr Phys, 51(1): 29–43. DOI:10.1016/0021-9169(89)90071-8 |
| Molina L T, Molina M J. 1987. Production of chlorine oxide (Cl2O2) from the self-reaction of the chlorine oxide (Cl) radical. J Phys Chem, 91(2): 433–436. DOI:10.1021/j100286a035 |
| Müller R, Crutzen P J, Grooβ J U, et al. 1997. Severe chemical ozone loss in the Arctic during the winter of 1995-96. Nature, 389(6652): 709–712. DOI:10.1038/39564 |
| Poole L R, McCormick M P. 1988. Polar stratospheric clouds and the Antarctic ozone hole. J Geophys Res, 93(D7): 8423–8430. DOI:10.1029/JD093iD07p08423 |
| Prather M J. 1986. Numerical advection by conservation of second-order moments. J Geophys Res, 91(D6): 6671–6681. DOI:10.1029/JD091iD06p06671 |
| Proffitt M H, Powell J A, Tuck A F, et al. 1989. A chemical definition of the boundary of the Antarctic ozone hole. J Geophys Res, 94(D9): 11437–11448. DOI:10.1029/JD094iD09p11437 |
| Ren R C, Cai M, Xiang C Y, et al. 2012. Observational evidence of the delayed response of stratospheric polar vortex variability to ENSO SST anomalies. Climate Dyn, 38(7-8): 1345–1358. DOI:10.1007/s00382-011-1137-7 |
| Schoeberl M R, Lait L R, Newman P A, et al. 1992. The structure of the polar vortex. J Geophys Res, 97(D8): 7859–7882. DOI:10.1029/91JD02168 |
| Schulz A, Rex M, Harris N R P, et al. 2001. Arctic ozone loss in threshold conditions:Match observations in 1997/1998 and 1998/1999. J Geophys Res, 106(D7): 7495–7503. DOI:10.1029/2000JD900653 |
| Solomon S, Garcia R R, Rowland F S, et al. 1986. On the depletion of Antarctic ozone. Nature, 321(6072): 755–758. DOI:10.1038/321755a0 |
| Tabazadeh A, Santee M L, Danilin M Y, et al. 2000. Quantifying denitrification and its effect on ozone recovery. Science, 288(5470): 1407–1411. DOI:10.1126/science.288.5470.1407 |
| Tian W S, Chipperfield M P, Lü D R. 2009. Impact of increasing stratospheric water vapor on ozone depletion and temperature change. Adv Atmos Sci, 26(3): 423–437. DOI:10.1007/s00376-009-0423-3 |
| Tilmes S, Müller R, Grooβ J U, et al. 2004. Ozone loss and chlorine activation in the Arctic winters 1991-2003 derived with the tracer-tracer correlations. Atmos Chem Phys, 4(8): 2181–2213. DOI:10.5194/acp-4-2181-2004 |
| van Loon H, Zerefos C S, Repapis C C. 1982. The southern oscillation in the stratosphere. Mon Wea Rev, 110(3): 225–229. DOI:10.1175/1520-0493(1982)110<0225:TSOITS>2.0.CO;2 |
| Waibel A E, Peter T, Carslaw K S, et al. 1999. Arctic ozone loss due to denitrification. Science, 283(5410): 2064–2069. DOI:10.1126/science.283.5410.2064 |
| Woo S H, Sung M K, Son S W, et al. 2015. Connection between weak stratospheric vortex events and the Pacific Decadal Oscillation. Climate Dyn, 45(11-12): 3481–3492. DOI:10.1007/s00382-015-2551-z |
| Xie F, Tian W S, Chipperfield M P. 2008. Radiative effect of ozone change on stratosphere-troposphere exchange. J Geophys Res, 113(D7): D00B09. |
| Xie F, Li J, Tian W, et al. 2012. Signals of El Nio Modoki in the tropical tropopause layer and stratosphere. Atmos Chem Phys, 12(11): 5259–5273. DOI:10.5194/acp-12-5259-2012 |
| Xie F, Li J P, Tian W S, et al. 2014a. The relative impacts of El Nio Modoki, canonical El Nio, and QBO on tropical ozone changes since the 1980s. Environ Res Lett, 9(6): 064020. DOI:10.1088/1748-9326/9/6/064020 |
| Xie F, Li J P, Tian W S, et al. 2014b. The impacts of two types of El Nio on the global ozone variations in the last three decades. Adv Atmos Sci, 31(5): 1113–1126. DOI:10.1007/s00376-013-3166-0 |
| Zhang J K, Tian W S, Xie F, et al. 2014. Climate warming and decreasing total column ozone over the Tibetan Plateau during winter and spring. Tellus B, 66(1): 23415. DOI:10.3402/tellusb.v66.23415 |
| Zhang J K, Tian W S, Wang Z W, et al. 2015. The influence of ENSO on northern midlatitude ozone during the winter to spring transition. J Climate, 28(12): 4774–4793. DOI:10.1175/JCLI-D-14-00615.1 |
| Zhang J K, Tian W S, Chipperfield M P, et al. 2016. Persistent shift of the Arctic polar vortex towards the Eurasian continent in recent decades. Nat Climate Change, 6(12): 1094–1099. DOI:10.1038/nclimate3136 |
 2017, Vol. 75


