 2015, Vol. 73
中国气象学会主办。
文章信息
- 马嘉理, 姚秀萍. 2015.
- MA Jiali, YAO Xiuping. 2015.
- 1981—2013年6—7月江淮地区切变线及暴雨统计分析
- Statistical analysis of the shear lines and torrential rains over the Yangtze-Huaihe river region during June-July in 1981-2013
- 气象学报, 73(5): 883-894
- Acta Meteorologica Sinica, 73(5): 883-894.
- http://dx.doi.org/10.11676/qxxb2015.065
-
文章历史
- 收稿日期: 2015-01-04
- 改回日期: 2015-05-03


2. 中国气象科学研究院灾害天气国家重点实验室, 北京, 100081;
3. 中国气象局气象干部培训学院, 北京, 100081
2. State Key Laboratory on Severe Weather of Chinese Academy of Meteorological Sciences, Beijing 100081, China;
3. China Meteorological Administration Training Centre, Beijing 100081, China
每年6月中旬到7月中旬,中国长江中下游通常维持一条稳定持久的雨带,这段时期被称为梅雨季节(陶诗言等,1980;朱乾根等,1981)。梅雨季节内出现的暴雨形成是多尺度天气系统共同作用的结果(赵思雄等,2004;廖捷等,2005),其中行星尺度系统包括副热带高压、阻塞高压等,天气尺度系统包括切变线、低涡、西南急流等(陶诗言等,1979;高守亭等,2003)。
在天气尺度系统中,切变线是出现在低空(700或850 hPa)的具有气旋式切变的风的不连续线(陶诗言等,1980)。切变线附近往往伴随风的辐合,产生垂直运动,触发中尺度对流系统的发生,从而释放不稳定能量,带来暴雨(寿绍文等,2001;倪允琪等,2004;张京英等,2008;林宗桂等,2011;刘建勇等,2012)。研究发现,低空切变线附近的上升速度通常超过5 cm/s量级,如果切变线维持时间为6—12 h,则上升运动可将低层空气抬升1—2 km,从而导致强烈对流活动(陶诗言等,1980)。可见,切变线是产生暴雨的重要天气系统(朱乾根等,2000,1986a,1986b;程麟生等,2001)。
出现在中国江淮地区的切变线通常被称作江淮切变线(朱乾根等,1981,2000)。大量研究(朱乾根等,1986a,1986b;程麟生等,2001;隆霄等,2004;高守亭等,2001;寿绍文等,2003;孙建华等,2004;李柏等,2001)表明,江淮切变线是中国梅雨期的主要天气尺度影响系统。统计发现,2000—2009年淮北地区暴雨中,由暖式江淮切变线引起的暴雨约占暴雨总次数的60%(张屏等,2013),可见江淮切变线对江淮地区暴雨的形成和预报具有重要意义。
20世纪70年代,湖北省中心气象台的统计指出,在湖北省的夏半年,由江淮切变线产生的暴雨日占该省全部暴雨日数的41%,该统计进一步指出,就整个江淮地区而言,产生暴雨的切变线过程占全部切变线降水过程的76%,6—7月更是超过90%(朱乾根等,1981)。由此可见,以往的学者在切变线统计方面做了不少工作,但这些统计工作基本是基于台站资料通过手绘天气图进行的,分析的主观性较强。而如今,一方面,大气再分析资料已经被普遍应用到了业务和科研中,相比以往的台站资料,再分析资料在时、空分辨率上有所改善,有助于更客观深刻地认识大气运动(赵天保等,2010);另一方面,在气象分析软件普及的今天,计算机编程客观分析方法相比以往手绘天气图主观分析方法,在统计大样本数据时,更为便捷和客观。那么利用再分析资料通过客观分析统计江淮切变线,是否会得到新的结论呢?另外,值得关注的是,20世纪80年代以来,全球气候有变暖的趋势(任贾文等,1998;施能等,1995;陈隆勋等,1998)。例如,在70年代末和80年代初存在着明显的气候跃变,跃变前后北半球海平面气压、500 hPa位势高度和北太平洋海温结构都有明显的差异(林学椿,1998)。在这种全球气候变化的时代背景下,中国各地区的降水也发生显著的变化,例如在1976年后,夏季降水呈现华南少、长江流域多、华北少和东北地区多的分布(李春晖等,2010),1996年之后,华北和长江中下游地区降水同时减少(徐康等,2011),影响中国的多个天气系统的气候特征也发生变化,比如,蒙古气旋从1979年到2001年的频数一直在减少(王新敏等,2007),东北冷涡在20世纪80年代到90年代初在增多(孙力等,1994),江淮地区梅雨在1965年前后、70年代末至80年代初和90年代初发生了3次显著的气候跃变(胡娅敏等,2008),江淮气旋在1986年后有增多之势(刘佳颖,2012)。那么,在20世纪80年代以来的这种气候变化背景下,江淮切变线的气候态特征,如数量、演变、分布等,是否会发生变化呢?这种变化对于由江淮切变线引发的暴雨——江淮切变线暴雨,又有哪些影响呢?进一步而言,以往的统计结论是否还能准确描述20世纪80年代以来的江淮切变线及暴雨的气候态特征呢?这些问题都是未经探索的,但是有意义的。
所以,本研究利用欧洲中期天气预报中心风场再分析资料,通过编程客观分析,对1981—2013年6—7月的切变线、暴雨和切变线暴雨进行统计,通过统计20世纪80年代至今的江淮地区切变线、暴雨和切变线暴雨之间的数量关系、年际变化趋势以及切变线暴雨的频数分布和周期性特征,研究在全球气候变化背景下,江淮切变线、暴雨及切变线暴雨的气候态特征,更新江淮切变线频数、江淮暴雨频数和江淮切变线暴雨频数的统计结果,研究江淮切变线和江淮暴雨在统计意义上的关联,为提高江淮切变线暴雨的业务预报水平提供参考。
2 资料和方法2.1 资料全中国756站1981—2013年6—7月每日20时(北京时,下同)24 h降水量资料,以及欧洲中期天气预报中心(ECMWF)Re-Analysis Interim data(简称ERA-Interim资料,下同)每日4次的风场资料,空间分辨率为1°×1°。2.2 方法2.2.1 切变线的客观分析原则和方法切变线是低空(850和700 hPa)风场上具有气旋式切变的风的不连续线(朱乾根等,2000)。文中客观分析切变线时,采用纬向风的经向切变、相对涡度和纬向0风速线3个客观判据(式(1))来确定切变线。
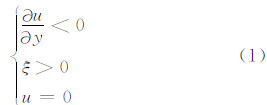
满足式(1)的点的连线即为客观分析所确定的切变线。如果南北相邻的两个格点,北部的格点对应纬向风速小于0,南部的格点对应纬向风速大于0,则切变线穿过此两点之间的某一纬向风速为0的位置,该位置可通过南北两点的纬向风速线性内插得到。
江淮地区,指湖北宜昌以东的28°—34°N的陆地地区,在大多数研究里,取范围(28°—34°N,110°—122°E)代表江淮地区(刘佳颖,2012;殷永红等,2001;胡娟等,2004;胡景高等,2013;王勇等,2011;司东等,2010)。所以文中客观分析的江淮切变线是指在范围(28°—34°N,110°—122°E)内满足上述要求的点的连线。
由于江淮切变线通常与一定范围的降水有关,属于天气尺度范畴。在客观分析时,规定东西跨度至少3°的线段才确定为江淮切变线。并且,文中仅参考850 hPa风场。
2.2.2 相关统计量的确定原则和方法所用统计量包括江淮切变线日、江淮暴雨日和江淮切变线暴雨日。定义如下:(1)江淮切变线日:在某一日中,4个时次的风场资料(02、08、14和20时)中,若至少一个时次的风场显示有江淮切变线存在,则定义该日为江淮切变线日;(2)江淮暴雨日:在江淮地区(28°—34°N,110°—122°E),如果有5个或以上的测站24 h累计降水量超过50 mm,则定义该日为江淮暴雨日;(3)江淮切变线暴雨日:若该日既是江淮暴雨日,又是江淮切变线日,且切变线位于雨区附近,则定义该日为江淮切变线暴雨日。
2.2.3 江淮地区切变线与暴雨实例示意为了直观说明统计量的制定标准,分别给出了一个江淮暴雨日、一个江淮切变线日和一个江淮切变线暴雨日的实例(图 1)。根据2.2.2中的定义可知,1994年6月23日是江淮暴雨日(图 1a);1994年6月11日是江淮切变线日(图 1b);1994年6月9日是江淮切变线暴雨日(图 1c)。
 |
| 图 1 江淮地区切变线与暴雨实例 (a.江淮暴雨日(1994年6月23日),b.江淮切变线日 (1994年6月11日),c.江淮切变线暴雨日(1994年6月9日); 长实线为客观分析的江淮切变线,风矢表示850 hPa风场,单位:m/s; 离散的符号为站点日降水量,符号意义:+:日降水量<50 mm, ●:50 mm≤日降水量<100 mm,▲:日降水量≥100 mm) Fig. 1 Illustration of the shear lines and torrential rains over the Yangtze-Huaihe river region (a.torrential rain day,23 June 1994,b.shear line day,11 June 1994.c.shear line torrential rain day,9 June 1994.The long curve indicates shear line over the Yangtze-Huaihe river region,the black wind shaft indicates wind direction and wind speed on 850 hPa surface,unit:m/s,the scattered symbols indicate daily station precipitation amount,with+:daily station precipitation amount < 50 mm,●:50 mm ≤ daily station precipitation amount < 100 mm,▲:daily station precipitation amount ≥ 100 mm) |
江淮地区暴雨的统计显示,1981—2013年6—7月33年平均的暴雨日数为30.2 d,占总天数61 d的近一半。
按照多于平均暴雨日数15%的年份为6—7月暴雨多发的年份,少于平均暴雨日数15%的年份为6—7月暴雨少发的年份,通过统计1981—2013年6—7月江淮地区暴雨日数的分布特征(图 2)可知,1983、1993、1996、2010年是6—7月暴雨多发的年份,1981、1985、1988、1994年等是6—7月暴雨少发的年份。其中,1996年是6—7月暴雨日数最多发的年份,为39 d,1988年是6—7月暴雨日数最少发的年份,仅有19 d,暴雨最多的日数与最少的日数相差20 d。
 |
| 图 2 1981—2013年6—7月江淮地区暴雨日数与非暴雨日数的分布 (水平实线表示33年6—7月的平均暴雨日数,实线上方(下方)的点划线表示多于(少于)平均暴雨日数15%的日数值) Fig. 2 Torrential rain days and non-torrential rain days over the Yangtze-Huaihe river region during June-July in 1981-2013 (Horizontal solid line depicts the 33 year averaged number of rain days,upper (lower) dot dashed line depicts the days that are 15% more (less) than the average number of rain days) |
观测结果表明,江淮地区的夏季降水存在明显的年代际变化(司东等,2010),那么江淮地区的暴雨日数是否也存在年代际变化呢?江淮地区暴雨日数的年代际变化与江淮地区降水量的年代际变化存在何种关联呢?
本研究计算6—7月江淮地区降水量时,是将站点日降水量资料插值到1°×1°的格点,然后对6—7月逐日累加,再做区域平均得到的。利用高斯低通滤波方法(龚道溢等,1999;白爱娟等,2005),提取9年以上分量作为年代际分量,对1981—2013年6—7月的江淮暴雨日数以及江淮地区降水量进行分析,发现江淮地区暴雨日数和江淮地区降水量在年代际尺度上存在关联。
从1981—2013年6—7月江淮地区暴雨日数及江淮地区降水量的逐年演变(图 3)可见,近33年,6—7月江淮地区的暴雨日数呈增长趋势(图 3虚线)。暴雨日数序列和时间序列的相关系数并未通过显著性水平检验,即江淮地区6—7月暴雨日数的年际变化趋势并不显著。2000年前,6—7月暴雨日数的年际波动较大,2000年后,6—7月暴雨日数的年际波动较小(图 3圆圈标记的实线)。暴雨日数存在一定的年代际变化特征,在20世纪80年代中期、90年代后期和2008年前后偏多,在80年代后期和2004年前后偏少(图 3无标记实线),而江淮地区降水量也体现出了一定的年代际变化特征,降水量在80年代中期、90年代后期偏多,在90年代初和2004年前后偏少,2004年以后,江淮地区降水量呈逐渐增多的年代际变化趋势(图 3点划线)。
 |
| 图 3 1981-2013年6-7月江淮地区暴雨日数及 江淮地区降水量的逐年演变 (圆圈标记的实线为江 淮暴雨日数,虚线为江淮暴雨日数的线性拟合趋势线,无标记 实线为高斯低通滤波后的江淮暴雨日数,三者均对应左侧坐标轴, 点划线为高斯低通滤波后的江淮降水量,对应右侧坐标轴)Fig. 3 Inter-annual trends of the torrential rain days and precipitation amount over the Yangtze-Huaihe river region during June-July in 1981-2013 (circle marked solid line:torrential rain days over the Yangtze-Huaihe river region, dashed line:linear annual trend line of torrential rain days over the Yangtze-Huaihe river region,unmarked solid line:the Gaussian low pass filtered torrential rain days over the Yangtze-Huaihe river region,these 3 lines share the left axis;dot dashed line:the Gaussian low pass filtered precipitation amount over the Yangtze-Huaihe river region,corresponding to the right axis in terms of scaling) |
综合以上分析可知,江淮地区降水量和暴雨日数都在20世纪80年代中期达到极大值,之后逐渐减少,在80年代末90年代初达到极小值,然后逐渐增加,在90年代末达到极大值,又再次减少,在2004年前后达到极小值,最后逐渐增加至2007年。在2007年以后,江淮地区降水量继续增加,而江淮暴雨日数在2007年前后达到极大值后又再次减少。所以,6—7月的江淮降水量和暴雨日数在1981—2013年均存在一定的年代际变化,在1981—2007年,江淮暴雨日数和江淮地区降水量的年代际变化较为一致,在2007年以后,江淮暴雨日数和江淮地区降水量的年代际变化不一致。
3.2 江淮地区切变线发生频数特征江淮地区切变线的统计显示,1981—2013年6—7月33年平均的切变线日数为33.2 d,超过总天数61 d的一半。
本研究按照多于平均切变线日数15%的年份为6—7月切变线多发的年份,少于平均切变线日数15%的年份为6—7月切变线少发的年份,通过统计1981—2013年间6—7月江淮切变线日数及演变趋势(图 4)可知,1983、1993、1999、2009年等是6—7月切变线多发的年份,1981、1985、1990、1994年是6—7月切变线少发的年份。其中1999年是6—7月切变线日数最多发的年份,为49 d,1990年是6—7月切变线日数最少发的年份,仅为17 d,切变线最多的日数与最少的日数相差32 d。
 |
| 图 4 1981-2013年6-7月江淮地区切变线 日数与非切变线日数分布 (水平实线表示 33年6-7月的平均切变线日数,实线上方(下方)的点划线 表示多于(少于)平均切变线日数15%的日数值)Fig. 4 Shear line days and non-shear line days over the Yangtze-Huaihe river region during June-July in 1981-2013 (Horizontal solid line depicts the 33 year averaged number of shear line days,upper (lower) dot dashed line depicts the days that are 15% more (less) than the average number of shear line days) |
参考3.1节的做法,对1981—2013年6—7月江淮切变线日数以及江淮地区降水量进行分析,发现江淮地区的切变线日数和江淮地区降水量在年代际尺度上存在关联。从1981—2013年6—7月江淮地区切变线日数及江淮地区降水量的逐年演变(图 5)可见,近33年,6—7月江淮地区的切变线日数呈增长的趋势(图 5虚线)。切变线日数序列和时间序列的相关系数也未通过显著性水平检验,即江淮地区6—7月切变线日数的年际变化趋势并不显著。2000年前,6—7月切变线日数的年际波动较大,2000年后,6—7月切变线日数的年际波动较小(图 5圆圈标记的实线)。切变线日数存在一定的年代际变化特征,在20世纪80年代中期、90年代后期和2009年前后偏多,在80年代后期和2004年前后偏少(图 5无标记实线)。而江淮地区降水量也体现出了一定的年代际变化特征,降水量在20世纪80年代中期、90年代后期偏多,在90年代初和2004年前后偏少,2004年以后,江淮地区降水量呈逐渐增多的年代际变化趋势(图 5点划线)。
 |
| 图 5 1981-2013年6-7月江淮地区切变线日数及 江淮地区降水量的逐年演变 (圆圈标记的实线 为江淮切变线日数,虚线为江淮切变线日数的线性拟合 趋势线,无标记实线为高斯低通滤波后的江淮切变线日数, 三者均对应左侧坐标轴,点划线为高斯低通滤波后的江淮降 水量,对应右侧坐标轴)Fig. 5 Inter-annual trends of the shear line days and precipitation amount over the Yangtze-Huaihe river region during June-July in 1981-2013 (circle marked solid line: shear line days over the Yangtze-Huaihe river region,dashed line: linear annual trend line of shear line days over the Yangtze-Huaihe river region,unmarked solid line:the Gaussian low pass filtered shear line days over the Yangtze-Huaihe river region,these 3 lines share the left axis;dot dashed line:the Gaussian low pass filtered precipitation amount over the Yangtze-Huaihe river region, corresponding to the right axis in terms of scaling) |
综合以上分析可知,江淮地区降水量和切变线日数都在20世纪80年代中期达到极大值,之后逐渐减少,在80年代末90年代初达到极小值,然后逐渐增加,在90年代末达到极大值,又再次减少,在2004年前后达到极小值,最后逐渐增加至2009年。在2009年以后,江淮地区降水量继续增加,而江淮切变线日数在2009年前后达到极大值后又再次减少。所以,6—7月的江淮降水量和切变线日数在1981—2013年均存在一定的年代际变化,在1981—2009年,江淮切变线日数和江淮地区降水量的年代际变化较为一致,在2009年以后,江淮切变线日数和江淮地区降水量的年代际变化不一致。
3.3 江淮地区切变线暴雨发生频数特征1981—2013年6—7月33年平均的切变线暴雨日数为22.0 d,超过总天数61 d的1/3。
同样,按照多于平均切变线暴雨日数15%的年份为切变线暴雨多发的年份,少于平均切变线暴雨日数15%的年份为切变线暴雨少发的年份,通过统计1981—2013年6—7月江淮切变线暴雨日数(图 6)和演变趋势(图 7)可知,1983、1989、1998、2009年等是6—7月切变线暴雨多发的年份,1981、1985、1990、1994年等是6—7月切变线暴雨少发的年份。其中1983年是6—7月切变线暴雨日数最多发的年份,为33 d,1985、1990年是6—7月切变线暴雨日数最少发的年份,仅为13 d,最多的切变线暴雨日数和最少的切变线暴雨日数相差20 d。
 |
| 图 6 1981-2013年6-7月江淮地区切变线 暴雨日数与非切变线暴雨日数的分布 (水平实线 表示33年6-7月的平均切变线暴雨日数,实线上方(下方) 的点划线表示多于(少于)平均切变线暴雨日数15%的日数值)Fig. 6 Shear line torrential rain days and non shear line torrential rain days over the Yangtze-Huaihe river region during June-July in 1981-2013 (Horizontal solid line depicts the 33 year averaged number of shear line torrential rain days,upper (lower) dot dashed line depicts the days that are 15% more (less) than the average number of shear line torrential rain days) |
 |
| 图 7 1981-2013年6-7月江淮地区切变线暴雨日数及 江淮地区降水量的逐年演变 (圆圈标记的实线 为江淮切变线暴雨日数,虚线为江淮切变线暴雨日数的线性拟合 趋势线,无标记实线为高斯低通滤波后的江淮切变线暴雨日数, 三者均对应左侧坐标轴,点划线为高斯低通滤波后的 江淮降水量,对应右侧坐标轴)Fig. 7 Inter-annual trends of the shear line torrential rain days and precipitation amount over the Yangtze-Huaihe river region during June-July in 1981-2013 (circle marked solid line:shear line torrential rain days over the Yangtze-Huaihe river region,dashed line:linear annual trend line of shear line torrential rain days over the Yangtze-Huaihe river region,unmarked solid line:the Gaussian low pass filtered shear line torrential rain days over the Yangtze-Huaihe river region,these 3 lines share the left axis;dot dashed line: the Gaussian low pass filtered precipitation amount over the Yangtze-Huaihe river region,corresponding to the right axis in terms of scaling) |
同样参考3.1节的做法,对1981—2013年6—7月的江淮切变线暴雨日数以及江淮地区降水量进行分析,发现江淮地区的切变线暴雨日数和江淮地区降水量在年代际尺度上存在关联。如图 7所示,近33年,6—7月江淮地区的切变线暴雨日数呈增长的趋势(图 7虚线)。切变线暴雨日数序列和时间序列的相关系数并未通过显著性水平检验,即江淮地区6—7月切变线暴雨日数的年际变化趋势并不显著。2000年前,6—7月切变线暴雨日数的年际波动较大,2000年后,6—7月切变线暴雨日数的年际波动较小(图 7圆圈标记的实线)。切变线暴雨日数存在明显的年代际变化特征,在20世纪80年代中期、90年代后期和2010年前后偏多;在90年代初和2004年前后偏少(图 7无标记实线);而江淮地区降水量也体现出了明显的年代际变化特征,降水量在80年代中期、90年代后期偏多,在80年代后期和2004年前后偏少,2004年以后,江淮地区降水量呈逐渐增多的年代际变化趋势(图 7点划线)。
综合以上分析可知,江淮地区降水量和切变线暴雨日数都在20世纪80年代中期达到极大值,之后逐渐减少,在80年代末90年代初达到极小值,然后逐渐增多,在90年代末达到极大值,又再次减少,在2004年前后达到极小值,最后逐渐增多至2010年。在2010年以后,江淮地区降水量继续增加,而江淮切变线暴雨日数在2010年前后达到极大值后又再次减少。所以,6—7月的江淮降水量和切变线暴雨日数在1981—2013年均存在一定的年代际变化,在1981—2010年,江淮切变线暴雨日数和江淮地区降水量的年代际变化较为一致,在2010年以后,江淮切变线暴雨日数和江淮地区降水量的年代际变化不一致。
综上所述,暴雨、切变线和切变线暴雨的日数2000年前波动较大,2000年后波动较小。6—7月江淮地区暴雨、切变线和切变线暴雨的日数在近33年里均不存在显著的年际变化趋势,但均存在一定的年代际变化特征,且三者的年代际变化特征较为一致。此外,江淮地区降水量也存在一定的年代际变化特征,在1981—2007年,江淮地区的暴雨日数、切变线日数和切变线暴雨日数的年代际变化与江淮地区降水量的年代际变化较为一致。
4 江淮地区切变线与暴雨的关系4.1 江淮地区切变线和暴雨的数量关系经过上节的统计,可知在20世纪80年代以来的一个气候态里,江淮地区暴雨日、切变线日和切变线暴雨日的天数各有不同,分别为30.2、33.2、22.0 d,进一步探讨它们之间的数量关系(图 8)可以看出,就气候态平均而言,江淮地区6—7月61 d里,暴雨日数占总天数的49.5%,接近1/2;切变线日数占总天数的54%,超过1/2;切变线暴雨日数占总天数的36.1%,超过1/3。
 |
| 图 8 1981-2013年6-7月江淮地区切变线日数、 暴雨日数与切变线暴雨日数的数量关系 (A:切变线日数33.2 d;B:暴雨日数30.2 d; C:切变线暴雨日数22.0 d)Fig. 8 Illustration of the relations among the numbers of shear line days,torrential rain days and shear line torrential rain days over the Yangtze-Huaihe river region during June and July for 1981-2013 (A:shear line day,33 days.B:torrential rain day,30.2 days. C:shear line torrential rain day,22.0 days) |
江淮地区的切变线暴雨日数占切变线日数的66.3%,切变线暴雨日数占暴雨日数的72.8%。可知,6—7月,近2/3的江淮切变线引发暴雨,近3/4的江淮暴雨是由江淮切变线引发的。
4.2 江淮地区切变线和暴雨的变化趋势及相关由上节可知,江淮地区6—7月的切变线、暴雨和切变线暴雨日数的年际增长趋势有所不同,为了进一步揭示这种差异,对上述江淮地区33年的6—7月暴雨日数、切变线日数和切变线暴雨日数的年际变化序列进行一元线性拟合。假设上述一元线性拟合的形式为Y=at+b,其中Y为气候要素(暴雨日数、切变线日数和切变线暴雨日数),t为年份,t∈[1981,2013],a和b为常数,用最小二乘法通过实际统计结果计算出a、b的值,a>0表示气候要素有增加趋势,a<0表示气候要素有减少趋势,a=0表示无变化趋势。各个气候要素拟合后的a、b值如表 1所示。
| 物理量 | 增长率 a | 截距 b | 拟合公式 |
| 切变线暴雨日 | 0.04 | -59.5 | Y=0.04 t-59.5 |
| 切变线日 | 0.12 | -212.2 | Y=0.12 t-212.2 |
| 暴雨日 | 0.11 | -189.2 | Y=0.11 t-189.2 |
可见,6—7月切变线日和暴雨日数量的年增长率分别为0.12和0.11,比切变线暴雨日数量的0.04的年增长率大一个量级。结合上节给出的各个统计量与时间的相关关系可知,江淮地区6—7月,切变线和暴雨的数量在近33年里略有增长,但增长趋势不显著,而切变线暴雨的数量基本维持不变。
另外,6—7月江淮地区切变线日数的年际序列与暴雨日数的年际序列的相关系数高达0.45,并且通过了0.01的显著性水平检验。说明江淮地区的切变线和暴雨有密切的相关关系,表明切变线日数多的年份,暴雨日数也一般较多,切变线日数少的年份,暴雨日数也一般较少。正如第3节所述,6—7月切变线暴雨日较多的年份是1983、1993、2010年等,这些年份也是切变线和暴雨相对多发的年份;切变线暴雨日数较少的年份是1985、1990、1994年等,这些年份也是切变线和暴雨相对少发的年份。
4.3 江淮地区切变线暴雨的多年候分布特征通常,6月下旬到7月上旬为江淮梅雨期降水峰值出现的时期(陶诗言等,2004),通过统计江淮切变线暴雨的候分布特征(图 9)可知,江淮切变线暴雨主要分布在6月第3候到7月第5候,最集中发生在6月第4候到7月第2候,这说明江淮切变线暴雨日数集中的时期与梅雨期是一致的,梅雨期降水以切变线引发的降水为主。
 |
| 图 9 1981—2013年6—7月江淮地区切变线暴雨日数的逐候分布Fig. 9 Statistics of the shear line torrential rain days by pentad in the Yangtze-Huaihe river region during June-July for 1981-2013 |
对6—7月江淮暴雨日频次的年际变化序列进行小波分析(图 10a)可知,1995年前,6—7月江淮切变线暴雨日数存在2—3年的周期变化,1995年后无显著周期变化。
 |
| 图 10 江淮切变线暴雨日频次的小波分析 (a.暴雨日数年际变化序列的小波分析.b.暴雨日数逐日变化序列的小波分析;等值线和填色区均表示小波系数)Fig. 10 Wavelet analysis of the shear line torrential rain days (a.inter-annual variance of occurrence frequency,b.diurnal variance of occurrence frequency;contour and shaded area both represent wavelet coefficients) |
在6—7月的61 d中,每天都可以计算得到该日在33年里出现江淮切变线暴雨的总日数,由此得到6—7月江淮切变线暴雨日数的逐日变化序列,对该序列进行小波分析(图 10b)可以看出,6月上中旬和7月中下旬,江淮切变线暴雨日数存在2—4 d的周期变化,6月下旬到7月上旬,江淮切变线暴雨日数不存在显著的周期变化,这说明在梅雨期间,江淮切变线暴雨日数稳定地维持,这与江淮切变线在梅雨期内的稳定维持有关。
总之,6—7月江淮地区的切变线和暴雨存在一定的数量关系,两者的相关性较高,切变线、暴雨和切变线暴雨日数存在不同程度的年际变化特征,切变线暴雨日数在不同的时间尺度上存在一定的周期性,切变线暴雨主要集中发生在梅雨期。
5 结论与讨论利用ERA-interim风场资料,基于纬向风的经向切变、相对涡度和纬向零风速线三个客观判据,统计分析了1981—2013年6—7月江淮地区的切变线、暴雨和切变线暴雨的气候态统计特征,得出以下结论:
(1)气候平均而言,20世纪80年代以来6—7月,有30.2 d出现了暴雨,接近1/2;33.2 d出现了切变线,超过1/2;22.0 d出现了切变线暴雨,超过1/3。江淮地区6—7月,近2/3的江淮切变线产生暴雨,近3/4的江淮暴雨是由江淮切变线引发的,这些结果更新和补充了以往的统计结果。
(2)20世纪80年代以来,6—7月江淮切变线日数、暴雨日数的年增长率略大于0.1 d,比切变线暴雨日的年增长率0.04 d大一个量级,切变线和暴雨日数有不显著的年际增长趋势,而切变线暴雨日数在近33年基本维持不变。
(3)6—7月的江淮切变线暴雨主要集中在6月第4候到7月第2候,对应于梅雨期降水最集中的时期,梅雨期降水以切变线降水为主。
(4)6—7月江淮地区的切变线、暴雨和切变线暴雨日数存在一定的年际变化,在2000年前的年际波动较大,在2000年后的年际波动较小。其中江淮切变线暴雨日数在1995年前存在2—3年的周期变化,在1995年后无显著的周期变化。6—7月江淮地区的暴雨日数、切变线日数和切变线暴雨日数均存在一定的年代际变化特征,且三者的年代际变化特征较为一致。此外,江淮地区降水量也存在一定的年代际变化特征,1981—2007年,江淮地区降水量的年代际变化与暴雨日数、切变线日数和切变线暴雨日数的年代际变化较为一致。
(5) 江淮切变线暴雨日数在6—7月存在一定的逐日变化。6月上中旬和7月中下旬,切变线暴雨日数存在2—4 d的周期变化,在6月下旬到7月上旬无显著的周期变化,切变线暴雨的日数在梅雨期内稳定维持,这与江淮切变线在梅雨期内的稳定维持有关。
致 谢:感谢中国国家气象信息中心提供降水资料。
| 白爱娟, 施能, 方建刚. 2005. 陕西省降水量变化的区域特征分析. 高原气象, 24(4): 635-641. Bai A J, Shi N, Fang J G. 2005. Analyses on regional characters of rainfall change in Shaanxi province. Plateau Meteor, 24(4): 635-641 (in Chinese) |
| 陈隆勋, 朱文琴, 王文等. 1998. 中国近45年来气候变化的研究. 气象学报, 56(3): 257-271. Chen L X, Zhu W Q, Wang W, et al. 1998. Studies on climate change in China in recent 45 years. Acta Meteor Sinica, 56(3): 257-271 (in Chinese) |
| 程麟生, 冯伍虎. 2001. “987”突发大暴雨及中尺度低涡结构的分析和数值模拟. 大气科学, 25(4): 465-478. Cheng L S, Feng W H. 2001. Analyses and numerical simulation on an abrupt heavy rainfall and structure of a mesoscale vortex during July 1998. Chinese J Atmos Sci, 25(4): 465-478 (in Chinese) |
| 高守亭, 周玉淑. 2001. 水平切变线上涡层不稳定理论. 气象学报, 59(4): 393-404. Gao S T, Zhou Y S. 2001. The instability of the vortex sheet along the horizontal shear line. Acta Meteor Sinica, 59(4): 393-404 (in Chinese) |
| 高守亭, 赵思雄, 周晓平等. 2003. 次天气尺度及中尺度暴雨系统研究进展. 大气科学, 27(4): 618-627. Gao S T, Zhao S X, Zhou X P, et al. 2003. Progress of research on sub-synoptic scale and mesoscale torrential rain systems. Chinese J Atmos Sci, 27(4): 618-627 (in Chinese) |
| 龚道溢, 王绍武. 1999. 西伯利亚高压的长期变化及全球变暖可能影响的研究. 地理学报, 54(2): 125-133. Gong D Y, Wang S W. 1999. Long-term variability of the Siberian high and the possible connection to global warming. Acta Geograph Sinica, 54(2): 125-133 (in Chinese) |
| 胡景高, 周兵, 徐海明. 2013. 近30年江淮地区梅雨期降水的空间多型态特征. 应用气象学报, 24(5): 554-564. Hu J G, Zhou B, Xu H M. 2013. Characteristics of multi-patterns of precipitation over the Yangtze-Huaihe Basins during Meiyu season in recent 30 years. J Appl Meter Sci, 24(5): 554-564 (in Chinese) |
| 胡娟, 王谦谦. 2004. 我国江淮地区5—7月降水异常的区域特征. 南京气象学院学报, 27(4): 495-501. Hu J, Wang Q Q. 2004. Regional characteristics of precipitation anomaly from May to July over Yangtze-Huaihe river region in China. J Nanjing Inst Meteor, 27(4): 495-501 (in Chinese) |
| 胡娅敏, 丁一汇, 廖菲. 2008. 江淮地区梅雨的新定义及其气候特征. 大气科学, 32(1): 101-112. Hu Y M, Ding Y H, Liao F. 2008. A study of updated definition and climatological characters of Meiyu season in the Yangtze-Huaihe region. Chinese J Atmos Sci, 32(1): 101-112 (in Chinese) |
| 李柏, 曹性善, 周昆等. 2001. 江淮梅雨锋暴雨过程中尺度系统的演变及结构特征分析与研究. 气候与环境研究, 6(2): 168-172. Li B, Cao X S, Zhou K, et al. 2001. The analysis and research to the evolution and structure characters of the mesoscale systems during the Meiyu front heavy rain processes. Climatic Environ Res, 6(2): 168-172 (in Chinese) |
| 李春晖, 万齐林, 林爱兰等. 2010. 1976年大气环流突变前后中国四季降水量异常和温度的年代际变化及其影响因子. 气象学报, 68(4): 529-538. Li C H, Wan Q L, Lin A L, et al. 2010. The interdecadal contrast characteristics of the rainfall and temperature in China around the atmospheric circulation carastrophe in 1976 and its affecting factors. Acta Meteor Sinica, 68(4): 529-538 (in Chinese) |
| 廖捷, 谈哲敏. 2005. 一次梅雨锋特大暴雨过程的数值模拟研究: 不同尺度天气系统的影响作用. 气象学报, 63(5): 771-789. Liao J, Tan Z M. 2005. Numerical simulation of a heavy rainfall event along the Meiyu front: Influences of different scale weather systems. Acta Meteor Sinica, 63(5): 771-789 (in Chinese) |
| 林学椿. 1998. 70年代末、80年代初气候跃变及其影响//中国科学院大气物理研究所. 东亚季风和中国暴雨. 北京: 气象出版社, 240-249. Lin X C. 1998. Abrupt Climate Change during the Late 1970s and Early 1980s and Its Impact // Institute of Atmospheric Physics, Chinese Academy of Sciences. East Asian Monsoon and Torrential Rain in China. Beijing: China Meteorological Press, 240-249 (in Chinese) |
| 林宗桂, 林开平, 李耀先等. 2011. 一个高空槽前中尺度对流系统发生发展过程和机制研究. 气象学报, 69(5): 770-781. Lin Z G, Lin K P, Li Y X, et al. 2011. A study of the development process of a mesoscale convective system ahead of a upper level trough and its mechanism. Acta Meteor Sinica, 69(5): 770-781 (in Chinese) |
| 刘佳颖. 2012. 江淮气旋气候学特征的研究[D].南京:南京信息工程大学, 66pp. Liu J Y. 2012. Study on Climatic Characteristics of Jiang-Huai Cyclone[D]. Nanjing: Nanjing University of Information Science and Technology, 66pp (in Chinese) |
| 刘建勇, 谈哲敏, 张熠. 2012. 梅雨期3类不同形成机制的暴雨. 气象学报, 70(3): 452-466. Liu J Y, Tan Z M, Zhang Y. 2012. Study of the three types of torrential rains of different formation mechanism during the Meiyu period. Acta Meteor Sinica, 70(3) 452-466 (in Chinese) |
| 隆霄, 程麟生. 2004. “99·6”梅雨锋暴雨低涡切变线的数值模拟和分析. 大气科学, 28(3): 342-356. Long X, Cheng L S. 2004. Numerical simulation and analysis for "99·6" Meiyu front rainstorm and the low vortex with shear line. Chinese J Atmos Sci, 28(3): 342-356 (in Chinese) |
| 倪允琪, 周秀骥. 2004. 中国长江中下游梅雨锋暴雨形成机理以及监测与预测理论和方法研究. 气象学报, 62(5): 647-662. Ni Y Q, Zhou X J. 2004. Study for formation mechanism of heavy rainfall within the Meiyu front along the middle and downstream of Yangtze river and theories and methods of their detection and prediction. Acta Meteor Sinica, 62(5): 647-662 (in Chinese) |
| 任贾文, 秦大河, 井哲帆. 1998. 气候变暖使珠穆朗玛峰地区冰川处于退缩状态. 冰川冻土, 20(2): 179-182. Ren J W, Qin D H, Jing Z F. 1998. Climatic warming causes the glacier retreat in Mt. Qomolangma. J Glaciol Geocryol, 20(2): 179-182 (in Chinese) |
| 施能, 陈家其, 屠其璞. 1995. 中国近100年来4个年代际的气候变化特征. 气象学报, 53(4): 431-439. Shi N, Chen J Q, Tu Q P. 1995. 4-Phase climate change features in the last 100 years over China. Acta Meteor Sinica, 53(4): 431-439 (in Chinese) |
| 寿绍文, 励申申, 张诚忠等. 2001. 梅雨锋中尺度切变线雨带的动力结构分析. 气象学报, 59(4): 405-413. Shou S W, Li S S, Zhang C Z, et al. 2001. The dynamical structure of a mesoscale shear-line rain belt on Meiyu-front. Acta Meteor Sinica, 59(4): 405-413 (in Chinese) |
| 寿绍文, 励申申, 姚秀萍. 2003. 中尺度气象学. 北京: 气象出版社, 370pp. Shou S W, Li S S, Yao X P. 2003. Mesoscale Meteorology. Beijing: China Meteorological Press, 370pp (in Chinese) |
| 司东, 丁一汇, 柳艳菊. 2010. 中国梅雨雨带年代际尺度上的北移及其原因. 科学通报, 55(1): 68-73. Si D, Ding Y H, Liu Y J. 2010. Decadal northward shift of the Meiyu belt and the possible cause. Chinese Sci Bull, 55(1): 68-73 (in Chinese) |
| 孙建华, 张小玲, 齐琳琳等. 2004. 2002年中国暴雨试验期间一次低涡切变上发生发展的中尺度对流系统研究. 大气科学, 28(5): 675-691. Sun J H, Zhang X L, Qi L L, et al. 2004. A study of vortex and its mesoscale convective system during China heavy rainfall experiment and study in 2002. Chinese J Atmos Sci, 28(5): 675-691 (in Chinese) |
| 孙力, 郑秀雅, 王琪. 1994. 东北冷涡的时空分布特征及其与东亚大型环流系统之间的关系. 应用气象学报, (3): 297-303. Sun L, Zheng X Y, Wang Q. 1994. The climatological characteristics of northeast cold vortex in China. Quart J Appl Meter, 5(3): 297-303 (in Chinese) |
| 陶诗言, 丁一汇, 周晓平. 1979. 暴雨和强对流天气的研究. 大气科学, 3(3): 227-238. Tao S Y, Ding Y H, Zhou X P. 1979. The present status of the research on rainstorm and severe convective weathers in China. Sci Atmos Sinica, 3(3): 227-238 (in Chinese) |
| 陶诗言等. 1980. 中国之暴雨.北京: 科学出版社, 1-10. Tao S Y, et al . 1980. Torrential Rain in China. Beijing: Science Press, 1-10 (in Chinese) |
| 陶诗言, 张小玲, 张顺利. 2004. 长江流域梅雨锋暴雨灾害研究. 北京: 气象出版社, 1-23. Tao S Y, Zhang X L, Zhang S L. 2004. A Study on the Disasters of Heavy Rainfalls over the Yangtze River Basin in the Meiyu Period. Beijing: China Meteorological Press, 1-23 (in Chinese) |
| 王新敏, 江志红, 翟盘茂等. 2007. 蒙古气旋的气候特征及变化研究. 气象与环境科学, 30(1): 35-38. Wang X M, Jiang Z H, Zhai P M, et al. 2007. Study on climatic characteristics and variation of Mongolia cyclone. Meteor Environ Sci, 2007, 30(1): 35-38 (in Chinese) |
| 王勇, 李清泉, 沈新勇. 2011. 近50 a江淮地区6—7月降水特征分析. 气象科学, 31(1): 73-78. Wang Y L, Li Q Q, Shen X Y. 2011. The characteristics of summer rainfall in the Yangtze-Huaihe river basin in June and July of the recent 50 a. J Meteor Sci, 2011, 31(1): 73-78 (in Chinese) |
| 徐康, 何金海, 祝从文. 2011. 近50年中国东部夏季降水与贝加尔湖地表气温年代际变化的关系. 气象学报, 69(4): 570-580. Xu K, He J H, Zhu C W. 2011. The interdecadal linkage of the summer precipitation in eastern China with the surface air temperature over Lake Baikal in the past 50 years. Acta Meteor Sinica, 69(4): 570-580 (in Chinese) |
| 殷永红, 倪允琪, 史历. 2001. 江淮流域夏季降水异常及与全球中低纬海温异常关系的诊断研究. 南京大学学报(自然科学版), 37(3): 358-368. Yin Y H, Ni Y Q, Shi L. 2001. Diagnostic study of summer rainfall anomaly in Changjiang-Huaihe valley and its relationship with the global mid-low latitude sea surface temperature anomaly. J Nanjing Univ (Nat Sci), 37(3): 358-368 (in Chinese) |
| 张京英, 张可欣, 魏玉鹏. 2008. 一次江淮切变线系统结构和暴雨分析. 山东气象, 28(4): 1-6. Zhang J Y, Zhang K X, Wei Y P. 2008. Analysis on a shear line structure and torrential rain. J Shandong Meteor, 28(4): 1-6 (in Chinese) |
| 张屏, 周后福, 汪付华等. 2013. 淮北夏季暖式切变线暴雨特征及其预报预警. 安徽师范大学学报(自然科学版), 36(4): 367-371. Zhang P, Zhou H F, Wang F H, et al. 2013. Summer warm wind shear rainstorm characteristic and forecast warning in Huaibei. J Anhui Normal Univ (Nat Sci), 36(4): 367-371 (in Chinese) |
| 赵思雄, 陶祖钰, 孙建华等. 2004. 长江流域梅雨锋暴雨机理的分析研究. 北京: 气象出版社, 281pp. Zhao S X, Tao Z Y, Sun J H, et al. 2004. Analysis on the Mechanism of Meiyu Front Heavy Rainfalls over Yangtze River Region. Beijing: China Meteorological Press, 281pp (in Chinese) |
| 赵天保, 符淙斌, 柯宗建等. 2010. 全球大气再分析资料的研究现状与进展. 地球科学进展, 25(3): 242-254. Zhao T B, Fu C B, Ke Z J, et al. 2010. Global atmosphere reanalysis datasets: Current status and recent advances. Adv Earth Sci, 25(3): 242-254 (in Chinese) |
| 朱乾根, 林锦瑞, 寿绍文. 1981. 天气学原理和方法. 北京: 气象出版社, 371pp. Zhu Q G, Lin J R, Shou S W. 1981. The Principle and Method of Weather. Beijing: China Meteorological Press, 371pp (in Chinese) |
| 朱乾根, 周军. 1986a. 江淮地区急流切变线暴雨的物理机制及诊断分析. 南京气象学院学报, (4): 315-324. Zhu Q G, Zhou J. 1986a. Physical mechanism and diagnosis of rainstorms associated with the jet stream and shearline over the Changjiang-Huaihe valley. J Nanjing Inst Meteor, (4): 315-324 (in Chinese) |
| 朱乾根, 周军. 1986b. 急流切变线暴雨的诊断分析. 气象, 12(6): 2-6. Zhu Q G, Zhou J. 1986b. Diagnostic analysis on jet stream shear line heavy rainfall. Meteor Mon, 12(6): 2-6 (in Chinese) |
| 朱乾根, 林锦瑞, 寿绍文. 2000. 天气学原理和方法. 北京: 气象出版社, 649pp. Zhu Q G, Lin J R, Shou S W. 2000. The Principle and Method of Weather. Beijing: China Meteorological Press, 649pp (in Chinese) |