文章信息
- 李润雪, 李春保, 贾晓楠, 许芊芊, 吴菊清
- LI Runxue, LI Chunbao, JIA Xiaonan, XU Qianqian, WU Juqing
- 猪胴体不同冷链运输条件下微生物变化
- The microbial changes of pig carcass under different cold chain transportation conditions
- 南京农业大学学报, 2020, 43(5): 959-968
- Journal of Nanjing Agricultural University, 2020, 43(5): 959-968.
- http://dx.doi.org/10.7685/jnau.201912045
-
文章历史
- 收稿日期: 2019-12-24
肉类富含蛋白质, 有利于微生物生长[1]。宰后猪胴体的体表温度高达30 ℃, 中心温度则为38~40 ℃, 丰富的营养及适宜的温度为微生物生长提供了极佳的环境条件。为了避免败坏及质量损失, 欧盟早在1964年就已经规定, 宰后猪胴体必须立即预冷至中心温度低于7 ℃, 并在运输过程中不得高于此温度[2]。目前, 对于冷却肉的概念界定则更加严格。冷却肉是指严格执行兽医检疫制度, 对屠宰后的胴体迅速进行冷却处理, 使胴体温度(以后腿肉中心为测量点)在24 h内降为0~4 ℃, 并在后续加工、流通和销售过程中始终在0~4 ℃的冷链下保存的肉品[3]。由于卫生条件改善, 为了节约成本, 也有工厂设置装载中心温度为15 ℃, 表面温度7 ℃的猪胴体通过运输过程持续冷藏预冷以达到冷却肉的标准[2]。
冷链在减缓微生物繁殖, 保障肉品质量安全方面具有重要意义[4], 但是, 冷链运输并不能彻底解决微生物隐患, 低温条件下微生物仍能存活并缓慢生长, 冷链中断或温度波动过大仍会造成由微生物引起的食品败坏, 对消费者的安全健康存在潜在威胁[5]。而实际生产中冷链运输面临着季节交替气温波动大、长距离运输制冷效果不均一等严峻考验[6]。非洲猪瘟的冲击使生猪跨省运输不再可行, 今后胴体冷链运输将成为猪肉流通的主要形式。但我国猪与禽的冷链物流仍处于起步阶段, 物流运输过程中的监控体系目前还不完善, 无法保证运输过程中胴体质量, 不同运输线路胴体安全性、质量均一性均有待进一步研究。
国外冷链起步早且发展迅速, 目前法国有74.5%的冷链运输时间为6~30 h, 超过30 h的占15.4%, 基本实现了猪胴体的长距离冷链运输; Merai等[7-8]研究证实在历经9 h的运输过程后所有胴体的温度均符合要求, 运输所用半挂车具有足够的换热能力来保持温度恒定。加拿大已经具备较为成熟的四步冷链法, 确保冷链不间断且冷链期间的温度波动控制在合适的范围内, 已经能够在全国范围内模拟冷链运输系统[9]。
目前, 我国并未针对猪胴体冷链运输制定统一规范的强制性执行标准, 在实际生产中猪胴体的冷链运输操作是否规范, 猪胴体冷链运输肉品质量情况是否能在季节交替气温波动大的情况下维持稳定, 不同运输距离肉品质量是否能保持稳定, 是否对冷藏车的温度设有监控, 中心温度超过预警是否及时反馈并采取应急处理措施, 猪胴体从出厂到销售过程中微生物状况是否达标, 这些均需要更全面且广泛的调查研究。
本研究调查了某公司从物流中心到各城市中转中心运输过程中猪胴体中心温度和车厢温、湿度的变化, 对从出厂到各城市物流中转中心再到销售终端这一流通过程中猪胴体表面的菌落总数进行跟踪研究, 同时监测试验期间的空气温、湿度变化, 并对该公司冷链运输操作的规范性进行评估, 旨在为猪胴体冷链流通规范操作提供技术支撑。
1 材料与方法 1.1 仪器与试剂导轨式吊挂猪胴体F类冷藏车, 车厢内部尺寸为9 m×2 m×2 m, 四周为泡沫填充铝合金厢体, 厚度为90 mm, 厢体内部制冷机尺寸为1.8 m×0.4 m×0.4 m。
GPRS远程温湿度记录仪(山东仁科测控技术有限公司), 参数为:4个温度探头, 线长8 m; 温度测量范围:-40~80 ℃, 误差:±0.5 ℃, 精度:±0.3 ℃; 湿度测量范围:0~100%, 误差:±3%, 精度:±2%;采样间隔:5 s~12 h。
插入式食品中心USB数据存储温度记录仪(深圳市源恒通科技有限公司), 参数为:测量范围-40~125 ℃, 精度±0.1 ℃, 测量误差±0.5 ℃, 采样间隔2 s~24 h。
平板计数琼脂(PCA)和蛋白胨购自北京奥博星生物技术有限责任公司; 无菌拭子购自江苏省长丰医疗实业有限公司。
1.2 试验方法 1.2.1 车厢温、湿度测量在装货前, 在车厢前部固定GPRS远程温、湿度记录仪, 把4个探头分别固定在车厢左、右的前、中、后部, 车辆装载猪胴体, 记录仪留置车上实时测量并记录200、300、400、500 km距离各组运输过程中车厢温、湿度变化, 每组采集3辆冷藏车。
1.2.2 猪胴体中心温度测量在离制冷机较远的车厢后部随机选取3~5头猪胴体, 在后腿肉部位插入并固定插入式中心温度记录仪, 打开记录仪使其在运输过程中实时测量并持续自动记录猪胴体中心温度, 每个距离组采集3辆冷藏车。
1.2.3 菌落总数计数分别选择工厂装载猪胴体(工厂起点)、物流中心卸载猪胴体(物流中心)和销售门店售卖猪肉(销售终端)这3个运输节点进行采样, 用装有蛋白胨溶液的拭子擦拭猪胴体, 采集猪胴体表面微生物。每头猪胴体设置5个采样点:内侧表面后臀部(内臀)、腹部(内腹)、颈部(内颈)以及外侧表面臀部(外臀)、肩部(外肩), 每个采样点擦取面积100 cm2, 每天累计采样20~30个, 共4~6头猪胴体, 累计采样3 d。采用文献[10]的方法测定菌落总数。在各距离组物流中转中心、销售终端分别重复上述操作, 连续3 d采样, 监测菌落总数变化。
1.2.4 Illumina PE250高通量测序将采集的部分样品送上海凌恩生物科技有限公司, 进行16S rRNA高通量测序与微生物多样性分析, 共9个处理组, 每组10个样品。
1.3 数据统计分析采用方差分析评价运输距离对测定指标的影响, 采用Duncan ’ s多重比较法分析各组之间的差异显著性, 数据处理采用SAS 8.1软件。空气温、湿度和车厢温、湿度(车厢为密闭空间, 车厢温、湿度区别于空气温、湿度, 一定程度上反映运输过程中制冷效果)以及猪胴体中心温度与菌落总数间的相关性采用Pearson双侧相关性分析方法。车厢温、湿度和猪胴体温度绘图采用GraphPad Prism 8软件, 聚类分析绘图采用R语言软件, 主成分分析绘图采用SIMCA 14.1软件。
2 结果与分析 2.1 冷链运输过程中车厢温、湿度变化由图 1可见:除500 km组外, 各组冷藏车温度都低于12 ℃, 且运输过程温度波动较小, 呈平稳恒定或缓慢下降趋势, 冷链运输操作基本达标。按照工厂规定, 冷藏车运输过程中应维持在(6±2)℃范围内, 实际生产中不同运输车装载胴体数量、胴体低高温占比、新旧程度、制冷能力、车厢密闭性等因素不一致且无法统一, 造成各线路间温度略有差异。500 km组温度明显高出其他运输组, 结合肉温情况推测可能是500 km组车辆中装载的热鲜肉占比高, 同样开启制冷的情况下热鲜肉占比高的冷藏车车厢温度高于其他组, 但微生物结果表明, 菌落总数仍处于安全范围, 无安全风险[11], 且热鲜肉运输在本研究中属于个案, 只是偶然因素并非常态。

|
图 1 不同运输距离冷藏车运输期间温度和湿度变化 Fig. 1 Change of temperature and humidity during different cold chain transportation distances 图中的时间为猪胴体装载完成至开始卸货的完整时长, 包括运输及等待卸货的时间。下同。 The time in the figure is the complete time from the completion of loading of pig carcasses to the beginning of unloading, including the time of transportation and waiting for unloading. The same as follows. |
不同组车厢内湿度存在明显差异, 但均呈先上升后逐渐平稳的趋势, 原因是密闭车厢内猪胴体与空气进行热量及水分交换直至湿度达平衡状态, 500 km组装载热鲜肉占比高, 运输过程中水分蒸发多, 平衡湿度高于其他组。
2.2 冷链运输过程中猪胴体中心温度变化如图 2所示:200、300和400 km组的初始温度都符合冷却肉冷链运输的条件和特征。对于500 km组, 胴体温度高达34 ℃, 说明装车前没有经过预冷却处理; 运输过程中冷藏车的较低温度(12~15 ℃)使胴体温度明显下降, 到达销售终端时, 胴体温度仍在25 ℃, 属于热鲜肉。
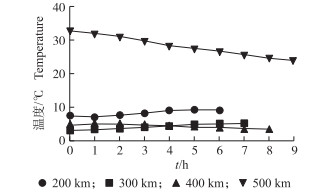
|
图 2 不同运输距离冷藏车运输期间猪胴体中心温度变化 Fig. 2 Temperature changes in the center of the pig carcass of different cold chain transportation distances |
如图 3所示:起点猪胴体外肩的菌落总数最多, 内腹菌落总数最少, 且与其余3个部位之间差异显著(P < 0.05)。可能内腹排骨位置有光滑筋膜覆盖且肋骨呈半月形弧度, 在一定程度上阻隔了外界微生物的污染; 而外肩处于吊挂方向的下端, 冷凝水较多, 胴体表面较潮湿, 且肩部容易剐蹭到外部环境而污染更多微生物。
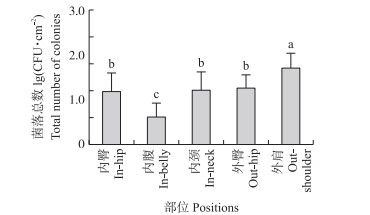
|
图 3 工厂起点猪胴体不同部位表面菌落总数 Fig. 3 Total number of colonies on the surface at different positions of pig carcasses in factory staring point 不同字母表示差异显著(P < 0.05)。下同。 Different letters indicate significant differences at 0.05 level. The same as follows. |
如图 4所示:随着运输距离的增加, 不同部位菌落总数增加且各部位间差异逐渐缩小, 最终各部位菌落总数无显著差异。200 km距离组与工厂起点相似, 各部位菌落总数差异较为明显, 同样内腹部位菌落总数最少, 但300、400和500 km组经长距离运输后各部位菌落总数差异性逐渐缩小至各部位无显著差异, 原因可能是运输过程中猪胴体间互相挤压、碰撞、摩擦造成各部位间微生物的交叉污染。
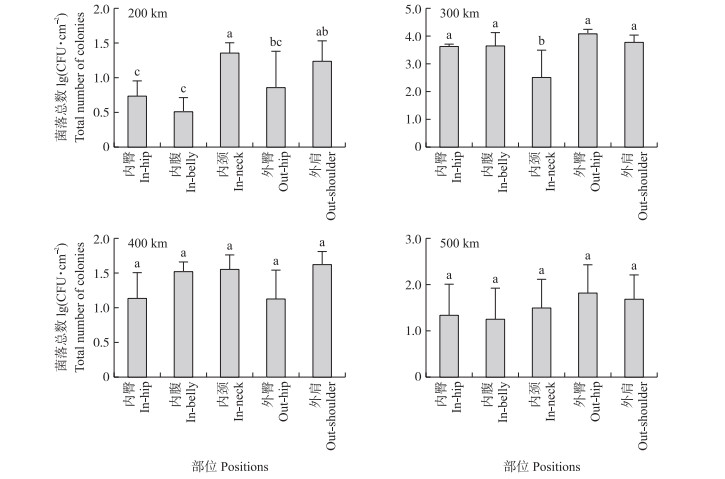
|
图 4 不同运输距离组猪胴体不同部位表面菌落总数 Fig. 4 Total number of colonies on the surface of pig carcasses at different positions in different transport distances groups |
如图 5所示:物流中心与工厂起点相比, 运输距离为200 km组菌落总数最少, 与工厂起点无显著差异, 其余各组与工厂起点均存在显著差异; 销售终端与物流中心相比, 200和500 km组销售终端菌落总数均显著高于同距离组物流中心。500 km组菌落总数偏低, 且销售终端与物流中心相比无显著差异, 可能由于冷藏车中存在的主要是噬冷菌, 而胴体温度高, 导致噬冷菌不能很好生长[4]。另外, 各运输距离组所处终点城市不同, 各城市物流中转中心卫生条件、运输所用冷藏车及销售终端分割操作工具卫生状况略有不同, 对试验结果有一定程度影响。

|
图 5 物流中心及销售终端不同运输距离组猪胴体表面菌落总数 Fig. 5 Total number of colonies on the surface of pig carcasses in different transportation distance groups of logistics center and sale terminal *表示不同距离物流中心与工厂起点差异显著(P < 0.05)。不同字母表示相同距离物流中心与销售终端菌落总数差异显著(P < 0.05)。 * indicates significant differences between logistics center and factory starting point at different distances at 0.05 level. Different letters indicate that the total number of colonies in the logistics center and the sale terminal at the same distance are significantly different at 0.05 level. |
相关性分析(表 1)表明, 试验期间空气湿度与菌落总数呈显著正相关关系, 与以往经验相符[7]。车厢温度、猪胴体中心温度与菌落总数无显著相关性。
| 参数Parameters | 菌落总数Total number of colonies |
| 车厢温度Car temperature | 0.093 |
| 车厢湿度Car humidity | -0.001 |
| 肉温Core temperature of the carcass | 0.082 |
| 空气温度Air temperature | -0.037 |
| 空气湿度Air humidity | 0.336** |
| 注:* *P < 0.01. | |
从图 6可看出:400 km组冷藏车车厢温度、猪肉胴体温度控制较好, 400 km组菌落总数与300 km组无显著差异, 证明车厢温度低有利于控制猪胴体表面微生物生长。500 km组因车厢温度及肉温较高(图中红色较深区块)而与200、300、400 km组区分开; 但500 km组试验期间空气温度较低, 最终500 km组微生物结果仍较低; 400、300、200 km组最终被大致分为3组, 其中400 km组车厢温度、车厢湿度、肉温、空气湿度的状况较好, 出现的蓝色区块较多; 200 km组空气湿度的状况也较好, 菌落总数呈现所有组中最低的状况。
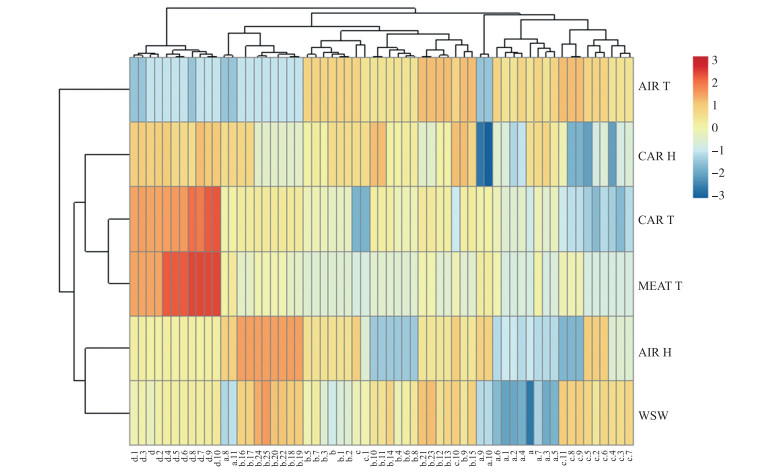
|
图 6 不同运输距离组各参数及猪胴体表面菌落总数聚类图 Fig. 6 Cluster diagram of each parameter and total number of colonies on the surface of pig carcasses in different transport distance groups 图中每列字母表示不同距离组, a、b、c、d分别表示200、300、400、500 km组, 其后的数字表示试验重复数; 每行表示1个运输参数, 依次为:空气温度(AIR T)、车厢湿度(CAR H)、车厢温度(CAR T)、肉温(MEAT T)、空气湿度(AIR H)、菌落总数(WSW)。下同。 The letters in each column in the figure represent different distance groups, a, b, c, and d represent 200, 300, 400, and 500 km groups respectively, the following numbers indicate the number of repetitions; each line represents a transport parameter, in order:air temperature(AIR T), car humidity(CAR H), car temperature(CAR T), meat temperature(MEAT T), air humidity(AIR H), total number of colonies(WSW). The same as follows. |
试验中所监测的影响因素聚类分为3组:空气温度, 车厢温、湿度和肉温, 空气湿度。空气温度、湿度属不可控外部环境因素, 试验期间空气温度明显区别于车厢温度, 结合相关性分析结论, 认为试验期间空气温度对菌落总数结果影响最小, 而空气湿度与菌落总数呈正相关关系, 与图 6结论一致。另外一组影响因素车厢温度、湿度、肉温, 则为冷链运输过程中控制的主要参数, 这3个影响因素被聚类为一组则证明冷链运输参数对菌落总数的影响区别于环境因素。
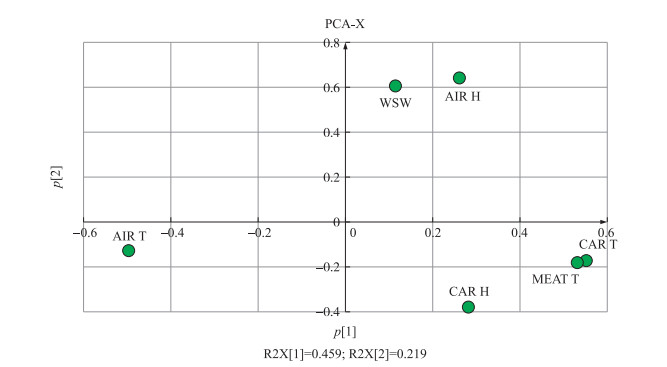
2.5 不同运输距离主成分分析由图 7可见:除200、300 km组部分数据离散外, 其余各距离组分隔较远且聚集明显, 故各组之间差异明显且分类较清晰。图 8中各因素对图 7各组数据的分布影响与上述聚类结果较吻合, 500 km组肉温、车厢温度较高, 故500 km组数据在图 7中越靠近右侧, 证明肉温、车厢温度、车厢湿度等因素对各组的分类结果影响较大。

|
图 7 不同运输距离组主成分分析图 Fig. 7 Principal component analysis(PCA)chart for different transportation distance groups |
|
图 8 空气温、湿度, 车厢温、湿度, 肉温及菌落总数等因素主成分分析图 Fig. 8 Principal component analysis(PCA)of factors such as air temperature and humidity, cabin temperature and humidity, meat temperature and total number of microorganisms |
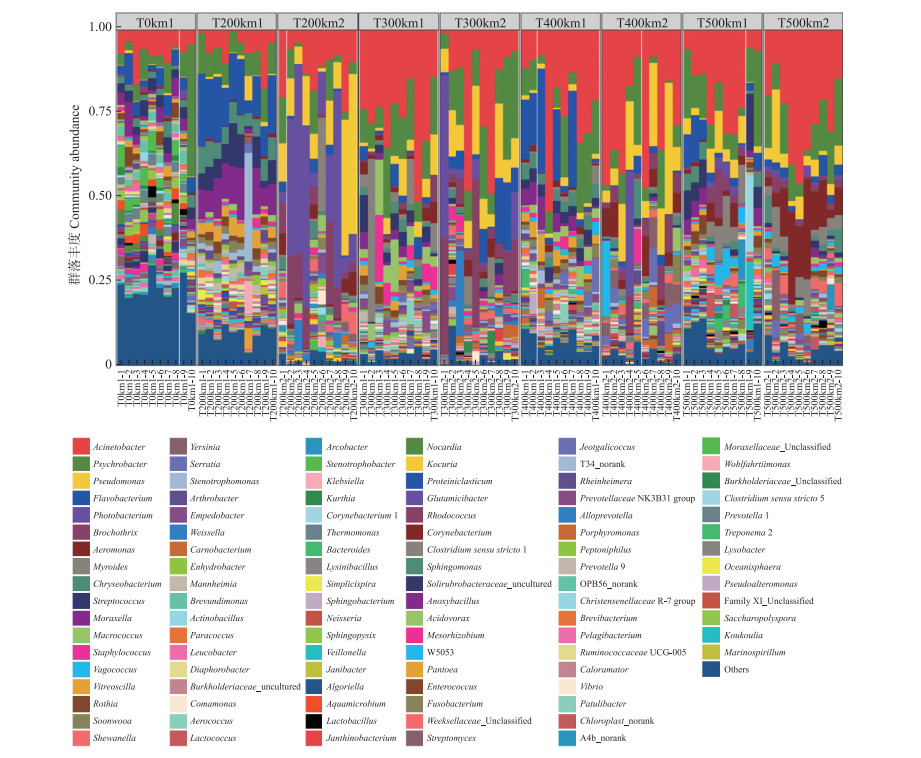
如图 9所示:工厂起点微生物属水平群落丰度较高, 经过运输后群落丰度减少, 各组出现丰度不同的占据主导地位的菌属。200 km组, 物流中心群落丰度较高的是不动杆菌属(Acinetobacter)、嗜冷杆菌属(Psychrobacter)、黄杆菌属(Flavobacterium)、莫拉氏菌属(Moraxella); 销售终端群落丰度较高的是发光杆菌属(Photobacterium)、假单胞菌属(Pseudomonas)、不动杆菌属、嗜冷杆菌属。300 km组, 物流中心群落丰度较高的是不动杆菌属、嗜冷杆菌属、假单胞菌属; 销售终端群落丰度较高的是不动杆菌属、嗜冷杆菌属、假单胞菌属、黄杆菌属。400 km组, 物流中心群落丰度较高的是不动杆菌属、嗜冷杆菌属、黄杆菌属; 销售终端群落丰度较高的是不动杆菌属、假单胞菌属。500 km组, 物流中心群落丰度较高的是不动杆菌属、嗜冷杆菌属; 销售终端群落丰度较高的是不动杆菌属、嗜冷杆菌属、假单胞菌属。工厂起点微生物丰度较高且环境稳定, 各菌群呈动态平衡状态; 运输过程中环境条件改变、分割过程外来假单胞菌的污染都会导致菌群的紊乱, 各菌属迅速生长同时抑制其他菌属生长成为优势菌群, 这与Zhao等[12]研究结论较一致。各距离组销售终端与物流中心相比均出现丰度较高的假单胞菌, 而假单胞菌主要来自外源污染[1], 说明在物流中心到销售终端的流通过程及分割过程中微生物菌群变化主要来自人为污染。
|
图 9 不同运输距离组属水平群落丰度 Fig. 9 Genus community abundance of different transport distances 图中T0km1表示工厂起点, 运输距离0 km; T200km1表示200 km组物流中心; T200km2表示200 km组销售终端; T300km1表示300 km组物流中心; T300km2表示300 km组销售终端; T400km1表示400 km组物流中心; T400km2表示400 km组销售终端; T500km1表示500 km组物流中心; T500km2表示500 km组销售终端。1~10表示重复数。 In the figure, T0km1 indicates the starting point of the factory, and the transportation distance is 0 km. T200km1 indicates the 200 km group logistics center; T200km2 indicates the 200 km group sales terminal; T300km1 indicates the 300 km group logistics center; T300km2 indicates the 300 km group sales terminal; T400km1 indicates the 400 km group logistics center; T400km2 indicates the 400 km group sales terminal; T500km1 indicates the 500 km group logistics center; T500km2 indicates the 500 km group sales terminal. 1-10 indicate the number of repetitions. |
动物源食品尤其是鲜猪肉是人们日常饮食的重要组成部分和营养来源[13]。猪肉在屠宰、运输过程中容易受到来自加工用水、机械设备、操作工人及空气中微生物的污染[14]。微生物生长是导致肉品腐败变质的主要原因[15], 有效的冷链运输能减缓腐败, 保障肉品质量安全, 促进食品行业繁荣发展[16]。我国肉类消费量逐年增长, 为了满足消费者对高品质肉类的需求, 生猪屠宰后全程冷链运输, 维持流通过程温度恒定是必须的。冷链运输技术发展完善, 促使肉类消费由中高温肉制品向低温肉制品转型升级[17], 必将促进肉品行业的繁荣发展, 肉品行业对冷链运输的依赖性和要求也将越来越高。
冷链运输连接着工厂和市场, 运输过程中肉品储藏在运输载体里[18], 需有严格的温、湿度控制, 保证冷却肉新鲜卫生。目前我国冷却肉行业一般为产供销一体化模式, 运输方式主要是使用冷藏车的公路运输[19-21]。我国采用HACCP、GMP和ISO9000等操作规范避免从生产加工到消费过程中产生食品安全隐患, 但并未对冷链运输环节提出相应监控措施[21], 冷链运输仍缺乏有效监管。严格的冷链运输应从预冷到销售实现无缝对接[22], 全程处于不中断温度恒定状态。但本研究发现实际生产中猪肉冷链运输存在装卸货阶段冷链中断, 运输途中温度波动, 各线路间冷藏车温、湿度控制不均一, 分割品及冻品和冷、热胴体混装, 运输途中出于节约成本目的改变温度等不规范行为。国内目前没有健全的猪肉流通全程追溯体系或技术[23], 冷链物流实时监控与溯源预警技术体系尚不健全, 冷藏车硬件设施较为落后。消费者缺乏对冷鲜肉的正确认识, 认为热鲜猪肉新鲜有营养, 导致市场仍对热鲜肉有较高需求。本试验中500 km组出现热鲜肉情况, 高、低温胴体混装为维持低温带来困难, 不利于冷链运输的统一规范。冷、热胴体混装在国际上确能找到案例, Merai等[7-8]通过系列试验, 验证了其所用冷藏车具有足够的热交换能力维持低温, 但国内目前暂无此方面的安全性验证及规范要求。市场对热鲜肉的需求, 推动企业为牟利而满足市场, 而我国冷链物流行业存在着起步晚、技术水平低、设施落后、效率低、成本高、冷链中断、缺乏监管等问题[24-26], 肉品安全有效的冷链运输面临着重重挑战和严峻考验, 我国的冷链物流产业发展任重道远。
刘阳泰等[27]研究了全程冷链、部分冷链、全程非冷链3种流通方式下猪肉中单增李斯特菌的情况, 结果表明全程冷链更有利于控制流通期间单增李斯特菌的生长, 而全程非冷链模式的热鲜猪肉最容易导致单增李斯特菌超过风险阈值。冷却肉营养丰富、流通环节多、货架期长达5 d, 易产生微生物腐败, 甚至造成食品安全事件。冷链运输过程中温度异常是导致冷却肉腐败的最关键因素。食品腐败大多由微生物族群中数量占绝对优势的特定腐败菌引起, 冷却猪肉的优势腐败菌主要有假单胞菌、肠杆菌、热杀索丝菌、乳酸菌、莫拉氏菌和不动杆菌等[28-31]。本研究发现, 不同距离运输组中广泛存在丰度较高的不动杆菌属、嗜冷菌属、假单胞菌属、黄杆菌属、索丝菌属、莫拉氏菌属等腐败菌。冷链运输过程中为节约能源间歇性关闭制冷、装卸货过程温度波动等导致连续的低温体系得不到保障。低温状态下处于休眠状态的微生物, 如沙门氏菌、弯曲杆菌在温度上升时恢复活性并大量增殖, 葡萄球菌、肉毒杆菌大量增殖时会产生毒素而影响食品安全。温度波动使肉品中的腐败菌活性、酶活性恢复, 快速分解肉品中的营养物质, 产生有害物质和异味, 导致肉品颜色、气味、质地劣变, 影响货架期[32-33]。为保证猪肉在流通过程中的质量安全, 加强对冷链运输过程的温、湿度监管, 深入研究促进冷鲜猪肉产业技术发展转型升级是十分必要的。
| [1] |
Wang G Y, Wang H H, Han Y W, et al. Evaluation of the spoilage potential of bacteria isolated from chilled chicken in vitro and in situ[J]. Food Microbiology, 2017, 63: 139-146. DOI:10.1016/j.fm.2016.11.015 |
| [2] |
Merai M, Flick D, Guillier L, et al. Experimental characterization of airflow inside a refrigerated trailer loaded with carcasses[J]. International Journal of Refrigeration, 2018, 88: 337-346. DOI:10.1016/j.ijrefrig.2018.01.005 |
| [3] |
Miao J Y, Peng W, Liu G, et al. Biopreservative effect of the natural antimicrobial substance from Lactobacillus paracase subsp[J]. Food Control, 2015, 56: 53-56. DOI:10.1016/j.foodcont.2015.03.013 |
| [4] |
江琦, 王烨, 刘英, 等. 冷鲜肉的研究进展[J]. 农产品加工, 2015(1): 69-71. Jiang Q, Wang Y, Liu Y, et al. Advanced on chilled meat[J]. Farm Products Processing, 2015(1): 69-71 (in Chinese with English abstract). |
| [5] |
Zhang Y X, Wei J P, Yuan Y H, et al. Diversity and characterization of spoilage-associated psychrotrophs in food in cold chain[J]. International Journal of Food Microbiology, 2019, 290: 86-95. DOI:10.1016/j.ijfoodmicro.2018.09.026 |
| [6] |
Stahl V, Ndoye F T, El Jabri M, et al. Safety and quality assessment of ready-to-eat pork products in the cold chain[J]. Journal of Food Engineering, 2015, 148: 43-52. DOI:10.1016/j.jfoodeng.2014.09.040 |
| [7] |
Merai M, Flick D, Guillier L, et al. Experimental characterization of heat transfer inside a refrigerated trailer loaded with carcasses[J]. International Journal of Refrigeration, 2019, 99: 194-203. DOI:10.1016/j.ijrefrig.2018.11.041 |
| [8] |
Merai M, Duret S, Derens E, et al. Experimental characterization and modelling of refrigeration of pork carcasses during transport under field conditions[J]. International Journal of Refrigeration, 2019, 102: 77-85. DOI:10.1016/j.ijrefrig.2019.02.033 |
| [9] |
Mercier S, Mondor M, Villeneuve S, et al. The Canadian food cold chain:a legislative, scientific, and prospective overview[J]. International Journal of Refrigeration, 2018, 88: 637-645. DOI:10.1016/j.ijrefrig.2018.01.006 |
| [10] |
中华人民共和国国家卫生和计划生育委员会, 国家食品药品监督管理总局.食品安全国家标准食品微生物学检验菌落总数测定: GB 4789.2-2016[S].北京: 中国标准出版社, 2017. National Health and Family Planning Commission of the People's Repulic of China, National Medical Products Administration. Food microbiological examination: aerobic plate count: GB 4789.2-2016[S]. Beijing: Standards Press of China, 2017(in Chinese). |
| [11] |
欧洲共同体委员会条例. EC 1441-2007关于食品微生物标准EC 2073-2005的修订条例[S].布鲁塞尔: 欧盟官方公报, 2007. Commission of the European communities regulations. EC 1441-2007 Amendments to the food microbiological standard EC 2073-2005[S]. Brussels: Official EU Communique, 2007(in Chinese). |
| [12] |
Zhao F, Zhou G H, Ye K P, et al. Microbial changes in vacuum-packed chilled pork during storage[J]. Meat Science, 2015, 100: 145-149. DOI:10.1016/j.meatsci.2014.10.004 |
| [13] |
D'Ostuni V, Tristezza M, de Giorgi M G, et al. Occurrence of Listeria monocytogenes and Salmonella spp. in meat processed products from industrial plants in Southern Italy[J]. Food Control, 2016, 62: 104-109. DOI:10.1016/j.foodcont.2015.10.025 |
| [14] |
Ahmed I, Lin H, Zou L, et al. A comprehensive review on the application of active packaging technologies to muscle foods[J]. Food Control, 2017, 82: 163-178. DOI:10.1016/j.foodcont.2017.06.009 |
| [15] |
James S J, James C. The food cold-chain and climate change[J]. Food Research International, 2010, 43(7): 1944-1956. DOI:10.1016/j.foodres.2010.02.001 |
| [16] |
杜甜甜, 李学工. 肉禽蛋生鲜产品冷链物流的转型与升级[J]. 农业科学研究, 2018, 39(3): 60-64. Du T T, Li X G. The transformation and upgrading of cold chain logistics of meats, poultry and eggs[J]. Journal of Agricultural Sciences, 2018, 39(3): 60-64 (in Chinese). |
| [17] |
James S J, James C, Evans J A. Modelling of food transportation systems:a review[J]. International Journal of Refrigeration, 2006, 29(6): 947-957. DOI:10.1016/j.ijrefrig.2006.03.017 |
| [18] |
Chen K Y, Shaw Y C. Applying back propagation network to cold chain temperature monitoring[J]. Advanced Engineering Informatics, 2011, 25(1): 11-22. DOI:10.1016/j.aei.2010.05.003 |
| [19] |
Evans J A, Scarcelli S, Swain M V L. Temperature and energy performance of refrigerated retail display and commercial catering cabinets under test conditions[J]. International Journal of Refrigeration, 2007, 30(3): 398-408. DOI:10.1016/j.ijrefrig.2006.10.006 |
| [20] |
Barbon A P A C, Barbon S, J r, Mantovani R G, et al. Storage time prediction of pork by Computational Intelligence[J]. Computers and Electronics in Agriculture, 2016, 127: 368-375. DOI:10.1016/j.compag.2016.06.028 |
| [21] |
Peng Y Q, Zhang L X, Song Z X, et al. A QR code-based tracing method for fresh pork quality in cold chain[J]. Journal of Food Process Engineering, 2018, 41(4). |
| [22] |
金鑫, 周光宏, 徐幸莲. 冷却肉微生物腐败与冷链系统[J]. 食品工业科技, 2012, 33(6): 417-420. Jin X, Zhou G H, Xu X L. Chilled meat microbial spoilage and chill chain system[J]. Science and Technology of Food Industry, 2012, 33(6): 417-420 (in Chinese with English abstract). |
| [23] |
刘寿春, 赵春江, 杨信廷, 等. 冷链物流过程猪肉微生物污染与控制图设计[J]. 农业工程学报, 2013, 29(7): 254-260. Liu S C, Zhao C J, Yang X T, et al. Microbial contamination of chilled pork in cold chain logistics and its control chart design[J]. Transactions of the Chinese Society of Agricultural Engineering, 2013, 29(7): 254-260 (in Chinese with English abstract). |
| [24] |
张喜才, 汤金金. 非洲猪瘟背景下生猪供应链重塑及其对策研究[J]. 中国畜牧杂志, 2019, 55(9): 143-146. Zhang X C, Tang J J. Restructuring of pig supply chain and countermeasures in the background of African swine fever[J]. Chinese Journal of Animal Science, 2019, 55(9): 143-146 (in Chinese). |
| [25] |
李晔孜.肉品追溯体系下仓储管理的RFID应用研究[D].南京: 南京农业大学, 2014. Li Y Z. Research on application of RFID in warehouse management for meat-traceability system[D]. Nanjing: Nanjing Agricultural University, 2014(in Chinese with English abstract). |
| [26] |
肖新清.面向冷链物流品质感知的物联网数据采集与建模方法[D].北京: 中国农业大学, 2017: 2-5. Xiao X X. Lot based data acquisition and modeling methods for food quality perception in cold chain[D]. Beijing: China Agricultural University, 2017: 2-5(in Chinese with English abstract). |
| [27] |
刘阳泰, 孙菀霞, 刘宝林, 等. 3种流通模式下生猪肉中单增李斯特菌的暴露评估[J]. 食品科学, 2019, 40(1): 85-91. Liu Y T, Sun W X, Liu B L, et al. Quantitative exposure assessment of Listeria monocytogenes in raw pork under three transportation modes[J]. Food Science, 2019, 40(1): 85-91 (in Chinese with English abstract). |
| [28] |
李苗云, 周光宏, 徐幸莲. 应用PCR-DGGE研究冷却猪肉贮藏过程中的优势菌[J]. 西北农林科技大学学报(自然科学版), 2008, 36(9): 185-189. Li M Y, Zhou G H, Xu X L. Study on the dominant bacteria during the storage period on chilled pork using PCR-DGGE[J]. Journal of Northwest A&F University(Natural Science Edition), 2008, 36(9): 185-189 (in Chinese with English abstract). |
| [29] |
Yang C, Che Y, Qi Y, et al. High-throughput sequencing of viable microbial communities in raw pork subjected to a fast cooling process[J]. Journal of Food Science, 2017, 82(1): 145-153. DOI:10.1111/1750-3841.13566 |
| [30] |
Li M Y, Zhou G H, Xu X L, et al. Changes of bacterial diversity and main flora in chilled pork during storage using PCR-DGGE[J]. Food Microbiology, 2006, 23(7): 607-611. DOI:10.1016/j.fm.2006.01.004 |
| [31] |
徐云强, 孙卫青, 汪兰, 等. 储运过程中温度波动对食品品质及货架期的影响[J]. 食品工业, 2018, 39(8): 228-231. Xu Y Q, Sun W Q, Wang L, et al. Effect of temperature fluctuation on food quality and shelf life during storage and transportation[J]. Food Industry, 2018, 39(8): 228-231 (in Chinese with English abstract). |
| [32] |
黄文博, 谢晶, 罗超, 等. 冷链物流中温度波动对美国红鱼品质变化的影响[J]. 食品科学, 2016, 37(18): 268-274. Huang W B, Xie J, Luo C, et al. Effect of temperature fluctuation on quality changes of red drum(Sciaenops ocellatus)in cold chain logistics[J]. Food Science, 2016, 37(18): 268-274 (in Chinese with English abstract). |
| [33] |
刘寿春, 赵春江, 杨信廷, 等. 猪肉冷链加工与物流微生物危害分析与控制[J]. 食品科技, 2012, 37(5): 103-108. Liu S C, Zhao C J, Yang X T, et al. The microbiological hazard analysis and their monitoring measures of pork during processing and logistics in cold chain[J]. Food Science and Technology, 2012, 37(5): 103-108 (in Chinese with English abstract). |


