
文章信息
- 马晨, 冯莉, 魏康丽, 刘强, 张伟, 屠康, 彭菁, 潘磊庆
- MA Chen, FENG Li, WEI Kangli, LIU Qiang, ZHANG Wei, TU Kang, PENG Jing, PAN Leiqing
- 桃果实采后光学特性与硬度及果胶物质的关系
- Relationship between the optical properties and firmness, pectin constitution in peach flesh during post-harvest storage
- 南京农业大学学报, 2020, 43(2): 347-355
- Journal of Nanjing Agricultural University, 2020, 43(2): 347-355.
- http://dx.doi.org/10.7685/jnau.201905054
-
文章历史
- 收稿日期: 2019-05-30


质地是果实重要的品质指标, 影响消费者对果实品质的评判。桃果实因其味甜美、营养价值高而深受中国人民喜爱。桃果实质地通常用硬度衡量, 且与其组织的结构、生理生化特征有关[1-3]。在储藏过程中, 细胞壁降解和失水会导致桃果实软化, 其中果胶物质作为细胞壁基质中含量最多的一类大分子, 其组分与含量在果实成熟软化过程中起着关键作用[4-5]。
桃果实硬度主要采用硬度计或质构仪进行穿刺检测, 但该方法会损伤果实。近红外技术通过获取果实内部的反射/透射光谱信息, 建立光谱与硬度的关系, 从而实现硬度的检测, 具有无损、快速的特点。Nascimento等[6]利用FT-NIR对不同成熟度的桃果实的硬度进行预测, 结果显示预测集决定系数(Rp2)为0.40, 预测集均方根误差(RMSEP)为13.2 N。虽然利用该技术从表观方面定量了光谱与果实硬度的关系, 但尚未深入探讨光学吸收和散射与组织硬度变化的内在联系, 检测机制尚不完善。
吸收系数(μa)与散射系数(μs)作为基本的光学特性参数, 描述了光在单位距离(cm或mm)内被组织吸收或散射而损失的光能变化[7]。为进一步简化光传输模型, 研究人员对传统光学参数进行整合优化并引入了约化散射系数(μ′s), 用以反映待测样本的光反射特性[8]。因此, 在描述果蔬这类不均匀的浑浊介质光学特性时, 常用μa和μ′s定量描述生物组织的光学吸收和散射性质[9-10]。Vanoli等[11]和Rowe等[12]研究发现, 不同苹果品种的μa和μ′s与硬度均具有相关性; He等[13]运用积分球技术基于μ′s对‘圆黄’梨硬度进行评估, 预测集Rp2和RMSEP分别为0.48和2.21 N; Trong等[14]运用高光谱空间分辨技术基于μa和μ′s构建‘布瑞本’苹果品质偏最小二乘法预测模型, 最佳硬度预测模型Rp2为0.73~0.83, RMSEP为8.91~13.70 N。以上研究已初步证实果实硬度与组织光学吸收和散射特性存在关联性, 可结合化学计量学进行预测模型的构建。但是果胶物质作为引起硬度变化的关键因素, 其与硬度、光学吸收及散射之间的关系尚不清晰。探究果胶物质与光学吸收和散射的关系, 将有助于解释光学技术预测硬度的机制, 为后续光学技术在农产品加工储藏方面的检测提供理论基础和技术参考。
因此, 本研究采用单积分球测量系统结合反向倍加法(inverse adding-doubling, IAD), 研究桃果实采后储藏过程中硬度和果胶物质与光学特性的关系, 旨在从果胶组分和含量变化方面解释光学技术预测果实硬度的机制。
1 材料与方法 1.1 试验材料选用七成熟硬溶质水蜜桃品种‘霞晖八号’作为试验样品, 采后初始硬度为(34.40±3.76)N, 可溶性固形物为(14.42±0.63)%。桃果实于7月底采摘于南京八卦洲(35°5′N, 118°8′E), 采后立即送回实验室。选取大小均匀、成熟度一致、无伤痕、无虫眼的桃果实共70个, 用水清洗桃果实表面, 自然风干后取10个桃果实测量理化指标, 剩余60个桃果实套袋置于恒温恒湿箱储存6 d, 其中温度为(20±1)℃, 湿度为90%。每天随机取10个桃果实用于硬度、光学特性及果胶含量测定, 具体测量位置见图 1。

|
图 1 桃果实硬度和光学特性的测量位置 Fig. 1 Measurement position of firmness and optical properties of peach flesh |
在每个样品的光谱采集附近3个位置, 采用质构仪(TMS-Pro, FTC, 美国)穿刺模式进行硬度测量, 选用直径6 mm圆柱探头, 测试速度2 mm · s-1, 穿刺距离8 mm。取平均值为该样品的硬度(单位:N)。
1.3 光学特性测量 1.3.1 积分球测量系统光学特性测量采用实验室自行搭建的单积分球测量系统, 包括计算机、积分球、光谱仪、光源、滑台及滑台控制装置(图 2)。积分球直径83.82 mm(4P-GPS-033-SL, Labsphere, 美国), 内壁喷涂光反射涂料, 反射率98%[13], 能使光均匀分散。球体赤道相隔180°处开2个25.4 mm直径的端口作为进光口和出光口。端口盖(PP-100-SL)喷涂光反射涂料, 覆盖积分球的出口端。使用1 000 μm直径光纤传输信号至光谱仪, 由光谱仪(PG2000-PRO, 上海复享)采集光谱数据。光源是高功率卤素光源(ASBN-W100-L, Spectral Products, 美国), 输出波长400~2 000 nm, 输出功率100 W。滑台及滑台控制装置包括光源控制滑台、样品架控制滑台及三轴步进电机控制系统。

|
图 2 积分球测量系统示意图 Fig. 2 Schematic diagram of integrating sphere measurement system |
水被认为是没有散射的纯吸收液体[15], Intralipid(Sigma-Aldrich, 美国)粒度均匀分散, 成分稳定, 常被用作验证光传输特性检测系统精度的散射剂[16]。采用纯水及1% Intralipid分别对积分球测量系统进行吸收和散射精度分析, 并将测量值与文献中报道的值进行比对, 分析系统的准确性。
1.3.3 果肉组织光学特性测量从完整果实的赤道相对两面切去约10 mm厚外层, 再切取2片4 mm厚度的果肉(图 1), 然后将果肉切成长、宽、厚约为40 mm×30 mm×4 mm的薄片。每片果肉的实际厚度为3次测量值的均值。测量光谱信号时, 用2片石英玻璃片夹住(厚度为1 mm)果肉片后置于积分球系统样品架上, 通过系统反射和透射模式, 获取样品的反射率和透射率, 计算公式如(1)和(2), 并运用IAD 3.9.10[17]计算得到果肉切片的μa和μ′s。每个桃果实光学特性值为赤道相对两面果肉组织的平均值, 每个时间点光学特性值为每天10个桃果实的平均值。测量后的桃果实采用液氮冷冻并用于之后果胶含量测定。
|
(1) |

|
(2) |
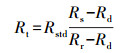
式中:Rt为样品的反射率; Rs为样品的反射光强; Rd为反射暗背景光强; Rr为反射白背景光强; Rstd为白板反射率, 值为0.98。Tt为样品的透射率; Ts为样品的透射光强; Td为透射暗背景光强; Tr为透射白背景光强。
1.4 果胶提取及含量测定果胶提取及含量测定采用曹建康[18]的方法并略有改进。称取1.25 g冻样, 研碎后加20 mL 95%乙醇并转移至50 mL三角瓶中, 沸水浴30 min, 除去糖分及其他物质(及时补液); 用滤纸过滤, 收集沉淀; 加水15 mL后50 ℃水浴30 min, 以溶解可溶性果胶; 过滤, 用少量水洗涤滤纸和沉淀; 滤液移入50 mL容量瓶中加水定容, 即为可溶性果胶测定液。向沉淀中继续加入20 mL 0.5 mol · L-1浓硫酸, 沸水浴60 min(及时补液), 以水解不可溶性果胶, 冷却后移入50 mL容量瓶中, 加0.5 mol · L-1硫酸定容, 即为不可溶性果胶测定液。
分别取可溶性和不可溶性果胶测定液1 mL于试管中, 加入浓硫酸6 mL, 混匀后沸水浴20 min, 冷却至室温; 再加入0.5 mL 0.5%(体积分数)咔唑乙醇溶液摇匀, 暗处放置2 h。采用紫外可见分光光度计(UV1800, 岛津, 日本)测定530 nm波长下的吸光度, 并从标准曲线上查出相应的半乳糖醛酸质量。代入公式(3)得到各组分果胶含量。果胶的标准曲线决定系数为0.999 0。总果胶含量为可溶性果胶与不可溶性果胶之和。
|
(3) |
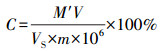
式中:C为果胶的质量分数(%); M′为从标准曲线查得的半乳糖醛酸质量(μg); V为样品提取液总体积(mL); VS为测定时所取样品提取液体积(mL); m为样品质量(g)。
为了更好描述储藏中果实果肉细胞壁变化情况, 计算原果胶指数(proto-pectin index, PI)。

|
(4) |
式中:PI为原果胶指数; C1为水溶性果胶含量(%); C2为原果胶(不溶果胶)含量(%)。
1.5 数据处理和分析采用IBM SPSS Statistics 20.0软件进行方差分析和Pearson相关性分析。采用Matlab R2010b软件建立硬度、水溶性果胶、原果胶、PI的偏最小二乘回归模型, 用K-S算法[19]按3 : 1划分建模集与预测集。模型的性能用预测集决定系数(Rp2)和预测集均方根误差(RMSEP)进行评估。
2 结果与分析 2.1 桃果实储藏过程中的硬度及果胶含量分析如图 3所示:随储藏时间的延长, 桃果实硬度整体呈逐渐下降趋势, 前期硬度显著下降, 后期保持稳定, 从34.40 N减小至3.41 N, 下降幅度达90%;总果胶含量呈上升—下降—上升趋势, 其中水溶性果胶含量在储藏前期变化不大, 储藏后期则显著上升; 原果胶含量与PI整体呈下降趋势。表明随着储藏时间的延长, 果实胞间层中的原果胶在相关酶作用下分解为水溶性果胶[20]。

|
图 3 桃果实储藏过程中硬度、果胶物质含量变化 Fig. 3 Changes in the firmness and pectin constitution content of peach flesh during storage 1)PI:原果胶指数Proto-pectin index; 2)不同字母表示同一指标下差异显著(P < 0.05)。下同。 Different letters indicate significant difference at 0.05 level under the same indicator. The same as follows. |
在对桃果实组织光学特性参数进行测定前, 先用纯水及1% Intralipid分别对积分球测量系统进行吸收和散射精度分析, 结果(图 4)显示, μa和μ′s的测量值与参考值[21-23]趋势相似。μa测量值与参考值在850~1 050 nm平均误差只有4.23%, 但在400~700 nm出现基线漂移, 这可能由于样品边缘光的损失而引起的测量值偏高[12]。μ′s整体拟合较好, 平均误差为5.48%。

|
图 4 积分球测量系统的精度分析 Fig. 4 Precision analysis of integrating sphere measurement system μa:吸收系数Absorption coefficient; μ′s:约化散射系数Reduced scattering coefficient.下同。The same as follows. |
由图 5可见:不同储藏时间桃果肉的μa和μ′s的曲线均相似。μa光谱曲线在510、670和970 nm处存在3个明显的吸收峰, 在740 nm处有较弱的吸收峰。在510 nm处的吸收峰与花青素吸收有关; 670 nm处的吸收峰与叶绿素吸收有关[24]; 740 nm处的吸收峰源于O—H伸缩的三倍频; 970 nm处的吸收峰则源于H—O—H的伸缩振动的二倍频, 与水分子的结构有关[25-26]。此外, 在400~1 050 nm μa并未随储藏时间的延长呈现出明显变化规律, 这可能是因为桃果实品种之间存在差异性的原因, 硬溶质与软溶质果实的质地特性会在储藏期间呈现不同规律的变化; 另一方面, 光照时间、产地和取样点不同等因素, 也可能对结果造成影响。

|
图 5 不同储藏时间桃果实的光学性质变化 Fig. 5 Change in optical property of peach flesh during different storage time |
μ′s在μa强吸收对应波长下(510、670、740、970 nm)出现波谷, 这可能是积分球系统串扰造成的[13]。在Rowe等[12]和Cen等[27]的研究中也出现了类似情况。当基于IAD求解光学特性参数时, 系统过分估计光的吸收, 未考虑积分球内光的损失, 导致迭代时μa偏高而μ′s偏低, 未表现出随着波长增加而减小的趋势。所以后续分析中, 仅分析600~1 050 nm波段的光学特性与硬度及果胶物质的关系。600~1 050 nm μ′s随储藏时间延长逐渐下降[27]。
2.3.1 桃果实储藏过程中硬度及果胶物质含量间的关系由表 1可见:储藏过程中, 硬度与总果胶含量并无明显相关性, 而与水溶性果胶含量极显著负相关; 硬度与原果胶含量和PI呈极显著正相关, 相关系数分别为0.891、0.902。即硬度与PI的相关性最高, 其次是原果胶含量, 最后是水溶性果胶含量。水溶性果胶含量与原果胶含量极显著负相关, 可能是因为原果胶在果胶酶等作用下分解为水溶性果胶, 引起水溶性果胶含量上升, 同时原果胶含量下降。
| 指标 Index |
硬度 Firmness |
总果胶含量 Total pectin content |
水溶性果胶含量 Water-soluble pectin content |
原果胶含量 Proto-pectin content |
PI |
| 硬度Firmness | 1.000 | 0.150 | -0.769** | 0.891** | 0.902** |
| 总果胶含量Total pectin content | 1.000 | 0.377 | 0.368 | 0.114 | |
| 水溶性果胶含量Water-soluble pectin content | 1.000 | -0.689** | -0.831** | ||
| 原果胶含量Proto-pectin content | 1.000 | 0.910** | |||
| PI | 1.000 | ||||
| Note:* * P < 0.01. | |||||
由图 6-A可见:硬度、原果胶含量和PI与μa在600~1 050 nm波段范围内相关强度及变化相似。r在600~700 nm先上升后下降, 且在675 nm处存在1个峰, 并于700 nm后保持稳定的负相关。总果胶含量与μa无相关性, 水溶性果胶含量与μa的相关系数r在600~675 nm快速下降, 在675 nm后又快速上升, 并于700 nm后保持稳定的正相关。此外, 原果胶含量与700~1 050 nm的μa相关性最高(r=-0.793~-0.910), 其次是PI(r=-0.762~-0.901), 最后是水溶性果胶含量(r=0.546~0.814)。

|
图 6 桃果肉光学特性μa(A)和μ′s(B)与硬度、果胶物质含量相关性分析 Fig. 6 Correlation analysis among μa(A)and μ′s(B)with firmness, pectin constitution content in peach flesh |
由图 6-B可见:μ′s与硬度在600~1 050 nm均呈正相关, 平均相关系数为0.973(P < 0.01), 与Cen等[28]研究结果一致。然而Vanoli等[29]研究发现790和912 nm处的μ′s与硬度呈负相关。这可能是因为果实的硬度受细胞壁降解与水分损失影响, 这2种效应也会影响光在水果组织的传播。其中, 失水不仅导致细胞间隙数量及体积增加, 而且引起细胞平均尺寸减小。细胞间隙中的空气产生折射率不匹配, 导致光散射增加。同时, 细胞壁的降解会破坏细胞与细胞的结合, 减少细胞内的复杂结构, 致使散射边界数的减少, 从而降低光散。细胞壁的降解也可能导致细胞壁间黏附减弱, 创造新的细胞间折射边界, 使散射增强[12]。这种情况使光学特性与硬度之间的关系变得复杂, 导致光学特性与结构特性之间存在正相关或负相关, 这取决于何种效应占主导地位。总果胶含量与μ′s无相关性, 水溶性果胶含量与μ′s负相关, 而原果胶含量和PI与μ′s正相关。其中, μ′s与PI相关性最高, 其次是水溶性果胶含量, 最后是原果胶含量, 平均相关系数分别为0.983、-0.911和0.905(P < 0.05)。原果胶含量、PI和硬度与光学特性相关性相似, 这可能是硬度与果胶物质含量有高的相关性所致。
为在特征波长下进一步研究光学特性与硬度及果胶物质响应规律, 对光谱进行一阶导预处理后与硬度及果胶物质含量(总果胶不再进行研究)进行相关性分析以选出特征波长。从图 7可以看出:μa和μ′s的一阶光谱与硬度及果胶物质含量的相关系数在660、690和950 nm处有峰值。进一步建立了在660、690和950 nm波长下μa、μ′s与硬度及果胶物质含量的线性拟合方程。由表 2可见:硬度及果胶物质含量与μ′s的线性拟合方程拟合度均高于与μa的拟合度, 决定系数R2≥0.816。

|
图 7 μa和μ′s一阶导与硬度(A、E)、水溶性果胶含量(B、F)、原果胶含量(C、G)、PI(D、H)的相关性分析 Fig. 7 Correlation analysis of first-order derivatives of μa and μ′s with firmness(A, E), water-soluble pectin content(B, F), proto-pectin content(C, G)and PI(D, H) |
| 参数 Parameter |
光学特性 Optical properties |
660 nm | 690 nm | 950 nm | |||||
| 线性拟合方程Equation | R2 | 线性拟合方程Equation | R2 | 线性拟合方程Equation | R2 | ||||
| 硬度 Firmness |
μa μ′s |
y=0.000 06x+0.048 y=0.013x+0.737 |
0.083 0.935 |
y=-0.000 1x+0.045y=0.013x+0.735 | 0.440 0.940 |
y=-0.000 3x+0.073y=0.012x+0.561 | 0.690 0.951 |
||
| 水溶性果胶含量Water-soluble pectin content | μa μ′s |
y=0.010x+0.044 y=-1.543x+1.317 |
0.154 0.851 |
y=0.020x+0.037y=-1.584x+1.334 | 0.459 0.843 |
y=0.031x+0.061y=-1.399x+1.091 | 0.561 0.821 |
||
| 原果胶含量Proto-pectin content | μa μ′s |
y=-0.012x+0.049 y=1.546x+0.580 |
0.221 0.816 |
y=-0.023x+0.046y=1.595x+0.578 | 0.606 0.817 |
y=-0.037x+0.077y=1.427x+0.422 | 0.765 0.817 |
||
| PI | μa μ′s | y=-0.001x+0.048 y=0.201x+0.695 |
0.138 0.964 |
y=-0.002x+0.046y=0.207x+0.692 | 0.528 0.966 |
y=-0.004x+0.074y=0.186x+0.523 | 0.740 0.970 |
||
| 注:R2:决定系数Determination coefficient. | |||||||||
为进一步验证光学特性参数与硬度及果胶物质之间的关联性, 结合化学计量学, 分别构建基于μa和μ′s的桃果实硬度、水溶性果胶含量、原果胶含量及PI偏最小二乘回归模型。由表 3可见:基于μa和μ′s构建的硬度及果胶物质模型的建模集决定系数Rc2略高于对应模型的预测集决定系数Rp2, 证明模型可靠。硬度、水溶性果胶含量、原果胶含量及PI的模型预测性能均较好。其中, 硬度的模型Rp2高于0.761, RMSEC低于5.888 N。硬度和果胶物质与光学性质之间有高度相关性, 并且基于光学特性预测很有潜力。基于μ′s构建的硬度、水溶性果胶含量、原果胶含量及PI建模结果均优于基于μa的建模结果, 进一步证明硬度和果胶物质与散射性质更相关。且基于μ′s建立的果胶物质模型中, PI预测模型最高, 其次是原果胶和水溶性果胶含量。
| 参数 Parameter |
光学特性 Optical properties |
建模集Calibration | 预测集Prediction | |||
| Rc2 | RMSEC | Rp2 | RMSEP | |||
| 硬度 Firmness |
μa μ′s |
0.765 0.848 |
5.790 4.700 | 0.761 0.845 |
5.888 4.436 | |
| 水溶性果胶含量 Water-soluble pectin content |
μa μ′s |
0.710 0.751 |
0.055 0.048 | 0.687 0.704 |
0.056 0.064 | |
| 原果胶含量 Proto-pectin content |
μa μ′s |
0.608 0.723 |
0.065 0.053 | 0.590 0.714 |
0.030 0.051 | |
| PI | μa μ′s |
0.691 0.758 |
0.453 0.413 | 0.691 0.751 |
0.565 0.449 | |
| 注: Rc2:建模集决定系数Determination coefficient of calibration; Rp2:预测集决定系数Determination coefficient of prediction; RMSEC:建模集均方根误差Root mean square error of calibration; RMSEP:预测集均方根误差Root mean square error of prediction. | ||||||
硬度是桃果实品质重要评价指标之一。储藏过程中桃果实软化受细胞壁基质中的果胶物质的组分与含量影响。现阶段由于对果蔬品质的无损、快速的检测需求, 学者多采用近红外光谱技术检测桃果实硬度[6]。但是该技术存在局限性:光谱技术获取的信号为吸收和散射综合作用, 并未进行分离; 光在组织中发生吸收与散射作用, 而基于朗伯-比尔定律的光谱技术仅考虑光的吸收, 影响预测准确率; 模型通用性差, 模型易受样品差异等影响。因此, 虽然光谱技术在检测果蔬品质领域快速发展, 但尚未深入探讨光学吸收与散射与组织内部品质变化的内在联系, 光学检测机制相对滞后。因此, 本试验采用单积分球系统结合反演算法研究了桃果实采后硬度及果胶物质与光吸收及散射特性的关系。
本研究中, 采后储藏期间‘霞晖八号’桃果肉硬度、原果胶含量及PI逐渐下降, 总果胶含量变化无明显规律, 水溶性果胶含量增加, 这与代娅[30]的研究结果一致。类似结果在李子[31]、芒果[32]等的研究中也得到了证实。果肉组织吸收系数与约化散射系数变化范围与文献已报道的桃[24]、苹果[14, 29]、梨[13]等研究结果基本一致。
硬度与PI相关性最高(r=0.902), 硬度和PI与μ′s的相关性也最高(r≥0.965), 且基于μ′s建立的预测模型也最优, Rp2≥0.751。同时, 基于μ′s建立的预测模型明显优于基于μa建立的模型。因此, 基于光学技术能够预测硬度和果胶含量(尤其是PI)与光学散射高度相关有关。这可能是因为PI作为2种果胶的综合指标, 描述了细胞壁变化情况, 在果实软化过程中, 伴随着细胞壁胞间层的原果胶降解为水溶性果胶, 细胞结构破坏, 引起了硬度的变化。同时, 改变了散射边界数, 从而影响组织的光学特性。
本研究定量了桃果实采后储藏过程中硬度、果胶物质与光学特性的关系, 并从果胶组分和含量变化角度解释光学技术预测果实硬度的机制, 得出基于光学特性实现硬度预测与PI光学散射高度相关这一结论, 将为后续光学技术在农产品加工储藏方面的检测提供理论基础和技术参考。但不同水果中硬度、果胶物质含量及光学特性是否仍然存在这一变化规律需要进一步研究。因此, 在后续研究中, 通过不同品种样本的研究以验证本研究的结果。
| [1] |
Liu B H, Wang K F, Shu X G, et al. Changes in fruit firmness, quality traits and cell wall constituents of two highbush blueberries(Vaccinium corymbosum L.) during postharvest cold storage[J]. Scientia Horticulturae, 2019, 246: 557-562. DOI:10.1016/j.scienta.2018.11.042 |
| [2] |
Valerga L, Darré M, Zaro M J, et al. Micro-structural and quality changes in growing dark-purple eggplant(Solanum melongena L.) as affected by the harvest season[J]. Scientia Horticulturae, 2019, 244: 22-30. DOI:10.1016/j.scienta.2018.09.032 |
| [3] |
Cárdenas-Pérez S, Méndez M J V, Chanona-Pérez J J, et al. Prediction of the nanomechanical properties of apple tissue during its ripening process from its firmness, color and microstructural parameters[J]. Innovative Food Science & Emerging Technologies, 2017, 39: 79-87. |
| [4] |
Bizzani M, Flores D W M, Colnago L A, et al. Non-invasive spectroscopic methods to estimate orange firmness, peel thickness, and total pectin content[J]. Microchemical Journal, 2017, 133: 168-174. DOI:10.1016/j.microc.2017.03.039 |
| [5] |
Zhang L F, Chen F S, Yang H S, et al. Changes in firmness, pectin content and nanostructure of two crisp peach cultivars after storage[J]. LWT:Food Science and Technology, 2010, 43(1): 26-32. |
| [6] |
Nascimento P A M, de Carvalho L C, Júnior L C C, et al. Robust PLS models for soluble solids content and firmness determination in low chilling peach using near-infrared spectroscopy(NIR)[J]. Postharvest Biology and Technology, 2016, 111: 345-351. DOI:10.1016/j.postharvbio.2015.08.006 |
| [7] |
Welch A J, van Gemert M J C. Optical-thermal Response of Laser-irradiated Tissue[M]. Dordrecht, Netherlands: Springer, 2011.
|
| [8] |
Lu R F. Light Scattering Technology for Food Property, Quality and Safety Assessment[M]. New York: CRC Press, 2017.
|
| [9] |
王伟.水果组织光学特性参数反演模型及其应用研究[D].无锡: 江南大学, 2017. Wang W. Study on the inversion model of optical properties for fruit tissue and its application[D]. Wuxi: Jiangnan University, 2017(in Chinese with English abstract). https://www.ixueshu.com/document/79da8b70f0a1bdba56a29633a2e37b69318947a18e7f9386.html |
| [10] |
石舒宁.水果组织的光学描述与光传输规律研究[D].武汉: 华中农业大学, 2016. Shi S N. Optical description of fruit tissue and study of optical transmission discipline[D]. Wuhan: Huazhong Agricultural University, 2016(in Chinese with English abstract). http://cdmd.cnki.com.cn/Article/CDMD-10504-1016155343.htm |
| [11] |
Vanoli M, Rizzolo A, Grassi M, et al. Time-resolved reflectance spectroscopy nondestructively reveals structural changes in 'Pink Lady®' apples during storage[J]. Procedia Food Science, 2011, 1: 81-89. DOI:10.1016/j.profoo.2011.09.014 |
| [12] |
Rowe P I, Künnemeyer R, McGlone A, et al. Relationship between tissue firmness and optical properties of 'Royal Gala' apples from 400 to 1050 nm[J]. Postharvest Biology and Technology, 2014, 94: 89-96. DOI:10.1016/j.postharvbio.2014.03.007 |
| [13] |
He X M, Fu X P, Rao X Q, et al. Assessing firmness and SSC of pears based on absorption and scattering properties using an automatic integrating sphere system from 400 to 1150 nm[J]. Postharvest Biology and Technology, 2016, 121: 62-70. DOI:10.1016/j.postharvbio.2016.07.013 |
| [14] |
Trong N N D, Erkinbaev C, Tsuta M, et al. Spatially resolved diffuse reflectance in the visible and near-infrared wavelength range for non-destructive quality assessment of 'Braeburn' apples[J]. Postharvest Biology and Technology, 2014, 91: 39-48. DOI:10.1016/j.postharvbio.2013.12.004 |
| [15] |
方振欢.用于水果组织光传输特性检测的单积分球系统研制及应用[D].杭州: 浙江大学, 2015. Fang Z H. Development and application of a single integrating sphere system for detecting optical properties of fruit tissue[D]. Hangzhou: Zhejiang University, 2015(in Chinese with English abstract). http://kns.cnki.net/KCMS/detail/detail.aspx?dbcode=CDFD&dbname=CMFD&filename=1015399837.nh |
| [16] |
韩蕾, 李晨曦, 孙承涛, 等. 基于双积分球的宽光谱组织光学参数测量系统与方法研究[J]. 光谱学与光谱分析, 2016, 36(2): 561-566. Han L, Li C X, Sun C T, et al. The research on measurement system and method of tissue optical parameters with wide spectra based on double-integrating-spheres[J]. Spectroscopy and Spectral Analysis, 2016, 36(2): 561-566 (in Chinese with English abstract). |
| [17] |
Prahl S. Everything I think you should know about inverse adding-doubling[EB/OL]. 2011. http://omlc.ogi.edu/software/iad.2019-05-24.
|
| [18] |
曹建康. 果蔬采后生理生化实验指导[M]. 北京: 中国轻工业出版社, 2016: 84-92. Cao J K. Experiment Guidance of Postharvest Physiology and Biochemistry of Fruit and Vegetables[M]. Beijing: China Light Industry Press, 2016: 84-92 (in Chinese). |
| [19] |
吴静珠, 王一鸣, 张小超, 等. 近红外光谱分析中定标集样品挑选方法研究[J]. 农业机械学报, 2006, 37(4): 80-82, 101. Wu J Z, Wang Y M, Zhang X C, et al. Study on algorithms of selection of representative samples for calibration in near infrared spectroscopy analysis[J]. Transactions of the Chinese Society for Agricultural Machinery, 2006, 37(4): 80-82, 101 (in Chinese with English abstract). DOI:10.3969/j.issn.1000-1298.2006.04.021 |
| [20] |
姚佳, 胡小松, 廖小军, 等. 高静压对果蔬制品质构影响的研究进展[J]. 农业机械学报, 2013, 44(9): 118-124, 117. Yao J, Hu X S, Liao X J, et al. Research progress in effect of high hydrostatic pressure on texture of fruit and vegetable product[J]. Transactions of the Chinese Society for Agricultural Machinery, 2013, 44(9): 118-124, 117 (in Chinese with English abstract). |
| [21] |
邓孺孺, 何颖清, 秦雁, 等. 分离悬浮质影响的光学波段(400~900 nm)水吸收系数测量[J]. 遥感学报, 2012, 16(1): 174-191. Deng R R, He Y Q, Qin Y, et al. Pure water absorption coefficient measurement after eliminating the impact of suspended substance in spectrum from 400 nm to 900 nm[J]. Journal of Remote Sensing, 2012, 16(1): 174-191 (in Chinese with English abstract). |
| [22] |
邓孺孺, 何颖清, 秦雁, 等. 近红外波段(900~2500 nm)水吸收系数测量[J]. 遥感学报, 2012, 16(1): 192-206. Deng R R, He Y Q, Qin Y, et al. Measuring pure water absorption coefficient in the near-infrared spectrum(900-2500 nm)[J]. Journal of Remote Sensing, 2012, 16(1): 192-206 (in Chinese with English abstract). |
| [23] |
Qin J W, Lu R F. Measurement of the absorption and scattering properties of turbid liquid foods using hyperspectral imaging[J]. Applied Spectroscopy, 2007, 61(4): 388-396. DOI:10.1366/000370207780466190 |
| [24] |
Qin J W, Lu R F. Measurement of the optical properties of fruits and vegetables using spatially resolved hyperspectral diffuse reflectance imaging technique[J]. Postharvest Biology and Technology, 2008, 49(3): 355-365. DOI:10.1016/j.postharvbio.2008.03.010 |
| [25] |
Yu K Q, Zhao Y R, Liu Z Y, et al. Application of visible and near-infrared hyperspectral imaging for detection of defective features in loquat[J]. Food and Bioprocess Technology, 2014, 7(11): 3077-3087. DOI:10.1007/s11947-014-1357-z |
| [26] |
Magwaza L S, Landahl S, Cronje P J R, et al. The use of Vis/NIRS and chemometric analysis to predict fruit defects and postharvest behaviour of 'Nules Clementine' mandarin fruit[J]. Food Chemistry, 2014, 163: 267-274. DOI:10.1016/j.foodchem.2014.04.085 |
| [27] |
Cen H Y, Lu R F, Mendoza F A, et al. Assessing multiple quality attributes of peaches using optical absorption and scattering properties[J]. Transactions of the ASABE, 2012, 55(2): 647-657. DOI:10.13031/2013.41366 |
| [28] |
Cen H Y, Lu R F, Mendoza F A, et al. Relationship of the optical absorption and scattering properties with mechanical and structural properties of apple tissue[J]. Postharvest Biology and Technology, 2013, 85: 30-38. DOI:10.1016/j.postharvbio.2013.04.014 |
| [29] |
Vanoli M, RizzoloA, Zerbini P E, et al. Non-destructive Detection of Internal Defects in Apple Fruit by Time-resolved Reflectance Spectroscopy[M]. Faro: University of the Algarve, 2010.
|
| [30] |
代娅.皮球桃气调保鲜技术及不同处理保持果实硬度的机理研究[D].雅安: 四川农业大学, 2013. Dai Y. Study on the application of controlled atmosphere storage and the mechanism of different postharvest treatments for keeping fruit firmness in the Ball Peach[D]. Ya'an: Sichuan Agricultural University, 2013(in Chinese with English abstract). http://cdmd.cnki.com.cn/Article/CDMD-10626-1014102894.htm |
| [31] |
Pan H X, Wang L M, Wang R, et al. Modifications of cell wall pectin in chilling-injured 'Friar' plum fruit subjected to intermediate storage temperatures[J]. Food Chemistry, 2018, 242: 538-547. DOI:10.1016/j.foodchem.2017.09.090 |
| [32] |
何俊瑜, 任艳芳, 陈元有, 等. 一氧化氮对常温贮藏下芒果果实软化和细胞壁代谢的影响[J]. 食品工业科技, 2018, 39(17): 269-275. He J Y, Ren Y F, Chen Y Y, et al. Effect of nitric oxide on softening and cell wall metabolism of postharvest mango[J]. Science and Technology of Food Industry, 2018, 39(17): 269-275 (in Chinese with English abstract). |