
文章信息
- 潘磊庆, 魏康丽, 曹念念, 孙柯, 刘强, 屠康, 朱启兵
- PAN Leiqing, WEI Kangli, CAO Niannian, SUN Ke, LIU Qiang, TU Kang, ZHU Qibing
- 果蔬光学参数测量及其在品质检测方面的研究进展
- Measurement of optical parameters of fruits and vegetables and its application in quality detection
- 南京农业大学学报, 2018, 41(1): 26-37
- Journal of Nanjing Agricultural University, 2018, 41(1): 26-37.
- http://dx.doi.org/10.7685/jnau.201706029
-
文章历史
- 收稿日期: 2017-06-19


2. 江南大学轻工过程先进控制教育部重点实验室, 江苏 无锡 214122
2. Key Laboratory of Advanced Process Control for Light Industry, Ministry of Education, Jiangnan University, Wuxi 214122, China
光在果蔬等不透明和不均一的生物组织中传播时, 与内部组成和结构相互作用, 通过吸收和散射产生衰减。因此, 从组织穿出的光携带了与组织内部有关的信息[1]。另一方面, 组织的光学吸收和散射性质分别与组织的化学组成[2]和结构特征有关[3]。因此, 通过测量组织的光学性质可以实现果蔬组织的品质检测。
近20年来, 随着光学仪器和计算机技术的发展, 基于朗伯-比尔定律的可见近红外光谱技术已成为果蔬品质无损检测研究的热点, 并广泛应用于果蔬外部和内部品质的无损检测和质量评价[4-7]。但是, 光在果蔬组织内部的传播不完全遵循朗伯-比尔定律, 从而引起较大的测量误差[8]。另一方面, 该技术测得的是果蔬组织吸收和散射的总效应, 不能分别提供两者单效应, 不能很好地实现对生物体某些物理性质的检测[9]。
光学参数定量地描述了生物组织在某一波长下的光学性质。生物组织的光学性质主要用吸收系数(μa)和约化散射系数(μ's)来表征。此外, 还有各向异性因子(g)、有效散射系数(μeff)等[10]。目前, 以时间分辨(time-resolved, TR)、空间分辨(spatial-resolved, SR)、频域分辨(frequency-domain, FD)和积分球(integrating sphere, IS)为代表的光学参数间接测量技术, 通过测量完整组织或组织切片的某些特定参数(如漫反射率R、漫透射率T和准直透射率Tc等), 并结合特定的光传输模型和反演算法, 间接获得组织的光学参数, 可以分离或同时获得组织对光的吸收和散射性质, 从而获取组织的化学和/或物理信息。由于上述技术具有无损、便于体外测量等优点, 已作为定性或定量研究光吸收和散射以及传播特征的重要手段, 目前已较成功地应用于苹果[11]、桃[12]、梨[13]、猕猴桃[14]、洋葱[15]、土豆[16]等果蔬组织的光学参数测量和品质检测方面。
本文简单介绍了时间分辨、空间分辨、频域分辨和积分球这4种国内外常用的光学参数测量技术的原理和特点, 然后着重介绍了2001—2017年期间, 这些技术在果蔬组织中的光学性质测量和品质检测方面的研究进展, 以期为光学特性测量技术进一步研究和应用提供技术和理论参考。
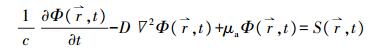
1 光学参数测量技术描述光子在生物组织中传输规律的数学模型有很多, 目前被广泛应用于生物组织光学参数测量的模型主要有基于辐射传输理论的漫射近似(diffusion approximation, DA)模型[17]、倍加法(adding-doubling, AD)模型[18]和Monte Carlo模型[19]等。果蔬组织是强散射介质, TR、SR和FD测量技术以DA为理论依据, 分别选择短窄脉冲光、连续波和正弦调制的光作为入射光源, 通过测量组织表面的漫反射率, 结合漫射近似方程的解获取果蔬组织的μa和μ's。其中, 漫射近似方程可表达为公式(1)的形式[17]。
|
(1) |
式中: 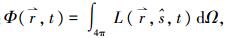


而IS技术基于倍加法的反演方法, 即反向倍加法(inverse adding-doubling, IAD), 通过测得组织的R、T和Tc, 可推算出组织的光学参数[20-21]。IAD具体代码见文献[21]。本文对时间分辨(TR)、空间分辨(SR)、频域分辨(FD)和积分球(IS)技术的测量原理和特点进行简单介绍。
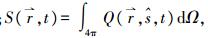
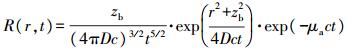
1.1 时间分辨技术由于光的吸收和散射效应, 光子在混浊介质中传输路径和时间延迟不同, 光子到达组织体表面的时间也不同。在时间分辨技术中, 通过短窄脉冲光激励组织后, 在特定径向位置r处可直接测得出射光子飞行时间t的分布及对应的漫反射率R(r, t)(图 1)。其中, 根据Patterson等[22]提出的漫射近似方程在时域的解析解, R(r, t)可用公式(2)表达, 通过对整个测量时间内R(r, t)的波形进行拟合, 可迭代求解组织的μa和μ's。

|
图 1 时间分辨技术测量原理 Figure 1 Schematic diagram of time-resolved technique |
|
(2) |
式中:zb=1/(μa+μ's), 为平均自由程(mm); D为漫射系数(mm); c为光在介质中的传播速度(m·s-1)。
在时间分辨技术中, 光在大多数果蔬组织中至少可以穿透2 cm, 因此, TR可以不受果皮影响, 提供组织内部的信息[23]。但该技术所测得的光信号较弱, 且随时间衰减较快, 所以对系统的时间精度和灵敏度要求非常高, 同时要求样本和检测器接触良好。所用光源通常为皮秒级别的激光脉冲, 对光斑大小和脉冲宽度有较高要求[24]。因此, 时域系统仪器昂贵, 一般仅限于大型实验室的使用。
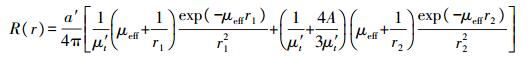
1.2 空间分辨技术根据漫射近似理论, 当采用连续光源垂直入射到半无限大介质表面时, 可以认为组织体内的光分布是一种稳态分布, 与时间无关[25]。因此, 某一径向距离r处的漫反射率R也是恒定的。同时, 由于光的吸收和散射, 光子在组织内传播路径不同, 其出射点也会不同。由图 2可见:空间分辨技术通过获取不同径向距离r处光的漫射反射率R(r), 结合外推边界条件下漫射近似方程的解析解, 进行反演或非线性拟合, 即可提取组织的μa和μ's等参数[26]。

|
图 2 空间分辨技术测量原理图 Figure 2 Schematic diagram of spatial-resolved technique |
|
(3) |
式中:a'=μ's/(μa+μ's), 为反照率; μeff=1/[3μa(μa+μ's)], 为有效衰减系数(mm); μ't=μa+μ's, 为总衰减系数(mm); r1=(z02+r2)1/2, r2=(z0+2zb2+r2)1/2, r1、r2分别为观察点与光源和像源的距离; z0=1/(μa+μ's); A为组织内部反射系数, 若组织和周围介质边界匹配, 则A=1, 若组织的相对折射率n=1.35, 则A=0.219 0[27]; zb=2AD, D为漫射系数。
在SR系统中, 通常采用光纤阵列和非接触反射成像2种传感配置。与前者相比, 后者通常使用CCD(电荷耦合器件)相机获得点光束在散射介质中的漫反射, 不接触被测样品, 保证了食品和农产品的安全和卫生, 应用更为广泛。美国农业部Lu Renfu和他的团队一直致力于研究SR技术在农产品光学性质测量方面的改进和应用[28-29]。他们将高光谱成像与SR结合, 研发了一种高光谱成像空间分辨(hyperspectral imaging-based spatially resolved, HISR)技术, 并开发了一个光学性质分析仪(opertical property analyzer, OPA), 可实现果蔬光学性质的自动测量[30]。OPA系统的硬件部分主要由相机、光谱仪、定焦镜头、光源、水平和垂直平台构成(图 3), 可以获得由径向距离、波长和强度(CCD信号)组成的三维高光谱散射图像[12]。未被果皮直接反射, 能够进入果肉组织的光子称为“有效光子”。入射光束类型、源探距和检测角决定OPA系统入射光有效光子百分比, 影响检测的准确率、精度/重现性和灵敏度。为优化系统的测量条件和参数, Cen等[31]运用已知光学性质的吸收染料和散射剂对系统性能进行了评估和优化, 结果显示该系统最佳光束为圆形和高斯类型, 直径小于1 mm; 最佳的最小和最大源探距分别约为1.5 mm和10~20个平均自由程。Ding等[32]研究发现, 对于核果类果实, 源探距不应该太小, 且应避免大的检测角(80~90 °)。对于厚度在0.05 cm以下的果皮或3.0 cm以下的果肉(如樱桃), 源探距应大于2.5 mm(有效光子百分比为100%, 检测灵敏度为80%左右)。

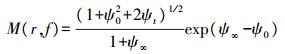
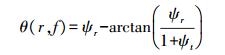
由于组织对光的吸收和散射, 使得系统检测到的光与入射光具有不同的幅度和相位(图 4)。在FD中, 光源经高频调制后(频率为f)入射样本组织, 通过获得径向位置r处幅值变化量M和相位延迟角θ, 结合漫射近似方程的分析解(公式4和5)可提取光学参数[33]。

|
图 4 频域分辨技术测量原理 Figure 4 Schematic diagram of frequency-domain technique |
|
(4) |
|
(5) |
式中: 

不同于TR和SR、FD的单点照射, Cuccia等[34]和Anderson等[35]提出的空间频域成像(spatially-frequency domain imaging, SFDI)用更宽广的视野获得组织的光学性质, 可以表征体积和空间的差异性, 也成功用于检测苹果的瘀伤。SR和SFDI在果蔬方面的应用还不多, 但已被成功地应用于生物医学领域中离体组织的光谱研究, 有很好的应用前景[36]。
1.4 积分球技术积分球是一个内表面涂有高反射材料(如硫酸钡、聚四氟乙烯、金等)的中空球体, 光入射后经过多次漫射后很快被均匀分散, 形成理想的朗伯体, 从而消除了被测样品和探测器件受光面的不均匀性以及测量中偏振带来的影响[37]。积分球技术常用的有单积分球和双积分球技术(图 5)。在单积分球技术中, 需要通过改变样本的放置位置, 分别测得R、T和Tc。而在双积分球技术中, 将样本放置在透射球和反射球之间, 可同时检测得到R、T和Tc。但是, 双积分球技术存在光的串扰问题, 且球体内表面反射系数真实值的校正困难。而单积分球技术避免了这些问题, 应用的更广泛[38]。积分球技术是目前公认检测精度最高的光学参数测量技术, 且其系统组成简单, 成本较低, 有广阔的应用前景。

|
图 5 单积分球和双积分球系统测量原理图 Figure 5 Schematic diagram of single and double integrating spheres A.单积分球系统反射测量Single integrating sphere for reflection measurement; B.单积分球系统透射测量Single integrating sphere for transmission measurement; C.双积分球系统反射和透射测量Double integrating spheres for reflection and transmission measurement. |
时间分辨、空间分辨、频域分辨和积分球技术的适用范围和特点见表 1, 前3种测量技术适用于以散射为主的介质, 可以测量整果和溶液; 仪器成本相对较高, 使用方便, 但要求使用精细的光源, 在各方向立体角上的散射概率相同, 且要求源探距远大于平均自由程(r>10zb)[39]。积分球技术可以测量组织切片和溶液, 准确度高, 不限于强散射样本和各向异性散射, 但要求介质是光学均一的。另外, 积分球技术只模拟光的反射角和透射角的分布, 不适用于光的空间分布。
| 技术 Technique |
模型 Model |
组织状态 Tissue state |
测量参数 Measured parameters |
估计参数 Estimated parameters |
适用范围 Application range |
特点 Characteristics |
| 时间分辨Time-resolved(TR) | 漫射近似 Diffusion approximation |
整果; 溶液 Intact fruit; solution |
R(r, t) | μa, μ's | 散射为主的介质(μ's≥μa), 各向同性光源, 且源探距远大于平均自由程(r>10zb)。 The scattering domained medium(μ's≥μa), the isotropic light source. The distance between light-and source is bigger than the mean free path(r>10zb). |
仪器昂贵。要求样本和检测器接触良好, 且对系统的时间精度和灵敏度要求非常高。 Expensive. Good contact between the sample and the detector is needed. Requirement of time accuracy and sensitivity of system is very high. |
| 空间分辨 Spatial-resolved(SR) |
R(r) | 测量方便, 速度快, 仪器较时间分辨便宜。 Convenient, quick, and cheaper than time-resolved instrument. |
||||
| 频域分辨 Frequency-domain(FD) |
M, θ | 要求样本和检测器接触良好, 与时间分辨相比要求更精细光源。目前在果蔬方面应用较少。SFDI可以表征体积和空间差异。 Good contact between the sample and the detector is required, and more sophisticated light is needed. Now, it is less applicated in fruits and vegetables. SFDI can be used to represent the difference between the volume and space. |
||||
| 积分球 Integrating sphere(IS) |
反向倍加 Adding-doubling |
组织切片; 溶液 Tissue; solution |
R, T, Tc | μa, μ's, g | 不限于强散射样本和各向异性散射; 仅限于光学均一层介质; 只模拟光的反射角和透射角的分布, 不适用于光的空间分布。 Not limited to the strong scatter-ing samples and anisotropy scattering. Limited to the optical homogenizing medium. Just for the simulation of the reflected angle and transmission angle of light, not for the spatial distribution of light. |
系统组成简单, 成本较低, 准确度高。双积分球系统存在光串扰和校正困难两大问题。 Simple system composition, low cost, high accuracy. Crosstalk and difficult correc-tion exist in double integrating sphere. |
| 注: SFDI:空间频域成像Spatially-frequency domain imaging; M:幅值变化量The amplitude modulation; θ:相位延迟角The phase shift; R:漫反射率Diffuse reflectance; T:漫透射率Diffuse transmittance; Tc:准直透射率Collimated transmittance. | ||||||
果实成熟过程中, 伴随着糖、酸、叶绿素等组分含量变化和结构变化, 呈现颜色和硬度的变化。这些变化如何影响果实的光学性质还不是很清楚。目前, 已有一些学者测定了贮存期间果蔬光学性质的变化, 以进行果蔬色素和果胶物质含量的测定, 以及硬度与光学性质关系的研究。在可见光和近红外光波段, 果蔬吸收系数光谱主要存在花青素吸收峰(525 nm附近)、叶绿素吸收峰(675 nm附近)和水的吸收峰(970 nm和1 440~1 490 nm附近)[16, 40]。随着‘红星’桃成熟, 525 nm处花青素吸收增加, 675 nm处叶绿素吸收减小[40]。散射系数光谱在500~1 000 nm表现出米氏散射现象, 随波长增加, μ's缓慢减小[41-42], 且果蔬组织的μ's均高于μa近10倍, 这也印证了果蔬组织为高散射介质。动力学模型结果显示, ‘Spring Bright’油桃果肉的褪绿(在670 nm处的μa)和果实的软化(硬度)是高度同步的, 随着成熟度增加, μa减小, 因此, 采收时, 在670 nm处的μa可以用来描述和评估果实的成熟度[43]。多糖醛酸(GA)是果胶的主要成分, 是质构变化最相关的生化指标。Vanoli等[44]发现‘乔纳金’苹果在1 ℃贮存6个月后, 水溶性果胶(WSP)、草酸溶性果胶(OSP)中GA含量增加, 残留的不溶性果胶(RIP)中GA含量和原果胶指数(PI)减小, 显示果胶增溶, 硬度减小。在630和670 nm处的μa与RIP中GA含量呈正相关, 而在630、670、750和780 nm处的μs'与硬度呈负相关, 且随着果实变软, μs'增大。同样, 在Rowe等[45]研究中也发现在550~900 nm处‘皇家嘎啦’果实的μ's与硬度均呈负相关。而Cen等[40]发现‘金冠’和‘澳洲青苹’的μa和μ's与果实硬度均呈正相关, 且激光共聚焦显微镜分析表明, μa和μ's与细胞的面积和等效直径也呈正相关。出现μ's与果实硬度出现正负相关性不同的原因可能是水分损失和细胞壁的酶解作用显著影响果实硬度[46], 而两者又影响光学性质:一方面, 水分损失导致细胞变小, 气体填充增加, 导致折射率不匹配, 散射增强。同时, 酶解使细胞间产生新的黏附, 胞间层断裂增加新的气体空间, 使散射增加。另一方面, 酶解又导致细胞壁结构破坏, 散射减弱。尽管这些研究结果不同, 但显示了基于μa和μ's测定果实组分含量、硬度或成熟度的可能性。
TR、HISR、IS也可用来测定不同部位(如果皮和果肉)、不同品种和不同类型果蔬的光学性质, 以探究这些因素对测量结果的影响。表 2总结了不同技术测得的果蔬在不同波段下的μa、μ's、g值。
| 技术 Technique |
产品 Product |
品种 Variety |
部位 Part |
波长(λ)/nm Wavelength |
吸收系数(μa)/cm-1 Absorption coefficient |
约化散射系数(μ's)/cm-1 Reduced scattering coefficient |
各向异性因子(g) Anisotropy factor |
参考文献 Reference |
| TR | 苹果 Apple |
金冠 Golden Delicious |
整果 Intact fruit |
610~700 | 0.01~0.12* | 12.0~15.0 | [23] | |
| 澳洲青苹 Granny Smith |
0.01~0.25* | 8.0~13.0 | ||||||
| 红星 Starking Delicious |
0.02~0.16* | 13.0~22.0 | ||||||
| 苹果 Apple |
金冠 Golden Delicious |
650~1 000 | 0.02~0.42* | 21.0~23.0* | [48] | |||
| 澳洲青苹 Granny Smith |
0.02~0.42* | 18.0~20.0* | ||||||
| 红星 Starking Delicious |
0.02~0.42* | 22.0~24.5* | ||||||
| 黄桃 Yellow peach |
0.02~0.45* | 21.0~23.0* | ||||||
| 猕猴桃Kiwifruit | 海沃德Hayward | 0.05~0.45* | 10.0~16.0* | |||||
| 番茄Tomato | Daniela | 0.04~0.48* | 6.0~9.3* | |||||
| 油桃Nectarine | Spring Bright | 670 | [41] | |||||
| 苹果Apple | Elstar | 540~940 | 0.30~0.58* | 15.5~18.2 | [11] | |||
| 李子Plum | Tophit plus | 0.02~1.42* | 5.0~8.5 | |||||
| HISR | 苹果Apple | 金冠 Golden Delicious |
整果 Intact fruit |
500~1 000 | 0.20~0.56* | 9.5~11.0* | [40] | |
| 蛇果Red Delicious | 0~0.62* | 12.0~12.6* | ||||||
| 富士Fuji | 0.20~0.48* | 11.5~12.0* | ||||||
| 桃Peach | 0.20~1.10* | 12.0~14.0 | ||||||
| 梨Pear | 0.02~0.40 | 8.0~9.0* | ||||||
| 猕猴桃Kiwifruit | 0.15~0.30* | 7.0~8.0* | ||||||
| 李子Plum | 0.04~1.18* | 7.6~8.1 | ||||||
| 黄瓜Cucumber | 0~0.50* | 9.0~10.0* | ||||||
| 西葫芦 Zucchini squash |
0~0.45* | 10.5~11.5* | ||||||
| 苹果 Apple |
金冠 Golden Delicious |
500~1 000 | 0.05~045* | 10.2~13.2* | [38] | |||
| 澳洲青苹 Granny Smith |
0~0.45* | 9.5~12.2* | ||||||
| IS | 苹果 Apple |
皇家嘎啦 Royal Gala |
果皮 Skin |
350~2 200 | 0.10~7.00* | 10.0~35.0* | 0.70 | [45] |
| 澳洲青苹 Granny Smith |
10.0~32.0* | 0.63 | ||||||
| 布瑞本Braeburn | 10.0~28.0* | 0.67 | ||||||
| 皇家嘎啦 Royal Gala |
果肉 Flesh |
350~1 900 | 0.10~3.40* | 3.5~4.5* | 0.66 | |||
| 澳洲青苹 Granny Smith |
3.0~5.0* | 0.63 | ||||||
| 布瑞本Braeburn | 3.2~4.5* | 0.64 | ||||||
| 维达利亚甜洋葱 Vidalia sweet onion |
最外层干表皮 Outermost dry skin |
632.8 | 7.50* | 190.0* | 0.45* | [46] | ||
| 外层表皮 Outer skin |
3.00* | 40.0* | 0.59* | |||||
| 第一层果肉 First flesh |
0.50* | 1.0* | 0.71* | |||||
| 第二层果肉 Second flesh |
0.50* | 2.0* | 0.59* | |||||
| IS | 红洋葱 Red onion |
Salsa | 最外层干表皮 Outermost dry skin |
632.8 | 20.00* | 200.0* | 0.59* | [46] |
| 外层表皮Outer skin | 6.00* | 20.0* | 0.72* | |||||
| 第一层果肉 First flesh |
1.50* | 5.0* | 0.69* | |||||
| 第二层果肉 Second flesh |
1.00* | 5.0* | 0.70* | |||||
| 维达利亚甜洋葱 Vidalia sweet onion |
Century | 干皮Dry skin | 633 | 7.60 | 362.4 | 0.47 | [47] | |
| 湿皮Wet skin | 3.05 | 91.4 | 0.59 | |||||
| 果肉Flesh | 0.44 | 5.9 | 0.66 | |||||
| 红洋葱 Red onion |
Salsa | 干皮Dry skin | 19.74 | 479.9 | 0.59 | |||
| 湿皮Wet skin | 5.99 | 71.0 | 0.72 | |||||
| 果肉Flesh | 1.05 | 19.5 | 0.69 | |||||
| 白洋葱 White onion |
White Cloud | 干皮Dry skin | 5.01 | 293.9 | 0.37 | |||
| 湿皮Wet skin | 2.84 | 90.1 | 0.51 | |||||
| 果肉Flesh | 0.34 | 11.4 | 0.54 | |||||
| 黄洋葱 Yellow onion |
Granero | 干皮Dry skin | 13.71 | 493.6 | 0.55 | |||
| 湿皮Wet skin | 3.25 | 96.2 | 0.42 | |||||
| 果肉Flesh | 0.33 | 11.7 | 0.43 | |||||
| 苹果Apple | 皇家嘎啦 Royal Gala |
果肉Flesh | 400~1 050 | 0.10~1.45* | 8.0~16.0* | [43] | ||
| 猕猴桃 Kiwifruit |
佳沛Zespri Green | 果肉Flesh | 632.8 | 1.17 | 3.9 | 0.70 | [14] | |
| 种子Seed | 0.31 | 1.2 | ||||||
| 基座Seed-base | 3.08 | 9.5 | ||||||
| DIS | 马铃薯Potato | 爱马仕Hermes | 果肉Flesh | 500~1 900 | 0~34.00* | 6.6~8.3 | 0.95~0.97 | [16] |
| 注: TR:时间分辨Time-resolved; HISR:高光谱稳态空间分辨Hyperspectral imaging-based spatial resolved; IS:单积分球Integrating sphere; DIS:双积分球Double integrating sphere。*表示所引用文献中光学参数的估计值。*indicates estimated values obtained from the literature. The same as follows. | ||||||||
由表 2可见:相对于果肉组织, 果蔬表皮色素含量较高, 且表皮的细胞结构比果肉更紧密, 因此, 果皮与果肉的μa和μ's存在较大差异。Saeys等[47]运用积分球技术测得在可见光范围内苹果果皮的μa大于果肉, μ's的值大约是果肉的3倍。同样, Wang等[48-49]测得在632.8 nm和633 nm处洋葱表皮的μa和μ's比果肉均高18倍以上, 但不同层果肉间的光学性质无显著差异。原因可能是:洋葱果肉中水(含量大于90%)、果糖、蔗糖、蛋白质等含量高, 在632.8 nm和633 nm处均无强吸收, 且色素含量低, 因此吸收弱。而且洋葱表皮细胞结构比果肉更紧密, 散射更强。猕猴桃果肉、种子和基座3个部分在632.8 nm处也表现出不同的吸收和散射性质。种子和基座部分分别属于低散射、高吸收和高散射、低吸收介质, 而果肉μa和μ's均居中间, 且散射大于吸收。可能是因为色素含量不同, 种子部分的种子呈黑色, 基座部分中心呈白色, 造成种子部分高吸收, 而基座部分吸收最低[14]。
品种和类型不同也会引起组织光学性质的不同。Cubeddu等[23, 50]运用TR先后测定了‘澳洲青苹’ ‘红星’‘金冠’3个苹果品种在610~700 nm和650~1 000 nm的光学性质, 结果显示, 在610~700 nm处, 3个品种μa由大到小依次为‘澳洲青苹’ (0.01~0.25*cm-1)、‘红星’(0.02~0.16*cm-1)、‘金冠’(0.01~0.12*cm-1); 3个品种的μ's由大到小依次为‘红星’(13~22 cm-1)、‘金冠’(12~15 cm-1)、‘澳洲青苹’(8~13 cm-1)。在650~1 000 nm处也发现相同的规律, 而2次测量得到的值不同可能因为测量波段和果实成熟度不一样。Wang等[49]测定了红、甜、白、黄4种洋葱干皮和果肉在633 nm处的μa, 发现红洋葱干皮和果肉的μa最大, 白洋葱干皮的μa最小。此外, 根据叶绿素含量估算, 叶绿素含量由大到小依次为猕猴桃(6.91 μmol·L-1)、番茄(0.52 μmol·L-1)、黄桃(0.49 μmol·L-1), 且在670 nm附近, 3种果蔬的μa值与叶绿素含量成正相关[50]。Seiferta等[11]发现成熟过程中李子的散射强度变化比苹果更大, 在670 nm处, 苹果的μ's减少了14.7%(由18.2 cm-1减小为15.5 cm-1), 李果实的μ's减少了41.7%(由8.5 cm-1减小为5.0 cm-1)。
运用不同技术测得的同种果蔬的光学性质同样会存在差异。如运用TR所测‘澳洲青苹’的μ's(18~20 cm-1)高于IS所测的μ's(3~5 cm-1)近10倍[47, 50]。这种差异存在的原因:一是不同技术覆盖的光谱范围不同, 以及样本的成熟度存在差异; 二是测量方式或测量部位不同。TR检测的是整果的光学性质, 而IS测得的是果肉的光学性质, 所以很难去比较不同技术测量结果的好坏。
2.2 果蔬品质检测通过光学参数测量技术得到组织的μa和μ's, 结合化学计量学方法, 即可建立果蔬品质的检测模型。光学参数测量技术已用于果蔬可溶性固形物含量、硬度或成熟度[51-52]等品质的预测和分类, 以及品质缺陷的检测和区分[53]。
2.2.1 果蔬品质预测和分类Valero等[51]用TR测得在650~1 000 nm处‘海沃德’猕猴桃的μa和μ's, 结合判别分析对硬度、糖含量、酸度进行分类, 准确率分别为75%、60%和97%。进一步, 运用多元逐步线性回归建立硬度的预测模型, 调整决定系数(adjusted decided coefficient)R2为0.81, 而单独用μ's建立硬度的预测模型, R2为0.61。但由于激光腔热效应引起仪器漂移, Nicolaï等[54]运用TR预测‘Conference’梨SSC和硬度并未获得满意的模型。Rizzolo等[55]运用TR基于4个波长(630、670、750、780 nm)处的μa和μ's建立了‘乔纳金’苹果硬度、脆度、粉状、多汁性质构品质的分类模型, 准确率分别为70.7%、67.1%、71.9%和57.3%。但是, 质构参数与酸、甜、香气的分类模型总准确率只有56.1%。
Peng等[56]运用HISR测得450~1 000 nm‘金冠’苹果硬度和SSC的μa和μ's, 结合修正的洛伦兹方程很好地预测硬度和SSC, 相关系数分别为0.894和0.883, 预测标准误(standard error of prediction, SEP)分别为6.14 N和0.73%。分别筛选出21和23个预测硬度和SSC的波段。Cen等[12]运用HISR测量515~1 000 nm‘红星’桃的光学性质以评估桃成熟度, 结果表明, 基于最小二乘支持向量机和μa与μ's的组合值(如μa×μ's和μeff)建立的硬度、SSC、表皮和果肉亮度(L*)的预测模型比单独用μa或μ's的结果好, 最佳相关系数分别为0.749(SEP=17.39 N)、0.504(SEP=0.92 °Brix)、0.898(SEP=3.45)和0.741(SEP=3.27)。Trong等[57]运用HISR基于偏最小二乘法分别用μa和μ's建立‘布瑞本’苹果品质预测模型。用μa建立的硬度和SSC预测模型, 相关系数R2分别为0.71和0.81, 预测均方根交叉验证误差(RMSEP)分别为9.68 N和0.69%。用μ's建立的硬度预测模型, R2为0.73~0.83, RMSEP为8.91~13.70 N。Zhu等[52]根据成熟度将‘Sun Bright’番茄分为绿色、破色、转色、粉色、浅红色、红色6个等级, 发现675 nm处吸收随成熟度增加逐渐减小, 在500~900 nm波段, μ's从绿色到转色期间逐渐减小, 但从粉色到红色逐渐增加; 基于偏最小二乘判别分析分别用μa, μ's, μa & μ's, μeff对番茄进行分类, 总准确率分别为86.0%、80.2%、86.3%和88.4%。用上述4组光学参数将番茄成熟度分为3个等级(绿色/破色, 转色/粉色, 浅红色/红色)时, 所得模型整体分类准确率分别为92.1%、84.4%、92.3%和92.1%。
He等[13]运用IS基于偏最小二乘回归用900~1 050 nm处梨的μa建立可溶性固形物含量的预测模型, 建模集和预测集R2分别为0.83和0.40, RMSEC和RMSEP分别为0.36%和0.68%;而用500~1 050 nm处梨的μ's建立硬度的预测模型, 建模集和预测集R2分别为0.67和0.48, RMSEC和RMSEV分别为1.66 N和2.21 N。试验没有完全成功的原因可能是切片过程中造成挤压, 使切片厚度和粗糙度不同。可以通过安装压力传感器或改变切片(刀)的结构减轻或避免这一问题。
2.2.2 果蔬品质缺陷的检测和区分果蔬采收, 采后处理, 运输和零售期间经常发生瘀伤, 导致品质等级下降。而且, 果蔬贮存期间, 由于生理失调或病害侵染, 会引起内部褐变或病害的产生。而这些症状往往不是从外部可以识别的, 只有在切割果蔬后才可见。目前, TR、SR和IS已用于果蔬外部和内部缺陷的检测和区分(表 3)。
| 技术 Technique |
产品 Product |
品种或类型 Variety or types |
λ/nm | μa/cm-1 | μ's/cm-1 | g | 应用 Application |
参考文献 Reference |
| TR | 梨 Pear |
Conference | 710~850 | 0.025~0.052* (0.06~0.085*) |
23.0~26.0* (23.0~25.0*) |
褐腐病检测 For detection of brown heart |
[51] | |
| 猕猴桃 Kiwifruit |
海沃德 Hayward |
650~1 000 | 硬度、糖含量、酸度的预测和分类 For prediction and classification of firmness, sugar content and acidity |
[49] | ||||
| 梨 Pear |
Conference | 875~1 030 | 0.05~0.52* | 18.0~33.0* | 硬度和可溶性固形物含量的预测 For prediction of firmness and soluble solids content |
[54] | ||
| 苹果 Apple |
乔纳金 Jonagored |
630 670 750 780 |
0.08~0.11 0.14~0.18 0.03~0.04 0.02~0.03 |
18.9~21.5 17.9~21.1 10.7~12.9 10.4~12.5 |
异常品质剔除 For selection of applea with distinctive qualty |
[53] | ||
| 苹果 Apple |
布瑞本 Braeburn |
670 | 0.08~0.10 (0.07~0.10) |
11.9~15.8 (13.2~15.1) |
内部褐变检测 For detection of internal browning |
[56] | ||
| 780 | 0.03~0.04 (0.03~0.04) |
|||||||
| 980 | 0.41~0.45 (0.41~0.46) |
|||||||
| HISR | 苹果 Apple |
金冠 Golden Delicious |
450~1 000 | 硬度和可溶性固形物含量的预测 For prediction of firmness and soluble solids content |
[54] | |||
| 苹果 Apple |
金冠 Golden Delicious |
500~1 000 | 0.10~0.90* (0~1.02) |
7.0~9.0* (4.2~5.8*) |
瘀伤检测 For detection of bruises |
[57] | ||
| 蛇果 Red Delicious |
0.12~0.50 (0~0.48*) | 7.2~9.0* (6.0~7.5*) |
||||||
| 桃 | 红星 Redstar |
515~1 000 | 0.01~0.45* | 6.0~17.5* | 成熟度评估 For maturity assessment |
[12] | ||
| 苹果 Apple |
布瑞本Braeburn | 500~1 000 | 0~2.60 | 5.7~135.3 | 硬度, 可溶性固形物含量的预测 For prediction of firmness and soluble solids content |
[55] | ||
| 番茄 Tomato |
Sun Bright | 500~950 | 0.01~0.27* | 3.6~9.3 | 成熟度分类 For classification of ripeness |
[50] | ||
| SFDI | 苹果 Apple |
金冠 Golden Delicious (bruised 0.06 J) |
650~980 | 0~0.54* (0~0.45*) |
6.4~11.0* (4.2~7.0*) |
瘀伤检测 For detection of bruises |
[33] | |
| 金冠 Golden Delicious (bruised 0.315 J) |
0.02~1.24* (0.04~1.42*) |
7.5~13.8* (4.4~9.0*) |
||||||
| IS | 梨 Pear |
圆黄Yuanhuang | 400~1 150 | 0~0.50* | 4..5~7.0* | 0.70 | 硬度和可溶性固形物含量的预测 For prediction of firmness and soluble solids content |
[13] |
| 黄洋葱 Yellow onion |
健康果皮 Healthy skin |
550~880 950~1 650 |
0.18~3.90* | 16.0~19.0* | 0.37~0.44* | 酸皮病和颈腐病的检测 For detection of sour skin and neck rot disease |
[15] | |
| 酸皮病果皮 Sour skin |
0.12~5.20* | 18.0~20.5* (0.3~0.7*) |
||||||
| 颈腐病果皮 Neck rot |
0.25~5.90* | 18.0~22.0* | ||||||
| 注:SFDI:空间频域成像。括号内、外分别为病害和健康组织的参数值。 Note: SFDI:Spatially-frequency domain imaging. The parameters of the disease and healthy tissue are respectively represented in and out of brackets. |
||||||||
褐腐病是梨在气调贮藏过程中偶然出现的内部紊乱。Zerbini等[53]用TR测得在710~850 nm, 褐腐病梨的μa(0.06~0.085*cm-1)明显高于健康组织μa(0.025~0.052*cm-1), 相差0.02~0.052*cm-1。‘布瑞本’苹果发生内部褐变时, 伴随着孔洞的产生, 从核向皮质部分延伸, 且往往呈不对称的空间分布。Vanoli等[58]研究了用TR无损检测‘布瑞本’苹果内部褐变的可能性, 发现随着褐变增加, 在780 nm处的μa增加, μ's减小。同时, 通过在780 nm处的μa和μ's建立健康苹果和内部褐变苹果的区分模型, 分类准确率分别为90%和71%。另一方面, 病变的不规则性增加了褐变检测的困难。今后, 需要研究TRS的不同配置, 如光线的位置、光源与样本的距离、时间分辨率等, 以便使检测得到更深组织的品质, 提高褐变检测精度。
Lu等[59]运用HISR区分正常和瘀伤苹果, 发现在500~1 000 nm处瘀伤对μ's的影响比μa大, 且瘀伤组织的μ's(‘金冠’为4.2~5.8 cm-1, ‘蛇果’为6.0~7.5*cm-1)远小于正常组织(‘金冠’为7~9*cm-1, ‘蛇果’为7.2~9.0 cm-1)。说明用μ's更适合去检测组织损伤。SFDI也用于检测瘀伤的‘金冠’苹果。以冲击能(单位为J)来代表苹果的瘀伤程度。在650~980 nm处, 2个瘀伤程度(0.060 J和0.315 J)的苹果相对于周围正常组织, μ's均明显减小[35]。Wang等[15]运用IS检测洋葱酸皮病(接种Burkholderia cepacia)和颈腐病(接种Botrytis aclada), 结果发现, 洋葱感染酸皮病菌后造成洋葱腐烂, 组织被水浸透, 增加了酸皮洋葱干皮在1 000 nm以上的吸收, 而果肉颜色呈浅棕色, 增加了果肉在可见光区域的吸收。另外, 细菌降解了重要的结构组分和细胞壁, 造成果肉变软, μ's减小。由于颈腐菌菌核和孢子生长, 使组织呈黑色, 颈腐洋葱干皮和果肉在550~880 nm范围内μa显著高于健康洋葱, 同时菌体生长增加了弹性散射, 颈腐洋葱干皮μ's显著大于健康洋葱。因此, 由于水分的改变, 存在用近红外波段区分酸皮病和健康洋葱干表皮的可能性。而根据μa和μ's的值都有区分颈腐病和健康洋葱干表皮的可能性。
3 总结与展望对于单层半无限组织模型下的光学参数测量, 时间分辨、空间分辨和频域分辨技术可以对活体组织进行无损检测, 结果也比较准确。而对于多层组织(如洋葱, 核果类果实)模型, 其准确性还有待进一步提高。不同于上述3种技术, 空间频域成像能够获得组织内部空间的差异, 因此有着广阔的应用前景。积分球系统组成和搭建简单, 成本较低, 很适合测量果蔬切片组织的光学特性参数。
光学参数测量技术可以分离果蔬组织的吸收和散射性质, 获得与组织组分和结构有关的信息, 已用于果蔬光学参数测量, 果蔬品质检测。但是, 由于仪器价格较高, 且存在仪器漂移, 测量速度慢或不方便等限制, 目前这些技术还只应用到一部分果蔬上。未来, 可以使用已知光学性质的标准反射样本对系统进行校正, 并对仪器精度和灵敏度、穿透深度等进行改良。同时, 在运用光学参数测量技术时, 应该考虑果蔬自身成熟度, 组分差异, 结构的不均匀性, 测量部位, 品种和类型, 以及所采用的测量技术和光谱覆盖范围等多方面因素, 以提高检测准确率。
通过以上分析, 探究果蔬组分和结构对光学性质的影响, 以提高未来果蔬品质分析的精度、稳定性和重现性, 将是今后研究工作的重点。
| [1] | Zidouk A, Styles I B. Using MAP to recover the optical properties of a biological tissue from reflectance measurements[C]//Ramanujiam N, Popp J. Clinical and biomedical spectroscopy and imagingⅡ. Proceedings of SPIE-OSA Biomedical Optics, 2011, 8087(1): 181-190. http://www.opticsinfobase.org/oe/abstract.cfm?uri=ECBO-2011-80872A |
| [2] | Leiva-Valenzuela G A, Lu R F, Aguilera J M. Prediction of firmness and soluble solids content of blueberries using hyperspectral reflectance imaging[J]. Journal of Food Engineering, 2013, 115(1): 91-98. DOI: 10.1016/j.jfoodeng.2012.10.001 |
| [3] | Pan L Q, Zhang Q, Zhang W, et al. Detection of cold injury in peaches by hyperspectral reflectance imaging and artificial neural network[J]. Food Chemistry, 2016, 192: 134-141. DOI: 10.1016/j.foodchem.2015.06.106 |
| [4] |
孙世鹏, 彭俊, 李瑞, 等. 基于近红外高光谱图像的冬枣损伤早期检测[J].
食品科学, 2017, 38(2): 301-305.
Sun S P, Peng J, Li R, et al. Early detection of mechanical damage in Chinese winter jujube(Zizyphus jujuba Mill. cv. Dongzao) using NIR hyperspectral images[J]. Food Science, 2017, 38(2): 301-305. DOI: 10.7506/spkx1002-6630-201702047 (in Chinese with English abstract) |
| [5] |
陈桂云, 吴威, 黄玉萍, 等. 基于短波近红外光谱技术的原蜜高果糖浆掺假度鉴别[J].
南京农业大学学报, 2014, 37(6): 165-170.
Chen G Y, Wu W, Huang Y P, et al. Determination of raw honey adulterated with high fructose corn syrup based on short wave near-infrared spectroscopy[J]. Journal of Nanjing Agricultural University, 2014, 37(6): 165-170. DOI: 10.7685/j.issn.1000-2030.2014.06.025 (in Chinese with English abstract) |
| [6] | Nogales-Bueno J, Baca-Bocanegra B, Rooney A, et al. Linking ATR-FTIR and Raman features to phenolic extractability and other attributes in grape skin[J]. Talanta, 2017, 167: 44-50. DOI: 10.1016/j.talanta.2017.02.008 |
| [7] | Rinnan Å, Bruun S, Lindedam J, et al. Predicting the ethanol potential of wheat straw using near-infrared spectroscopy and chemometrics:the challenge of inherently intercorrelated response functions[J]. Analytica Chimica Acta, 2017, 962: 15-23. DOI: 10.1016/j.aca.2017.02.001 |
| [8] | Zaccanti G, Bianco S D, Martelli F. Measurements of optical properties of high-density media[J]. Applied Optics, 2003, 42(19): 4023-4030. DOI: 10.1364/AO.42.004023 |
| [9] | Dahm D J. Explaining some light scattering properties of milk using representative layer theory[J]. Journal of Near Infrared Spectroscopy, 2013, 21(5): 323-339. DOI: 10.1255/jnirs.1071 |
| [10] | Jacques S L. Corrigendum:optical properties of biological tissues:a review[J]. Physics in Medicine and Biology, 2013, 58(11): 37-61. DOI: 10.1088/0031-9155/58/11/R37 |
| [11] | Seiferta B, Zude M, Spinelli L, et al. Optical properties of developing pip and stone fruit reveal underlying structural changes[J]. Physiologia Plantarum, 2015, 153: 327-336. DOI: 10.1111/ppl.2015.153.issue-2 |
| [12] | Cen H Y, Lu R F, Mendoza F A, et al. Assessing multiple quality attributes of peaches using optical absorption and scattering properties[J]. Transactions of the ASABE, 2012, 55(2): 647-657. DOI: 10.13031/2013.41366 |
| [13] | He X M, Fu X P, Rao X Q, et al. Assessing firmness and SSC of pears based on absorption and scattering properties using an automatic integrating sphere system from 400 to 1150 nm[J]. Postharvest Biology and Technology, 2016, 121: 62-70. DOI: 10.1016/j.postharvbio.2016.07.013 |
| [14] | Fang Z H, Fu X P, He X M. Investigation of absorption and scattering characteristics of kiwifruit tissue using a single integrating sphere system[J]. Journal of Zhejiang University-Science B(Biomedicine and Biotechnology), 2016, 17(6): 484-492. DOI: 10.1631/jzus.B1500086 |
| [15] | Wang W L, Li C Y, Gitaitis R D. Optical properties of healthy and diseased onion tissuse in the visible and near-infrared spectral region[J]. Transactions of the ASABE, 2014, 57(6): 1771-1782. |
| [16] | López-Maestresala A, Aemouts B, van Beers R, et al. Bulk optical properties of potato flesh in the 500-1900 nm range[J]. Food Bioprocess Technol, 2016, 9: 463-470. DOI: 10.1007/s11947-015-1639-0 |
| [17] | Patterson M S, Madsen S J, Moulton J D, et al. Diffusion equation representation of photon migration in tissue[J]. International Microwave Symposium Digest, 1991, 2(24): 905-908. |
| [18] | Prahl S A, van Gemert M J, Welch A J. Determining the optical properties of turbid media by using the adding-doubling method[J]. Applied Optics, 1993, 32(4): 559-568. DOI: 10.1364/AO.32.000559 |
| [19] | Wang L H, Jacques S L, Zheng L. MCML-Monte Carlo modeling of light transport in multi-layered tissues[J]. Computer Methods and Programs in Biomedicine, 1995, 47: 131-146. DOI: 10.1016/0169-2607(95)01640-F |
| [20] | Prahl S A. Light transport in tissue[D]. Austin, Texas: University of Texas, 1988. |
| [21] | Prahl S. Everything I think you should know about inverse adding-doubling[EB/OL]. 2011. [2017-06-19] http://omlc.ogi.edu/software/iad. |
| [22] | Patterson M S, Chance B, Wilson B C. Time-resolved reflectance and transmittance for the non-invasive measurement of tissue optical properties[J]. Applied Optics, 1989, 28(12): 2331-2336. DOI: 10.1364/AO.28.002331 |
| [23] | Cubeddu R, D'Andrea C, Pifferi A, et al. Time-resolved reflectance spectroscopy applied to the nondestructive monitoring of the internal optical properties in apples[J]. Appl Spectroscopy, 2001, 55(10): 1368-1374. DOI: 10.1366/0003702011953496 |
| [24] | Cen H Y. Hyperspectral imaging-based spatially-resolved technique for accurate measurement of the optical properties of horticultural products[D]. East Lansing, Michigan: Michigan State University, 2011. http://adsabs.harvard.edu/abs/2011PhDT.......195C |
| [25] | Reynolds L, Johnson C, Ishimaru A. Diffuse reflectance from a finite blood medium-applications to modeling of fiber optic catheters[J]. Applied Optics, 1976, 15(9): 2059-2067. DOI: 10.1364/AO.15.002059 |
| [26] | Farrell T J, Patterson M S, Wilson B. A diffusion theory model of spatially resolved, steady-state diffuse reflectance for the non-invasive determination of tissue optical properties in vivo[J]. Medical Physics, 1992, 19(4): 879-888. DOI: 10.1118/1.596777 |
| [27] | Groenhuis R A J, Ferwerda H A, Ten Bosch J J. Scattering and absorption of turbid materials determined from reflection measurements:1. Theory[J]. Applied Optics, 1983, 22(16): 2456-2462. DOI: 10.1364/AO.22.002456 |
| [28] | Huang Y P, Lu R F, Chen K J, et al. Development of a multichannel hyperspectral imaging probe for property and quality assessment of horticultural products[J]. Postharvest Biology and Technology, 2017, 133: 88-97. DOI: 10.1016/j.postharvbio.2017.07.009 |
| [29] | Zhu Q B, Guan J Y, Huang M, et al. Predicting bruise susceptibility of 'Golden Delicious' apples using hyperspectral scattering technique[J]. Postharvest Biology and Technology, 2016, 114: 86-94. DOI: 10.1016/j.postharvbio.2015.12.007 |
| [30] | Qin J W, Lu R F. Measurement of the absorption and scattering properties of turbid liquid foods using hyperspectral imaging[J]. Applied Spectrosscopy, 2007, 61(4): 388-396. DOI: 10.1366/000370207780466190 |
| [31] | Cen H Y, Lu R F. Optimization of the hyperspectral imaging-based spatially-resolved system for measuring the optical properties of biological materials[J]. Optics Express, 2010, 18(16): 17412-17432. DOI: 10.1364/OE.18.017412 |
| [32] | Ding C Z, Shi S N, Chen J J, et al. Analysis of light transport features in stone fruits using Monte Carlo simulation[J]. PLoS ONE, 2015, 10(10): e0140582. DOI: 10.1371/journal.pone.0140582 |
| [33] | Patterson M S, Moulton J D, Wilson B C, et al. Frequency-domain reflectance for the determination of the scattering and absorption properties of tissue[J]. Applied Optics, 1991, 30(31): 4474-4476. DOI: 10.1364/AO.30.004474 |
| [34] | Cuccia D J, Bevilacqua F, Durkin A J, et al. Modulated imaging:quantitative analysis and tomography of turbid media in the spatial-frequency domain[J]. Optics Letters, 2005, 30(11): 1354-1356. DOI: 10.1364/OL.30.001354 |
| [35] | Anderson E R, Cuccia D J, Durkin A J. Detection of bruises on Golden Delicious apples using spatial-frequency-domain imaging[J]. Proceedings of SPIE, 2007, 6430: 64301O. DOI: 10.1117/12.717608 |
| [36] |
夏扬. 基于频域光学相干层析术的人体皮肤高分辨率光学断层成像研究[D]. 南京: 南京理工大学, 2010.
Xia Y. High resolution optical tomography of human skin based on frequency-domain optical coherence tomography[D]. Nanjing: Nanjing University of Science and Technology, 2010(in Chinese with English abstract). http://cdmd.cnki.com.cn/Article/CDMD-10288-2010096504.htm |
| [37] |
汤顺青, 朱正芳. 积分球的系统误差分析[J].
计量技术, 2005(12): 30-32.
Tang S Q, Zhu Z F. Systematic error analysis of integrating sphere[J]. Measurement Technique, 2005(12): 30-32. DOI: 10.3969/j.issn.1000-0771.2005.12.009 (in Chinese with English abstract) |
| [38] | Pickering J W, Prahl S A, van Wieringen N, et al. Double-integrating-sphere system for measuring the optical properties of tissue[J]. Applied Optics, 1993, 32(4): 399-410. DOI: 10.1364/AO.32.000399 |
| [39] | Bevilacqua F, Depeursinge C. Monte Carlo study of diffuse reflectance at source-detector separations close to one transport mean free path[J]. Journal of the Optical Society of America A, 1999, 16(12): 2935-2945. DOI: 10.1364/JOSAA.16.002935 |
| [40] | Cen H Y, Lu R F, Menddoza F, et al. Relationship of the optical absorption and scattering properties with mechanical and structural properties of apple tissue[J]. Postharvest Biology and Technology, 2013, 85: 30-38. DOI: 10.1016/j.postharvbio.2013.04.014 |
| [41] | Mie G. Beiträge zur optik trüber mediens, speziell kolloidaler metallösungen[J]. Annalen der Physik, 1908, 25(3): 377-445. |
| [42] | Qin J W, Lu R F. Measurement of the optical properties of fruits and vegetables using spatially resolved hyperspectral diffuse reflectance imaging technique[J]. Postharvest Biology and Technology, 2008, 49(3): 355-365. DOI: 10.1016/j.postharvbio.2008.03.010 |
| [43] | Tijskens L M M, Zerbini P E, Schouten R E, et al. Assessing harvest maturity in nectarines[J]. Postharvest Biology and Technology, 2007, 45(2): 204-213. DOI: 10.1016/j.postharvbio.2007.01.014 |
| [44] | Vanoli M, Zerbini P E, Spinelli L, et al. Polyuronide content and correlation to optical properties measured by time-resolved reflectance spectroscopy in 'Jonagored' apples stored in normal and controlled atmosphere[J]. Food Chemistry, 2009, 115: 1450-1457. DOI: 10.1016/j.foodchem.2009.01.081 |
| [45] | Rowe P I, Künnemeyer R, Mcglone A, et al. Relationship between tissue firmness and optical properties of 'Royal Gala' apples from 400 to 1050 nm[J]. Postharvest Biology and Technology, 2014, 94: 89-96. DOI: 10.1016/j.postharvbio.2014.03.007 |
| [46] | Hertog M L A T, Ben-Arie R, Róth E, et al. Humidity and temperature effects on invasive and non-invasive firmness measures[J]. Postharvest Biology and Technology, 2004, 33(1): 79-91. DOI: 10.1016/j.postharvbio.2004.01.005 |
| [47] | Saeys W, Velazco-Roa M A, Thennadil S N, et al. Optical properties of apple skin and flesh in the wavelength range from 350 to 2200 nm[J]. Applied Optics, 2008, 47(7): 908-919. DOI: 10.1364/AO.47.000908 |
| [48] | Wang W L, Li C Y. The optical properties of onion dry skin and flesh at the wavelength 632. 8 nm[C]//Kim M S, Tu S I, Chao K L. Sensing for Agriculture and Food Quality and Safety IV. Proceedings of SPIE, 2012, 8369: 83690G. http://spie.org/x648.html?product_id=919855 |
| [49] | Wang W L, Li C Y. Measurement of the light absorption and scattering properties of onion skin and flesh at 633 nm[J]. Postharvest Biology and Technology, 2013, 86: 494-501. DOI: 10.1016/j.postharvbio.2013.07.032 |
| [50] | Cubeddu R, D'Andrea C, Pifferi A, et al. Nondestructive quantification of chemical and physical properties of fruits by time-resolved reflectance spectroscopy in the wavelength range 650-1000 nm[J]. Applied Optics, 2001, 40(4): 538-543. DOI: 10.1364/AO.40.000538 |
| [51] | Valero C, Ruiz-Altisent M, Cubeddu R, et al. Detection of internal quality in kiwi with time-domain diffuse reflecance spectroscopy[J]. Applied Engineering in Agriculture, 2004, 20(2): 223-230. DOI: 10.13031/2013.15879 |
| [52] | Zhu Q B, He C L, Lu R F, et al. Ripeness evaluation of 'Sun Bright' tomato using optical absorption and scattering properties[J]. Postharvest Biology and Technology, 2015, 103: 27-34. DOI: 10.1016/j.postharvbio.2015.02.007 |
| [53] | Zerbini P E, Grassi M, Cubeddu R, et al. Nondestructive detection of brown heart in pears by time-resolved reflectance spectroscopy[J]. Postharvest Biology and Technology, 2002, 25(1): 87-97. DOI: 10.1016/S0925-5214(01)00150-8 |
| [54] | Nicolaï B M, Verlinden B E, Desmet M, et al. Time-resolved and continuous-wave NIR reflectance spectroscopy to predict soluble solids content and firmness of pear[J]. Postharvest Biology and Technology, 2008, 47(1): 68-74. DOI: 10.1016/j.postharvbio.2007.06.001 |
| [55] | Rizzolo A, Vanoli M, Spinelli L, et al. Sensory characteristics, quality, and optical properties measured by time-resolved reflectance spectroscopy in stored apples[J]. Postharvest Biology and Technology, 2010, 58(1): 1-12. DOI: 10.1016/j.postharvbio.2010.05.003 |
| [56] | Peng Y K, Lu R F. Analysis of spatially resolved hyperspectral scattering images for assessing apple fruit firmness and soluble solids content[J]. Postharvest Biology and Technology, 2008, 48: 52-62. DOI: 10.1016/j.postharvbio.2007.09.019 |
| [57] | Trong N N D, Rizzol A, Herreman E, et al. Spatially resolved diffuse reflectance in the visible and near-infrared wavelength range for non-destructive quality assessment of 'Braeburn' apples[J]. Postharvest Biology and Technology, 2014, 91: 39-48. DOI: 10.1016/j.postharvbio.2013.12.004 |
| [58] | Vanoli M, Rizzolo A, Grassi M, et al. Studies on classification models to discriminate 'Braeburn' apples affected by internal browning using the optical properties measured by time-resolved reflectance spectroscopy[J]. Postharvest Biology and Technology, 2014, 91: 112-121. DOI: 10.1016/j.postharvbio.2014.01.002 |
| [59] | Lu R F, Cen H Y, Huang M, et al. Spectral absorption and scattering properties of normal and bruised apple tissue[J]. Transactions of the ASABE, 2010, 53(1): 263-269. DOI: 10.13031/2013.29491 |