文章信息
- Yan Lei, Gao Xiang, Wang Tengyu, Pang Lei, Su Lin, Kang Yongzhen
- 闫磊, 高翔, 王腾雨, 庞磊, 苏霖, 康永祯
- A Measurement Method of Log Diameter for Rotary Cutting Machines Based on Image Processing
- 一种基于图像处理的旋切原木直径测量方法
- Scientia Silvae Sinicae, 2019, 55(5): 125-133.
- 林业科学, 2019, 55(5): 125-133.
- DOI: 10.11707/j.1001-7488.20190514
-
文章历史
Received date: 2018-03-16;
Revised date: 2018-05-22
-
作者相关文章
2. 哈尔滨工业大学电气工程与自动化学院 哈尔滨 150001
2. School of Electrical Engineering & Automation, Harbin Institute of Technology Harbin 150001
The rotary cutting machine is important equipment which designed for glued veneer manufacture. Before cutting the logs into a veneer, the logs are peeled using a specific process. Currently available rotary cutting machines can be divided into manual, semi-automatic, and automatic types based on the degree of automation. When tree peeling is used to determine the round roll distance, the automatic rotary cutting machine is no doubt the simplest method but is often expensive and lacks economic applicability. Thus, the semi-automatic rotary cutting machine is used in most small-and-medium sized factories. With this machine, the log removal process often requires full-time personnel to manually adjust the distance between the rolls so the three-roller shafts can clamp logs for peeling. This method of visual observation is not only a waste of manpower, but also a lack of objectivity.
At present, methods of measuring log diameter can be divided into two categories: contact measurement and non-contact measurement (Hapca et al., 2007; Kan et al., 2007). Traditional contact measurement methods usually use diameter tapes, wheel rulers, and hook rulers for manual measurement (Cheng et al., 2013; Ma et al., 2015). These methods use manpower and have low efficiency and accuracy (Wang et al., 2013; Clark et al., 2000). The non-contact measurement method is generally supported by electro-optical and electromagnetic technology. It can obtain a measurement result without touching the surface of the object being measured, and the measurement is more objective (Zeng et al., 2009; Sun et al., 2006). Although the current non-contact measurement method is highly precise, it has slow measuring speed, limited economic applicability as well as high cost (Malcomb, 2014; Zhao et al., 2012).
Image measurement technology is an important field of research and application in image processing and analysis. It has the characteristics of non-contact, full field measurement and high accuracy. For many dynamic measurements, image processing measurement can be used to complete the whole measurement process. Therefore, image measurement has an irreplaceable advantage. The full field measurement characteristics of image measurement technology enable the measurement of the characteristics of the target in the whole field of view. Traditional measurement is time-consuming, labor-saving, low precision and error prone.
Therefore, a non-contact log measurement method of log diameter for rotary cutting machine based on image processing technology is proposed in this paper. The aim is to reduce unnecessary waste of manpower and try to find the most economical equipment. By using the knowledge of image processing technology, the rotary cutting machine can turn to lower cost and automatically detect the diameter of logs. At the same time, it also improves the efficiency and production efficiency. First, a line laser was used as an auxiliary light source to capture images using a camera with a filter. Then, based on the single-channel binary image, five different calculation methods were used to calculate the pixel number or distance representing the diameter of logs. After calibration, the related curves of mathematical models were fitted through the MATLAB platform. Finally, the measurement results and relevant conclusions could be obtained. The method has two advantages: 1) the non-contact measurement method based on image processing technology is adopted to avoid the shortcomings of low accuracy and low efficiency of the traditional contact measuring method; 2) on the basis of meeting the requirements of measurement accuracy, the problems of tedious operation, long time and high cost of other high precision non-contact measuring methods have been solved while saving manpower and demonstrating improved economic applicability.
1 Experimental equipment 1.1 Laser light sourceTo easily find the diameter of the straight line, two auxiliary light sources were selected to assist with diameter measurement: a red line laser source and an infrared line laser source as shown in Fig. 1, specific parameters are listed in Tab. 1 (Sun et al., 2000). When the light source was vertically irradiated on the object's surface, the camera was controlled to collect image information with the laser light source. Then, image processing technology was used to conduct a series of processes on the captured images to observe the effect of using different external light sources for image acquisition and segmentation. Ultimately, the type of laser light source used in the experiment was determined.

|
Fig.1 Line laser sources |
|
|
To mitigate the impact of ambient light on measurement results, a narrow band-pass filter was customized for the USB-interface driverless high-definition industrial camera. Narrow band-pass filters, which are subdivided from the band-pass filter, allow only optical signals in a particular wavelength band to pass; optical signals on either side that deviate from this wavelength band are blocked, typically below 5% of the center wavelength. For the selected laser light source, a narrow band filter measuring 940 nm was chosen finally.
1.3 Image acquisition equipmentTwo different cameras for different laser light sources were selected: a Raspberry Pi camera and USB-interface driverless high-definition industrial camera; the specific parameters are shown in Tab. 2.
|
|
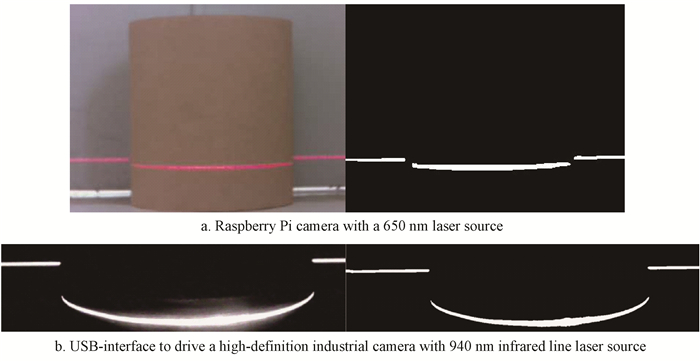
Image information captured with the red line laser source and infrared line laser source are shown in Fig. 2.
|
Fig.2 Original image and image segmentation effect |
For the original image, due to the addition of the filter, the captured images filtered out the interference of ambient light. The laser line was clearly more conducive to image processing. For the effect of image segmentation, the results of subsequent segmentation of the images collected by the filter was better, the threshold range was larger, and the edge of the laser line segment had no missing information. Image segmentation without a filter was poor, and the edge information was lost; hence, the calculation produced a large error.
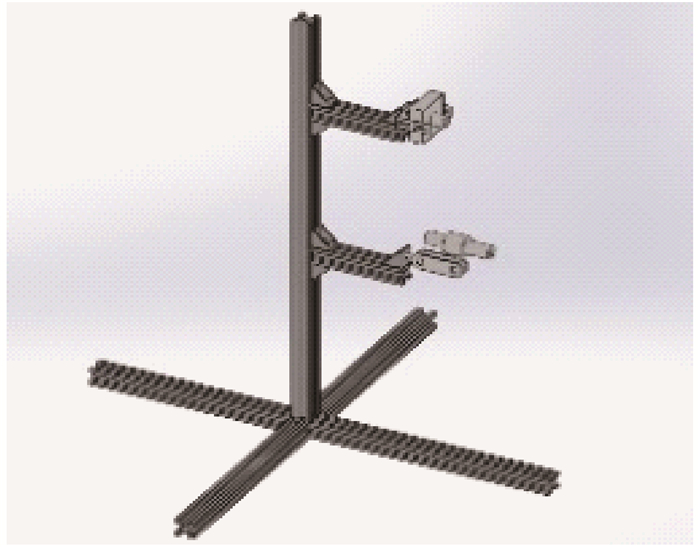
1.4 Building hardware systemThe section bar of size of 20 mm×20 mm was selected as a fixed stent for the laser and the camera, as shown in Fig. 3. Among them, the main frame was 50 cm and had a slideway, which facilitated adjustment of the distance between the camera and the laser. The camera and laser were kept in same vertical plane which can also adjust the distance between the camera and the laser by using the slide. The distance between the camera and the farthest point distance of captured object was fixed. And the laser level was maintained in the middle position of the image.
|
Fig.3 Fixed support for the laser and the camera |
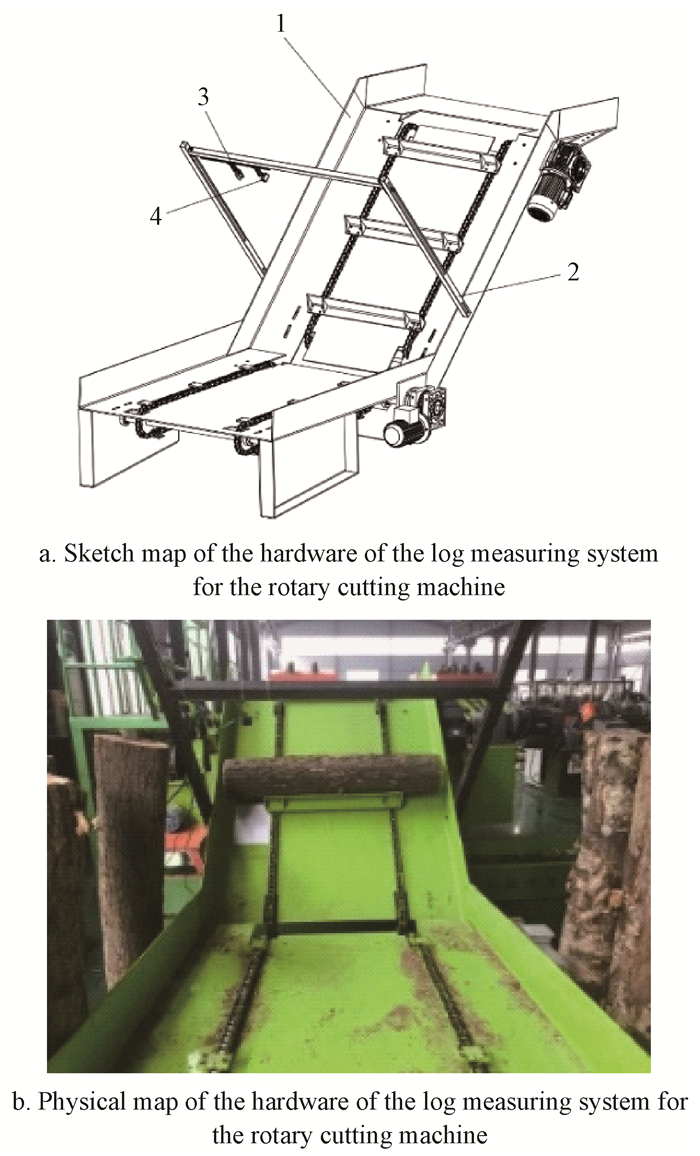
The construction of the hardware system was mainly completed using the section bar. A highly adjustable bracket was installed on the vertical conveyor plate to the rotary cutting machine. Finally, the camera and the laser-fixed bracket were installed on the beam to complete the system, as shown in Fig. 4.
|
Fig.4 Building hardware system on the rotary cutting machine 1: Rotary cutting machine; 2: The highly adjustable bracker; 3: Laser; 4: Camera(The location of bracket for fixing 3 and 4 are mounted on beams as shown in figure). |
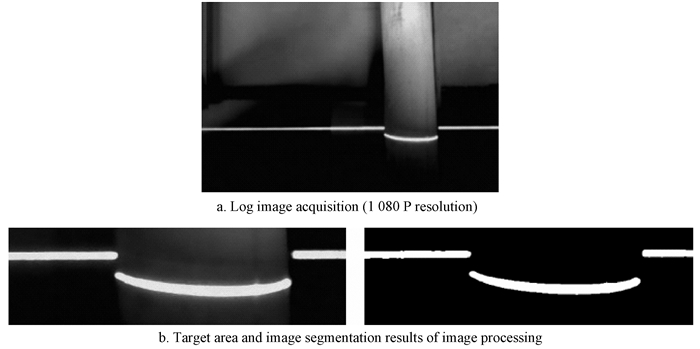
The target of measurement was determining the log diameter, and the most important aspect of it was the laser line on which the diameter of log was located. Because a filter was added to the experiments, the laser line segmented in the images was obvious. The image processing steps of the log image was further explored, as shown in Fig. 5.

|
Fig.5 Flow chart of image processing method |
At first, because both sides of the laser line were absorbed in the air, the middle target area by processing the color RGB image data captured by the camera was intercepted to ensure the integrity of both sides of the line segment. Secondly, to reduce the amount of information, improve computing speed, and reduce interference, the RGB three-channel image was separated into a single-channel, gray-level image (Hong, 2010). An infrared laser with an additional light source of 940 nm was selected and chosen to carry out subsequent image processing on the R channel map. Then, image segmentation based on the gray threshold value was performed for R channel images, which were then converted into a single-channel binary image. Next, because a small amount of noise appeared at the edge of the laser line, subsequent image processing was affected. Therefore a Gauss filter was added to process the single-channel binary image. Then, the edge information of the middle laser line could be extracted segmentation from the processed image by using the Canny operator. Finally, the connected region was marked to obtain each region's attributes in the binary image. Log image processing was then complete.
2.2 Calculation methodsAccording to the rule of marking the connected area, from left to right and top to bottom, the three laser line segments from left to right are Area 1, Area 2, and Area 3 respectively, area 2 of which was the target measurement area.
2.2.1 Calculate the arc length in the middle regionIn this calculation method, the object of the calculation was the length of the laser line's arcline. The pixel value of Area 2 was entered into the new matrix for storage. Because the processed image was a logical binary image, the value of the element in the matrix was either 0 or 1. To obtain the arc length of Line 2 in the area, every column element point in the region was traversed. Meanwhile, the last pixel of every column was marked as the pixel point on the arc line, and finally the distance between every two pixel points was accumulated as the arc length.
2.2.2 Calculate the perimeter for the averageBecause the laser line was not a single-pixel width curve, it decided to calculate the number of neighboring pixels on the laser line. The regional attribute function regionprops was used to derive regional properties of Area 2.
The return value of regionprops function is STATS, which is a structure array of max. The corresponding structure array domain defines the measurement under each area's attributes. Properties can be a list of strings separated by several commas, which containing unit array of character string and single string 'all' or 'basic'. If the properties are equal to the string 'all', then all the measurement data in the list of all the subsequent strings are calculated. If the properties are not specified or equal to 'basic', the attributes 'Area', 'Centroid', and 'Bounding Box' will be calculated.
By calculating the perimeter property of STATS (2), the number of pixels in the laser segment's circumference in Area 2 was obtained along with the average number of pixels to get the calculation result of the number of long arc pixels.
2.2.3 Calculate the skeletonThis calculation suggests that the skeleton of the laser line segment of Area 2 can be extracted and turned into a single-pixel width. Then the number of pixel can be calculated. Extracting the skeleton of captured images is called image thinning (Li et al., 2014; Jia, 2012). The skeleton of the captured images consists of lines and curves (single-pixel width is ideal). The skeleton can provide information about the target image, such as its size and shape; thus, the skeleton plays an important role in digital image analysis. (Choi et al., 2003; Xu et al., 2017).
For single-channel binary images, the bwmorph function was used to carry out the mathematical morphology operation. In the bwmorph (BW, operation, n) function, the operation is a string, which is used to specify the morphological processing type; parameter 'n' can be set as lnf (infinity), meaning that the image will be processed in the same morphology until the image ceases to change.
At first, the operation was setted to 'Skel' to extract the skeleton and keep the object image unbroken, but not change the image's Euler number. Then, the operation was set to 'thin' for the extraction of skeleton thinning, 'n' was set to infinity, and the processing result was a single-pixel curve. Then the 'clean' operation was used to remove the isolated point in the image. Finally, the 'spur' operation was employed to remove the small branch which called removing bone spurs. In the end, the number of pixels of the arc's single-pixel width was calculated after the skeleton.
2.2.4 Calculate radius of the fitting circle method using the least square methodDue to the laser line segment is an arc, the least square method was selected to fit the circle. The least square method is a mathematical optimization technique that matches the best function of a set of data by minimizing the square of the error. The least square method is the simplest method to obtain absolute unknowable true values, and the sum of the square error of the error is smallest (Wang et al., 2013; Xiong et al., 2017). The least square method is usually used for curve fitting. We suppose the equation of the circle is R2=(x-A)2+(y-B)2, and we let a=-2A, b=-2B, and c=A2+B2-R2. Thus, another form of the equation of the curve can be obtained: x2+y2+ax+by+c=0. As long as parameter a, parameter b, and parameter c are removed, the parameters of the radius of the center can be obtained:A=-a/2, B=-b/2, and R=1/2 a2+b2-4c.
To improve accuracy when using this method, we chose the image based on skeleton refinement through the skeleton pixel point on the circle-fitting arc. Finally, we obtained the fitting circle radius.
2.2.5 Calculate the number of pixels in the X-axisTo find the straight line in the log diameter, the number of pixels in the direction of the X-axis can be chosen to represent the log diameter. In this calculation method, the number of pixels in the direction of the X-axis of Area 2 was considered as the calculation target. Using the regionprops function to extract the same logical matrix with the size of Area 2, the number of columns in the matrix represented the number of pixels in the direction of the X-axis.
3 Fitting and result analysis 3.1 Make the log modelCalibration requires a certain number of logs with a specific diameter, which are hard to find.
Therefore, customized foam models pasting the coffee color cards which were similar to the log's color were used to replicate the logs and conduct the calibration experiment. Cardboards, an art knife, scissors, and glue were used to make the models.
The diameters of the customized foam models were 20, 25, 30, 35, 40, 45, and 50 cm respectively, wrapping with several A0 cardboards. After cutting the cardboard around the customized foam model, the log model was created (hereafter referred to as the tree model). The completion effect diagram is shown in Fig. 6.

|
Fig.6 Process of making the customized foam model and finished products |
Seven customized foam models were put on the baffles of the rotary cutting machine severally to collect images and the distance between the camera and laser was adjusted suitably through the chute of the profile. When collecting the image of the smallest-diameter log, the distance between the transmission board and camera shall be adjusted to the suitable distance to guarantee that three laser lines would not be collinear. The distance between the transmission board and the camera was stationary and then customized foam models were tested and recorded individually. In the image acquisition process, the object distance was set to 95 cm; the vertical distance between the camera and the laser was set to 25.3 cm. The size of the log models' values which measured by different calculation methods were recorded to arrange into tabular data. The customized foam models' different sizes were measured repeatedly and ultimately the average values were derived as the basis for data fitting.
3.3 MATLAB fitting data curveFor the collected data, the fitting curve tool in Matlab was selected to conduct data fitting and test six different ways to fit the data separately which was eventually determine to the best fitting curve expression. The x value used for fitting represented the measured value, and the y value represented the real diameter of the customized foam models (i.e., [200 250 300 350 400 450 500]). The array which was used to store the diameters of the customized foam models was stored in the MATLAB workspace, and the mathematical models was obtained through data fitting (Sun, 2006).
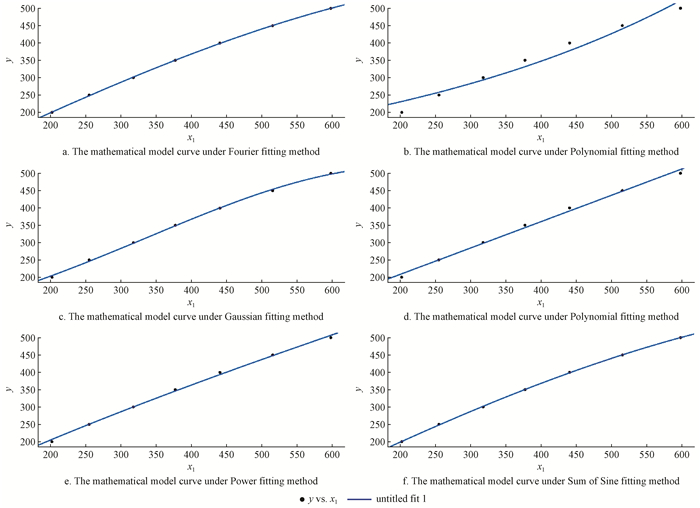
The goodness data of different fitting methods was obtained and compiled into Tab 3. Taking the method of calculating the number of pixels in the X axis as an example, the mathematical models obtained by each fitting methods are shown in Fig. 7.
|
|
|
Fig.7 The mathematical models obtained by different fitting methods |
Compared with goodness data of fitting and the fitting effects of curves when using the same calculation methods but different fitting methods, the Fourier fitting method and the Sum of Sine fitting method were best, and the exponential fitting method was worst. Comparing goodness data of fitting in the case of different calculation methods but the same fitting method, regardless of the Fourier fitting method or Sum of Sine fitting method, the method of calculating the number of pixels in the X-axis direction had the best goodness of fitting.
Finally, the Fourier fitting method and the Sum of Sine fitting method were decided to obtain the mathematical models respectively which were used to calculate the log's diameter. One of the seven logs which had different sizes was photographed to take as an example to show the effect of image processing as shown in Fig. 8. The final measurement values and error analysis from the data were shown in Tab. 4, Tab. 5 and Tab. 6.
|
Fig.8 The effect of raw wood image processing (with one of the logs as an example) |
|
|
|
|
|
|
According to the method of calculating the number of pixels in X axis, error analysis was made for two fitting methods which had similar effects as shown in the following tables.
The Fourier fitting method had the best indices in error analysis, and the absolute measurement error percentage was only 1.7%, within 5% of the error required by the rotary lathe factory. However, when the Fourier fitting method was applied, two log measuring errors exceeded the average absolute error; the same occurred for the Sum of Sine fitting method.
The reasons for the above phenomena are as follows:
1) Because the log bark surface is not smooth, there may be protruding scarring and shedding bark in some places, and unbalanced trunk thickness may appear, which will affect measurement accuracy.
2) Due to the complex experimental environment and strong illumination in the factory, the brightness of the laser line in the collected image was weakened, resulting in poor image segmentation and poor measurement accuracy.
4 ConclusionIn this paper, a new method of non-contact measurement of log diameter based on image processing technology was proposed. This image measurement method not only reduced the artificial error of the traditional measurement method, but also solved the problem of high cost and tedious measurement of non-contact measurement. An invisible infrared laser was selected as the auxiliary light source for image acquisition and the image processing techniques was used to segment the image of the target area. After calibrating the log models, the mathematical model was obtained by the best fitting method. Finally, the real value of the log was calculated by the mathematical model obtained by fitting tool. The effectiveness and accuracy of the method were verified by experimental measurements on a rotary cutting machine in the factory. The measurement accuracy was within the rotary lathe factory's allowable range.
Cheng P L, Liu J H, Wang D. 2013. Measuring diameters at breast height using combination method of laser and machine vision. Transactions of The Chinese Society of Agricultural Machinery, 44(11): 271-275. |
Choi W P, Lam K M, Siu W C. 2003. Extraction of the euclidean skeleton based on a connectivity criterion. Pattern Recognition, 36(3): 721-729. DOI:10.1016/S0031-3203(02)00098-5 |
Clark N A, Wynne R H, Schmoldt D L, et al. 2000. An assessment of the utility of a non-metric digital camera for measuring standing trees. Computers and Electronics in Agriculture, 28(2): 151-169. |
Hapca A I, Mothe F, Leban J M. 2007. A digital photographic method for 3D reconstruction of standing tree shape. Annals of Forest Science, 64(6): 631-637. DOI:10.1051/forest:2007041 |
Hong Y.2010.Study of object measurement system based on image processing. Xi'an: MS thesis of Shaanxi University of Science and Technology.[in Chinese]
|
Jia T M. 2012. Study on the pruning point locating method of the grapevine winter pruning robot. Hangzhou: MS thesis of Zhejiang University of Technology.[in Chinese]
|
Kan J M, Li W B, Sun R S. 2007. Computer vision based method of automatic measurement of trunk and branch diameters of standing trees. Journal of Beijing Forestry University, 29(4): 5-9. |
Li P Z, Zhou X C, Zhang C L, et al. 2014. Method of 3D visualization for plant root architecture in situ based on skeleton model. Computer Engineering and Design, 35(11): 3913-3917. |
Ma J D, Li S H, Zhu Y J. 2015. Study of the forest measurement inspection methods based on HALCON. Forest Engineering, 31(3): 57-59. |
Malcomb J R. 2014. Laser profilometry for non-contact automated countersink diameter measurement. SAE International Journal of Aerospace. DOI:10.4271/2014-01-2255 |
Sun H, Sun M, Wang Y M. 2006. Status and trend of research on non-destructive measurement of plant growth based on machine vision. Transactions of the Chinese Society for Agricultural Machinery, 37(10): 181-185. |
Sun R S. 2006. A study on machine vision identification for standing tree branches and trunks. Beijing: PhD thesis of Beijing Forestry University.
|
Sun L F, Yan C S. 2000. The system of automatic log diameter measurement using a mobile Laser. Journal of Nanjing Forestry University, 24(3): 41-44. |
Wang J L, Li T, Wang D, et al. 2013. Measuring algorithm for tree's diameter at breast height based on optical triangular method and image processing. Transactions of the Chinese Society for Agricultural Machinery, 44(7): 241-245. |
Xiong J, Tian S L, Yang C L. 2017. Fault modeling on complex field using least-square circle fitting for linear analog circuits. IEEJ Transactions on Electrical and Electronic Engineering, 12(5): 638-645. DOI:10.1002/tee.2017.12.issue-5 |
Xu C, Xiao X, Luo Y, et al. 2012. New skeleton extraction method based on distance transform. Chinese Journal of Scientific Instrument, 33(12): 2851-2856. |
Zeng Q B, Liu C L, Miao Y B, et al. 2009. High accuracy measurement of grape stem diameter based on computer vision. Transactions of the Chinese Society for Agricultural Machinery, 40(12): 182-185. |
Zhao S L, Qu X H, Xing S J, et al. 2012. Large-scale diameter automatic measuring system based on laser non-contact measuring principle. Infrared and Laser Engineering, 41(8): 2185-2191. |
 2019, Vol. 55
