文章信息
- 邹杰, 丁建丽.
- Zou Jie, Ding Jianli.
- 2000—2014年中亚地区主要植被类型水分利用效率特征
- Changes of Water Use Efficiency of Main Vegetation Types in Central Asia from 2000 to 2014
- 林业科学, 2019, 55(3): 175-182.
- Scientia Silvae Sinicae, 2019, 55(3): 175-182.
- DOI: 10.11707/j.1001-7488.20190320
-
文章历史
- 收稿日期:2017-11-14
- 修回日期:2019-01-29
-
作者相关文章
地球上陆地生态系统的植被通过光合作用吸收大气中的CO2,同时通过蒸腾作用损失植物体内的水分,这一过程调节着叶片和大气之间的物质循环和能量交换(Field et al., 1995;Berry et al., 2010)。每单位水分损失所吸收的CO2量叫做水分利用效率(WUE,g·kg-1),WUE是陆地生态系统机理模型的重要参数,同时是生态系统中碳水循环的重要连接。在叶片尺度上,WUE是植物净光合速率与蒸腾速率的比值,主要由气孔导度来控制(李文娆等,2010;周秋平等,2009;李泽等,2017)。而在生态系统尺度上,WUE是初级生产力(GPP,gC·m-2)与蒸散发(ET:陆地表面土壤蒸发与树木蒸腾和植被截持之和,kg H2O·m-2)的比率,生态系统WUE由蒸散作用和植被物候控制(Tang et al., 2014)。随着全球气候变化影响日益加强和生态系统退化日益严重,深入了解生态系统WUE可提高模拟和预测碳水循环的能力,并可利于实现水资源优化管理。
生态系统WUE的季节动态变化的差异强烈依靠地理位置、气候因子、植被类型、植物群落组成和分布,所以准确评估WUE时需要的数据应在时间和空间上连续分布。在生态系统尺度上,ET的量化一直是个科学难题(Baldocchi, 2003;2008),其中植物的蒸腾速率和土壤、植被冠层蒸发速率的计算较为困难(Xiao et al., 2013)。因此很少有研究在大尺度上系统比较不同植被类型WUE和分析WUE的时间动态变化(Beer et al., 2009)。随着遥感技术发展,ET可通过遥感数据间接计算得到(Lu et al., 2010),同时植被遥感数据具有长时间序列的特点,可为大尺度WUE的连续监测提供保证,因此通过MODIS的总初级生产力GPP和陆地蒸散发量ET直接计算大尺度WUE已被多数学者应用(Zhao et al., 2005; Mu et al., 2011)。
关于生态系统WUE的研究,主要集中在全球尺度或湿润区(Keenan et al., 2013; Silva et al., 2013; Peñuelas et al., 2011)。中亚深居欧亚大陆腹地,是世界上最大的干旱区之一。近年来,受气候变化和人类活动影响,该地区生态系统发生了较大变化。最新研究表明,2000—2014年,因为温度上升和降水量略微下降,中亚地区遭遇了较大干旱,土壤水分含量下降明显(Li et al., 2017)。如何修复生态环境、合理利用水资源的问题尤为迫切。本研究选择中亚5国和中国新疆地区作为研究区,通过GPP和ET数据计算出中亚地区多年WUE均值,结合植被类型分类数据,比较不同植被类型WUE多年均值的差异,在此基础上分析WUE在海拔和纬度上的变化,探究中亚地区生态系统WUE空间分布基本特征,同时计算月尺度和年尺度WUE,从宏观角度揭示不同中亚地区WUE年内变化和年际变化规律。
1 研究区概况对中亚地区的定义一直有多种界定,参照Deng等(2016)的研究,本研究选择的中亚地区包括哈萨克斯坦、土库曼斯坦、乌兹别克斯坦、吉尔吉斯斯坦、塔吉克斯坦和中国新疆维吾尔自治区。研究区海拔高度自西向东逐渐升高,从土库曼斯坦和哈萨克斯坦西部的里海地区(-132 m)向东部山区(7 459 m)逐渐升高。气候类型自北向南从半干旱区向干旱区过渡,冬夏分明,昼夜温差大,光照充足,年均日照2 000~3 000 h,十分有利于农作物生长和养分积累。中亚地区主要植被类型为草原、森林和农田,草地大量分布在哈萨克斯坦,森林主要分布在高海拔地区,而在中亚地区南部有大面积的灌溉农田。
2 研究方法 2.1 数据来源与计算基于MODIS数据估算的WUE已通过通量塔实测数据的验证,表明二者相关系数达0.74~0.96(Tang et al., 2014)。本研究中生态系统水分利用效率WUE(g·kg-1)计算公式为:
| $ {\rm{WUE = GPP/ET}}{\rm{。}} $ | (1) |
式中:GPP为生态系统初级生产力(gC·m-2);ET为蒸散发(kg H2O·m-2)。数据来自MODIS的产品数据(https://modis.gsfc.nasa.gov/)。该产品中的GPP数据(MOD17)来自于一个多重产品计算:
| $ {\rm{GPP = }}{\varepsilon _{\max }} \times 0.45 \times {W_r} \times {f_{{\rm{PAR}}}} \times {f_{{\rm{VPD}}}} \times f。$ | (2) |
式中:εmax为最大光能利用效率;Wr为短波辐射,其中45%是光能有效辐射(PAR);fPAR为PAR中被植被光合作用吸收的那一部分,可从MODIS产品数据(MOD15A2)中获取;fVPD为水分胁迫(日饱和水汽压亏缺,VPD)对光能利用效率造成的减少量;f为日最低温度(Tmin)对光能利用效率造成的减少量。GPP数据时间分辨率为8天,空间分辨率为1 km,MOD17A2是月数据,MOD17A3是年数据。
ET产品数据(MOD16A3)基于彭曼公式计算。时间分辨率为月。高程数据来自NASA的STRM数据(http://srtm.csi.cgiar.org/),分辨率为30 m,重采样至1 km。
2.2 生态系统分类生态系统划分来自土地覆盖数据(MOD12Q1),空间分辨率1 km,该数据源采用马里兰大学土地类型分类表(UMD)。本研究将研究区土地覆盖类型整合成主要生态系统,见表 1。因MODIS成品数据中荒漠没有ET数据,本研究数据分析排除了荒漠。
|
|
研究时段为植被的生长季(4—10月),从2000年至2014年,通过15年间GPP和ET年均值来计算WUE平均值;同时计算15年中每个月WUE平均值;分析WUE在不同纬度和海拔上的变化规律;本研究按不同土地覆盖类型分析WUE,在比较不同植被类型WUE均值时采用单因素方差分析(One-way ANOVA)和最小显著差法(LSD)。
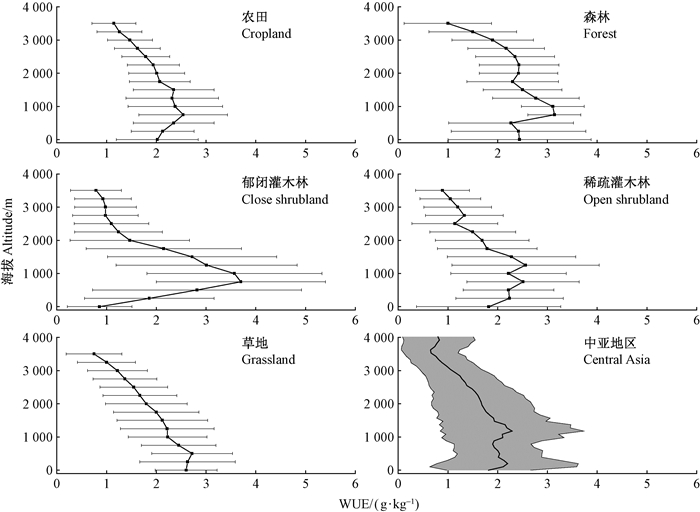
3 结果与分析 3.1 中亚地区WUE空间分布基本特征不同植被类型WUE与海拔的关系(图 1)表现为:从低海拔开始,随着海拔上升,WUE先呈增加趋势,海拔每增加1 m,农田、森林、郁闭灌木林、稀疏灌木林、草地WUE分别增加0.000 7、0.000 8、0.003 8、0.000 4和0.0 002 g·kg-1,其WUE高值区分别为海拔750,750,750,1 250和500 m,之后随海拔继续增加,WUE出现下降趋势,海拔每增加1 m,其下降量分别为-0.000 5、-0.000 6、-0.001 1、-0.000 7和-0.000 6 g·kg-1。相较于低海拔地区,高海拔地区的WUE值较低。

|
图 1 WUE随海拔变化 Fig. 1 WUE variation patternsalong altitude |
由图 2可知,32.5°~35°N时,随着纬度上升,WUE值逐渐增加,在35°出现最大值;从35°开始,随着纬度增加,WUE与纬度呈负相关(R2=0.94,P=0.018)。农田和郁闭灌木林WUE随纬度增加(由南向北)逐渐降低;而森林WUE随纬度增加逐渐升高,至50°时WUE到达最高值;稀疏灌木林WUE值仅在36°~38°较高,整体变化减少;草地WUE在不同区域的差异较小。对整个中亚地区而言,WUE从南至北呈现降低趋势。

|
图 2 WUE随纬度变化 Fig. 2 WUE variation patternsalong the latitude |
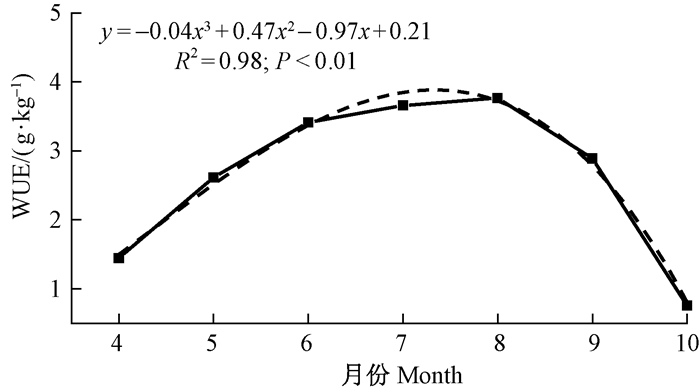
2000—2014年间,中亚地区多年月均WUE从4月开始逐渐上升,8月达到最大值3.77 g·kg-1,随后快速下降,10月份达到较低值,仅为0.75 g·kg-1,WUE的年内变化与植被的生长变化节律一致(图 3)。

|
图 3 中亚地区WUE月变化 Fig. 3 Trend analysis of the monthly mean WUE in five Central Asian countries and Xinjiang district 图中实线代表WUE的月变化,虚线代表拟合曲线 The solid line represents the monthly variation of WUE, the dotted line represents the fitting curve. |
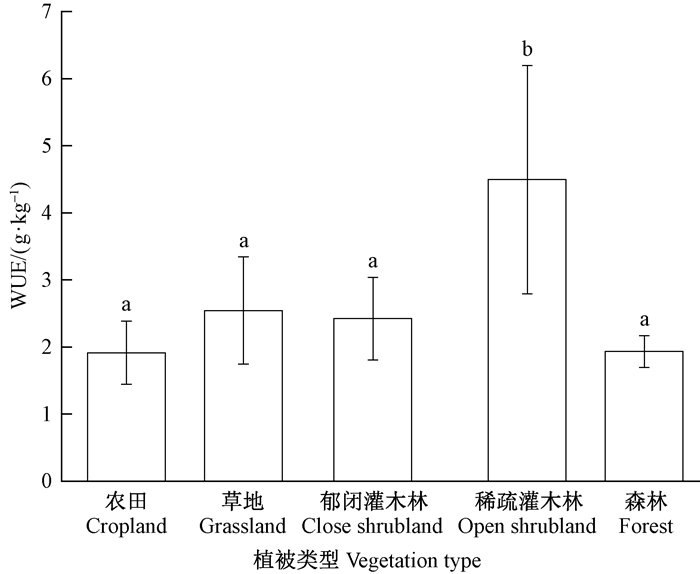
图 4表明,稀疏灌木林多年WUE均值显著高于其他土地覆盖类型(P < 0.05),达到4.49 g·kg-1,但是其值变化不稳定。其次为草地2.54 g·kg-1,农田和森林最低,分别为1.91和1.93 g·kg-1,同时其值变化幅度较小。农田较低的多年WUE均值可能与休耕期有关,休耕期地表植被较少、GPP值相对较低,但裸露的土壤蒸散发很大导致较低的WUE。

|
图 4 不同植被类型多年WUE均值比较 Fig. 4 Comparison of multiyear mean annual water use efficiency among the main vegetation types |
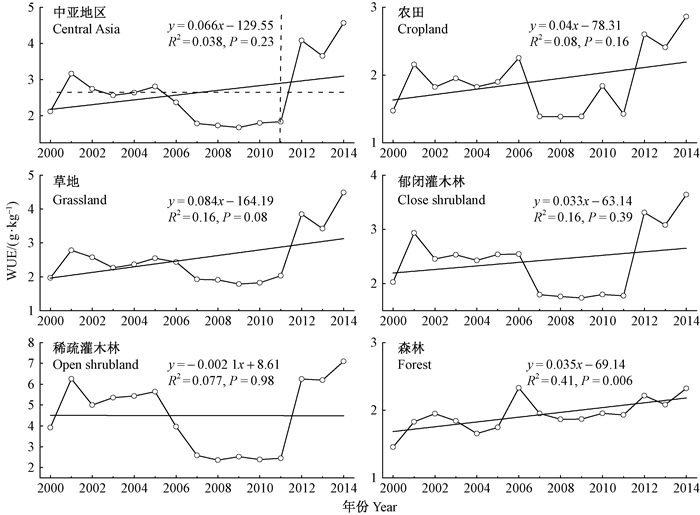
中亚地区WUE年际变化在2000—2011年呈下降趋势(图 5),其中2000—2005年WUE变化平稳,2006—2007年WUE值急剧下降,2007—2011年WUE值较低;从2011年后,WUE快速上升。WUE多年平均值为2.65 g·kg-1,其中2000年、2003年和2006—2011年WUE值均低于多年平均值。

|
图 5 不同植被类型WUE年际变化 Fig. 5 WUE temporal trends in of different biomes 图中实线代表变化斜率,水平虚线代表研究区多年WUE均值 The solid line represents the change slope of WUE fordifferent biomes, the horizontal dotted line represents the mean WUE. |
不同植被类型WUE的年际变化趋势基本一致(图 5),整体上2000—2005年变化较缓,2006—2011年除森林以外的其他植被类型WUE均急剧下降,到2011年后WUE快速增加。通过线性拟合可知,15年间除了稀疏灌木林WUE下降外,其他植被类型WUE均呈上升趋势,其中草地增加趋势最为明显。
4 讨论 4.1 不同植被类型WUE特征及规律MODIS产品数据可以计算大尺度WUE时空变化,且精度较高(Xu et al., 2016; Tang et al., 2016)。本研究中生产力较低的植被类型具有较高的WUE,如稀疏灌木林、草地和郁闭灌木林的WUE均较高,而森林和农田的WUE较低。究其原因为:一方面中亚地区WUE高值区主要分布在GPP相对较低的干旱区域(土库曼斯坦和乌兹别克斯坦),干旱地区植物叶片气孔导度对水分亏缺敏感,在光合速率还没减小之前,其气孔导度就已经降低,造成蒸腾速率减弱,进而使得WUE提高(He et al., 2003; Niu et al., 2008);另一方面干旱区较为匮乏的土壤水分也会导致较低蒸散值,因此在GPP较低的干旱区WUE的高值是较低的ET导致。而生产力较高的森林,通常水分条件较为优越,高温环境增加了土壤水分蒸发和植被蒸腾,进而导致该地区WUE较低。
不同植被类型在海拔500~1 250 m具有较高的WUE,因此这个海拔区间可能是植物生理生长的最适应区域。当海拔高于1 250 m时,WUE随海拔高度的增加而下降,这可能与高海拔地区的低温环境有关(张良侠等,2014;Hu et al., 2010)。本研究中随纬度的增加,森林WUE呈现上升趋势,农田和郁闭灌木林WUE呈现下降趋势,草地与稀疏灌木林WUE变化趋势不明显。农田和草地WUE的高值区分别位于36°N和32°N附近,这与Xue(2016)等人研究的WUE峰值区位于20°—25°N有所差异;本研究中森林WUE的峰值区位于50°N附近,Tang(2014)等人研究得到北半球WUE峰值区位于51°N附近,并证明51°N是光合辐射特点和植被水分利用差异共同作用形成。综上,本研究植被WUE在纬度上有一个峰值,而与前人结果的差异可能与研究区纬度范围有关。
4.2 WUE年内及年际变化原因分析本研究中WUE年内变化趋势与植被生长节律变化趋势一致。Hu(2008)等揭示了光合作用过程是WUE季节变化的主控因子。WUE年际变化整体呈现上升趋势,这与全球WUE年际变化趋势一致(Dan et al., 2010)。本研究中2006—2011年WUE下降明显,究其原因为中亚地区在该段时间遭遇了严重干旱(Li et al., 2017)。与其他时期(2000—2005年,2012—2014年)相比,农田、草地、郁闭灌木林、稀疏灌木林WUE分别下降了23.59%,32.05%,31.44%和53.34%,但森林上升了4.37%。稀疏灌木林分布在极端干旱荒漠区,当干旱发生时,光合作用中量子传递效率和羧化效率受到损伤,植物碳吸收能力下降,进而导致WUE大幅下降(Yu et al., 2008)。农田WUE下降相对较小,主要是受到人类补救措施影响,如抽取地下水灌溉农田、种植耐旱农作物等。而森林WUE在干旱时期有小幅上升,可能的原因是:1)森林生长在高海拔地区有融雪补给;2)森林生态系统的抗旱稳定性较其他生态系统强(丁惠萍等,2006;Tang et al., 2016),2006—2011年间的干旱没有到达森林抗旱力阈值,森林生态系统通过提高WUE来响应干旱;3)森林生态系统中植物叶片气孔限制对ET和GPP有着相似的影响强度(Brummer et al., 2012)。2012—2014年间各生态系统WUE均大幅提升,这可能与植被特殊的生理特性有关,干旱区植被遭受干旱胁迫时,通过减少地上生物量来减少水分耗散和呼吸耗散,同时将大量的营养物质积累在地下部分,当逆境消失后,植被会快速增加地上生物量进行光合作用,GPP的快速增加导致WUE的大幅提升。
4.3 WUE影响因子分析WUE变化趋势受到全球CO2浓度的影响,有研究得出全球GPP和WUE随着CO2浓度的升高稳定增加(Field et al., 1995;Keenan et al., 2013),另一研究揭示CO2浓度的增加导致全球WUE下降;Silva等(2013)通过研究大气CO2浓度对植被生长和固有WUE的影响发现,生态系统WUE变化对CO2浓度的升高并不敏感。在本研究中,WUE整体呈现上升趋势,但在2000—2010年间因干旱事件WUE下降明显。全球ET在1982—1997年间增加显著,1998年的厄尔尼诺事件发生以后,全球ET增加趋势开始减缓,直到2008年ET增加停止。微波遥感数据显示全球土壤水分在1998—2008年间呈现下降趋势(Jung et al., 2010)。土壤水分缺失导致的ET下降趋势也是中亚地区WUE发生变化的原因。
虽然气候变化主导着生态系统碳水循环变化,C3、C4植物的分布也影响到GPP和WUE的计算。C3和C4植物之间的WUE差异体现在光合作用途径不同。随着CO2浓度增加,与C3植物相比C4植物气孔导度关闭更多,蒸腾散失水分较少。Still等(2003)通过遥感产品、植物生理模型等绘制出的全球C3和C4植物分布图中,中亚地区北部分布着C4植物,在干旱区高温环境更有利于C4植物的生长,因此C4植物的分布也是导致WUE发生变化影响因子。
生态系统WUE还会受到人类活动影响,尤其在水资源匮乏的干旱地区。主要影响方式包括土地利用变化、火烧和收割、经济发展方式等(Tian et al., 2011)。例如大量研究得出农田WUE比自然植被WUE低(Law et al., 2002; Tian et al., 2010),虽然土地管理和施氮会增强灌溉区和非灌溉区WUE,但不断开垦农田依然会降低整个生态系统平均WUE。中亚地区自2001年以来进入了经济稳定增长期,该区域产业结构中的第一产业比重显著下降,其中哈萨克斯坦以能源出口为主,农业产值不断下降,而其他4国农业发展相对稳定(唐宏等,2015)。农业地位的下降也可能是近15年来中亚地区WUE逐渐增加的原因。塔吉克斯坦和吉尔吉斯斯坦矿产资源匮乏,经济结构以农业为主体,且农作物多为耗水作物导致该区域WUE较低。中国新疆地区农业生产投入科学管理,引用滴灌、喷灌、防渗渠等节水方式,新疆绿洲农田WUE比同纬度中亚国家农田WUE值高。水资源自然分布不均以及经济发展导致的跨界水资源利用矛盾也是该地区WUE发生变化的影响因素(邓铭江等,2010)。
4 结论1) 植被WUE空间分布有差异。WUE随海拔增加先增高后降低,高值主要分布在海拔500~1 250 m处;不同植被WUE的纬度峰值区存在差异,各植被类型出现的WUE峰值分别为农田36°N,郁闭灌木林32°N,稀疏灌木林36°—38°N,森林50°N,草地32°N。
2) 中亚地区WUE多年均值为2.65 g·kg-1,高于全球和湿润区,各植被类型多年平均WUE表现为稀疏灌木林>草地>郁闭灌木林>森林>农田。
3) 中亚地区WUE年内变化与植被生长节律一致,8月最大(3.77 g·kg-1);年际变化表现为2000—2011年间干旱导致WUE较低,但2011—2014年间快速上升。
邓铭江, 龙爱华, 章毅, 等. 2010. 中亚五国水资源及其开发利用评价. 地球科学进展, 25(12): 1347-1356. (Deng M J, Long A H, Zhang Y, et al. 2010. Assessment of water resources development and utilization in the five Central Asia countries. Advances in Earth Science, 25(12): 1347-1356. [in Chinese]) |
丁惠萍, 张社奇, 钱克红, 等. 2006. 森林生态系统稳定性研究的现状分析. 西北林学院学报, 21(4): 28-30. (Ding H P, Zhang S Q, Qian K H, et al. 2006. Analysis of present scientific research situation in stability of forest ecosystem. Journal of Northwest Forestry University, 21(4): 28-30. DOI:10.3969/j.issn.1001-7461.2006.04.007 [in Chinese]) |
李文娆, 张岁岐, 丁圣彦, 等. 2010. 干旱胁迫下紫花苜蓿根系形态变化及与水分利用的关系. 生态学报, 30(19): 5140-5150. (Li W R, Zhang S Q, Ding S Y, et al. 2010. Root morphological variation and water use in alfalfa under drought stress. Acta Ecologica Sinica, 30(19): 5140-5150. [in Chinese]) |
李泽, 谭晓风, 卢锟, 等. 2017. 干旱胁迫对两种油桐幼苗生长、气体交换及叶绿素荧光参数的影响. 生态学报, 37(5): 1515-1524. (Li Z, Tan X F, Lu K, et al. 2017. Influence of drought stress on the growth, leaf gas exchange, and chlorophyⅡ fluorescence in two varieties of tung tree seedlings. Acta Ecologica Sinica, 37(5): 1515-1524. [in Chinese]) |
唐宏, 陈大波. 2015. 中亚地区经济发展特征及时空演变. 中国科学院大学学报, 32(2): 214-220. (Tang H, Chen D B. 2015. Development features and temporal-spatial evolution of economy in Central Asia in the past 20 years. Journal of University of Chinese Academy of Sciences, 32(2): 214-220. [in Chinese]) |
张良侠, 胡中民, 樊江文, 等. 2014. 区域尺度生态系统水分利用效率的时空变异特征研究进展. 地球科学进展, 29(6): 691-699. (Zhang L X, Hu Z M, Fan J W, et al. 2014. Advances in the spatiotemporal dynamics in ecosystem water use efficiency at regional scale. Advances in Earth Science, 29(6): 691-699. [in Chinese]) |
周秋平, 程积民, 万惠娥, 等. 2009. 干旱胁迫下本氏针茅光合特性和水分利用效率日动态研究. 草地学报, 17(4): 510-514. (Zhou Q P, Cheng J M, Wan H E, et al. 2009. Study on the diurnal variations of photosynthetic characteristics and water use efficiency of Stipa bungeana Trin under drought stress. Acta Agrestia Sinica, 17(4): 510-514. [in Chinese]) |
Baldocchi D D. 2003. Assessing the eddy covariance technique for evaluating carbon dioxide exchange rates of ecosystems:past, present and future [review]. Global Change Biology, 9(4): 479-492. DOI:10.1046/j.1365-2486.2003.00629.x |
Baldocchi D. 2008. Breathing of the terrestrial biosphere:lessons learned from a global network of carbon dioxide flux measurement systems. Australian Journal of Botany, 56(1): 1-26. DOI:10.1071/BT07151 |
Beer C, Ciais P, Reichstein M, et al. 2009. Temporal and among-site variability of inherent water use efficiency at the ecosystem level. Global Biogeochemical Cycles, 23(2): GB2018. |
Berry J A, Beerling D J, Franks P J. 2010. Stomata:key players in the earth system, past and present. Current Opinion in Plant Biology, 13(3): 232-239. DOI:10.1016/j.pbi.2010.04.013 |
Brummer C, Black T A, Jassal R S, et al. 2012. How climate and vegetation type influence evapotranspiration and water use efficiency in Canadian forest, peatland and grassland ecosystems. Agricultural & Forest Meteorology, 153(1): 14-30. |
Dan L, Ji J. 2010. The surface energy, water, carbon flux and their intercorrelated seasonality in a global climate-vegetation coupled model. Tellus Series B-chemical & Physical Meteorology, 59(3): 425-438. |
Deng H, Chen Y. 2017. Influences of recent climate change and human activities on water storage variations in Central Asia. Journal of Hydrology, 544: 46-57. DOI:10.1016/j.jhydrol.2016.11.006 |
Field C B, Jackson R B, Mooney H A. 1995. Stomatal responses to increased CO2:implications from the plant to the global scale. Plant Cell & Environment, 18(10): 1214-1225. |
He W M, Zhang X S. 2003. Responses of an evergreen shrub Sabina vulgaris, to soil water and nutrient shortages in the semi-arid Mu Us Sandland in China. Journal of Arid Environments, 53(3): 307-316. DOI:10.1006/jare.2002.1051 |
Hu Z M, Yu G R, Fan J W, et al. 2010. Precipitation-use efficiency along a 4500-km grassland transect. Global Ecology & Biogeography, 19(6): 842-851. |
Hu Z M, Yu G R, Fu Y L, et al. 2008. Effects of vegetation control on ecosystem water use efficiency within and among four grassland ecosystems in China. Global Change Biology, 14(7): 1609-1619. DOI:10.1111/j.1365-2486.2008.01582.x |
Ito A, Inatomi M. 2012. Water-use efficiency of the terrestrial biosphere:a model analysis focusing on interactions between the global carbon and water cycles. Journal of Hydrometeorology, 13(2): 681-694. DOI:10.1175/JHM-D-10-05034.1 |
Jung M, Reichstein M, Ciais P, et al. 2010. Recent decline in the global land evapotranspiration trend due to limited moisture supply. Nature, 467(7318): 951-954. DOI:10.1038/nature09396 |
Keenan T F, Hollinger D Y, Bohrer G, et al. 2013. Increase in forest water-use efficiency as atmospheric carbon dioxide concentrations rise. Nature, 499(7458): 324-327. DOI:10.1038/nature12291 |
Law B E, Falge E, Gu L, et al. 2002. Environmental controls over carbon dioxide and water vapor exchange of terrestrial vegetation. Agricultural & Forest Meteorology, 113(1/4): 97-120. |
Li Z, Chen Y, Fang G, et al. 2017. Multivariate assessment and attribution of droughts in Central Asia. Scientific Reports, 7(1). |
Lu X L, Zhuang Q L. 2010. Evaluating evapotranspiration and water-use efficiency of terrestrial ecosystems in the conterminous United States using MODIS and AmeriFlux data. Remote Sensing of Environment, 114(9): 1924-1939. DOI:10.1016/j.rse.2010.04.001 |
Mu Q, Zhao M, Running S W. 2011. Improvements to a MODIS global terrestrial evapotranspiration algorithm. Remote Sensing of Environment, 115(8): 1781-1800. DOI:10.1016/j.rse.2011.02.019 |
Niu S, Wu M, Han Y, et al. 2008. Water-mediated responses of ecosystem carbon fluxes to climatic change in a temperate steppe. New Phytologist, 177(1): 209-19. |
Peñuelas J, Canadell J G, Ogaya R. 2011. Increased water-use efficiency during the 20th century did not translate into enhanced tree growth. Global Ecology & Biogeography, 20(4): 597-608. |
Silva L C, Horwath W R. 2013. Explaining global increases in water use efficiency:Why have we overestimated responses to rising atmospheric CO2 in natural forest ecosystems?. Plos One, 8(1): e53089. DOI:10.1371/journal.pone.0053089 |
Still C J, Berry J A, Collatz G J, et al. 2003. Global distribution of C3 and C4 vegetation:carbon cycle implications. Global Biogeochemical Cycles, 17(1): 6-1. |
Tang X, Li H, Desai A R, et al. 2014. How is water-use efficiency of terrestrial ecosystems distributed and changing on Earth?. Scientific Reports, 4(4): 7483. |
Tang X, Li H, Xu X, et al. 2016. Potential of MODIS data to track the variability in ecosystem water-use efficiency of temperate deciduous forests. Ecological Engineering, 91: 381-391. DOI:10.1016/j.ecoleng.2016.02.022 |
Tian H, Chen G, Liu M, et al. 2010. Model estimates of net primary productivity, evapotranspiration, and water use efficiency in the terrestrial ecosystems of the southern United States during 1895-2007. Forest Ecology & Management, 259(7): 1311-1327. |
Tian H, Lu C, Chen G, et al. 2011. Climate and land use controls over terrestrial water use efficiency in monsoon Asia. Ecohydrology, 4(2): 322-340. DOI:10.1002/eco.216 |
Xiao J, Sun G, Chen J, et al. 2013. Carbon fluxes, evapotranspiration, and water use efficiency of terrestrial ecosystems in China. Agricultural & Forest Meteorology, 182-183(22): 76-90. |
Xu X, Tang X. 2016. Remote estimation of ecosystem water-use efficiency of irrigated and rainfed maize croplands with MODIS data. Fresenius Environmental Bulletin, 25(5): 1382-1393. |
Xue B L, Guo Q, Otto A, et al. 2016. Global patterns, trends, and drivers of water use efficiency from 2000 to 2013. Ecosphere, 6(10): 1-18. |
Yang Y, Guan H, Shang S, et al. 2014. Toward the use of the MODIS ET product to estimate terrestrial GPP for nonforest ecosystem. IEEE Geoscience & Remote Sensing Letters, 11(9): 1624-1628. |
Yu G, Song X, Wang Q, et al. 2008. Water-use efficiency of forest ecosystems in eastern China and its relations to climatic variables. New Phytologist, 177(4): 927-937. DOI:10.1111/nph.2008.177.issue-4 |
Zhang F, Ju W, Shen S, et al. 2014. How recent climate change influences water use efficiency in East Asia. Theoretical & Applied Climatology, 116(1/2): 359-370. |
Zhao M, Heinsch F A, Nemani R R, et al. 2005. Improvements of the MODIS terrestrial gross and net primary production global data set. Remote Sensing of Environment, 95(2): 164-176. DOI:10.1016/j.rse.2004.12.011 |
 2019, Vol. 55

