文章信息
- Shahzad MuhammadKhurra, 韩斐斐, 姜立春
- Shahzad Muhammad Khurra, Han Feifei, Jiang Lichun
- 不同抽样方法对兴安落叶松立木材积方程预测精度的影响
- Effects of Different Sampling Methods on Predict Precision of Individual Tree Volume Equation for Dahurian Larch
- 林业科学, 2018, 54(8): 99-105.
- Scientia Silvae Sinicae, 2018, 54(8): 99-105.
- DOI: 10.11707/j.1001-7488.20180811
-
文章历史
- 收稿日期:2016-10-11
- 修回日期:2017-01-03
-
作者相关文章
立木材积方程在林业数表编制、森林资源调查、生物量和碳储量研究等方面有着广泛应用(Muukkonen,2007;Özçelik et al., 2010;Yoon et al., 2013;Gonzalez-Benecke et al., 2014)。构建立木材积方程,通常基于伐倒木实测数据,为了建模和验证模型,一般将数据分成建模数据和验证模型数据。而数据抽样作为模型建立的基础,直接影响模型参数估计的变化,间接影响所建模型的精度(Westfall et al., 2007;McRoberts et al., 2014;Berger et al., 2014;Green et al., 2014),因此为了避免资源浪费并提高工作效率,构建材积模型时设计合理的数据抽样方法是十分必要的。目前,国内外关于建模数据抽样主要有以下3种方法:1)均匀取样,即将数据分成不同径阶,然后每个径阶抽取相同数量的样木(通常不少于30株)(Tabacchi et al., 2011;刘静婷等,2016);2)正态分布取样,即数据集中分布在中等径阶,小径阶和大径阶样木较少(Salis et al., 2006;Wang,2006;Özçelik et al., 2010);3)左偏或右偏分布取样(Jiang et al., 2005;Inoue,2006;Nogueira et al., 2006;Brooks et al., 2007;2008;Özçelik et al., 2008;Westfall et al., 2010),在统计上也称偏态分布(skewed distribution),即数据集中位置偏向左侧或右侧。而关于不同抽样方法对立木材积方程预测精度的影响还鲜见报道。
鉴于此,本研究以兴安落叶松(Larix gmelinii)立木材积方程为例,设计均匀、正态、右偏和左偏4种抽样方法,根据不同数据类型,采用广义模型方法拟合材积方程,并通过引入误差方差函数处理模型拟合过程中产生的异方差现象;利用检验数据,分析比较不同抽样方法对立木材积方程预测精度的影响,以期能提出较广泛材积数据的抽样方法,为各地编制不同树种材积表及构建立木材积方程提供基础数据抽样技术依据。
1 数据与方法 1.1 数据研究所用数据来自大兴安岭伊勒呼里山北坡(西林吉、图强、阿木尔、呼中林业局和漠河林场)的兴安落叶松天然林。树木伐倒后,测量胸径、树高、冠幅和树冠高度等因子,在树高的0、0.02、0.04、0.06、0.08、0.1、0.15、0.2、0.3、0.4、0.5、0.6、0.7、0.8和0.9长度处将树干区分为15段,测量每段的下部直径,通过区分求积法计算立木材积。样木按胸径4~8、8~12、12~16、16~20、20~24、24~28、28~32、32~36、36~40、40~44、44~48 cm共11个径阶进行分组。根据研究内容不同设计均匀、正态、右偏和左偏4种抽样方法,对每个径阶按不同数据类型随机抽样,每种抽样方法建模样本为330株,利用总体1 566株样本进行检验。建模和检验数据径阶分布详见表 1。
|
|
根据不同数据类型,利用SAS软件中proc surveyselect模块的简单随机抽样(SRS)并结合条件语句对数据进行分径阶抽样。采用Shapiro-Wilk对不同抽样方法下的胸径统计量进行正态性检验。
1.2.2 立木材积方程及异方差校正常用的立木材积方程包括一元材积方程和二元材积方程。二元材积方程在实际应用时树高通常采用预测值,即将二元材积方程转化为一元材积方程,因此本研究直接采用以下形式的一元材积方程:
| $ V = a{D^b} + \varepsilon 。$ | (1) |
式中:V为材积;D为胸径;ε为误差项;a、b为方程参数。
在通常的立木材积方程中,误差一般都随自变量、因变量预测值增大而增大,即呈现出明显的异方差性(Uzoh et al., 2008)。本研究采用广义非线性模型方法,引入指数函数、幂函数和常数加幂函数消除异方差,并比较求得的AIC和BIC以确定一个最适当的误差方差模型(Pinheiro et al., 2000)。
指数函数:
| $ g({\mu _i}, \alpha) = {\rm{exp}}(\alpha {\mu _i})。$ | (2) |
幂函数:
| $ g({\mu _i}, \beta) = {\left| {{\mu _i}} \right|^\beta } $ | (3) |
常数加幂函数:
| $ g({\mu _i}, \delta) = {\delta _1} + {\left| {{\mu _i}} \right|^{{\delta _2}}}。$ | (4) |
式中:μi为第i株林木的胸径(D)、材积观测值(V)或预测值(
拟合结果采用确定系数(R2)和均方根误差(RMSE)进行评价;检验结果通过平均误差绝对值(MAB)和相对误差绝对值(MPB)进行检验。相应的数学表达式为:
| $ {R^2} = 1 - \left[ {\frac{{\sum\limits_{i = 1}^n {{{({y_i} - {{\hat y}_i})}^2}} }}{{\sum\limits_{i = 1}^n {{{({y_i} - \hat y)}^2}} }}} \right]; $ | (5) |
| $ {\rm{RMSE = }}\sqrt {\frac{{\sum\limits_{i = 1}^n {{{({y_i} - {{\hat y}_i})}^2}} }}{{n - 1}}} ; $ | (6) |
| $ {\rm{MAB = }}\frac{{\sum\limits_{i = 1}^n {\left| {{y_i} - {{\hat y}_i}} \right|} }}{n}; $ | (7) |
| $ {\rm{MPB = }}\frac{{\sum\limits_{i = 1}^n {\left| {{y_i} - {{\hat y}_i}} \right|} }}{{\sum\limits_{i = 1}^n {{{\hat y}_i}} }} \times 100。$ | (8) |
式中:yi为实测值;
从表 2可以看出,均匀抽样、正态抽样的平均值、最小值和最大值比较接近,而均匀抽样的标准差和变异系数明显大于其他抽样方法。基于均匀抽样和正态抽样数据的偏度近似等于0(0.009 8、0.024 2),2种抽样数据分布形状较为对称。基于右偏抽样数据的偏度小于0(-0.510 5),说明样本数据在均值左侧较为分散。基于左偏抽样数据的偏度大于0(0.505 3),说明样本数据在均值右侧比较分散。4种样本数据的峰度均小于0,说明均值两侧的极端数据较少。Shapiro-Wilk正态性检验表明,只有正态抽样数据的P大于0.05(P=0.085 6),即服从正态分布,而其他3种抽样方法的P均小于0.000 1,即不服从正态分布。
|
|
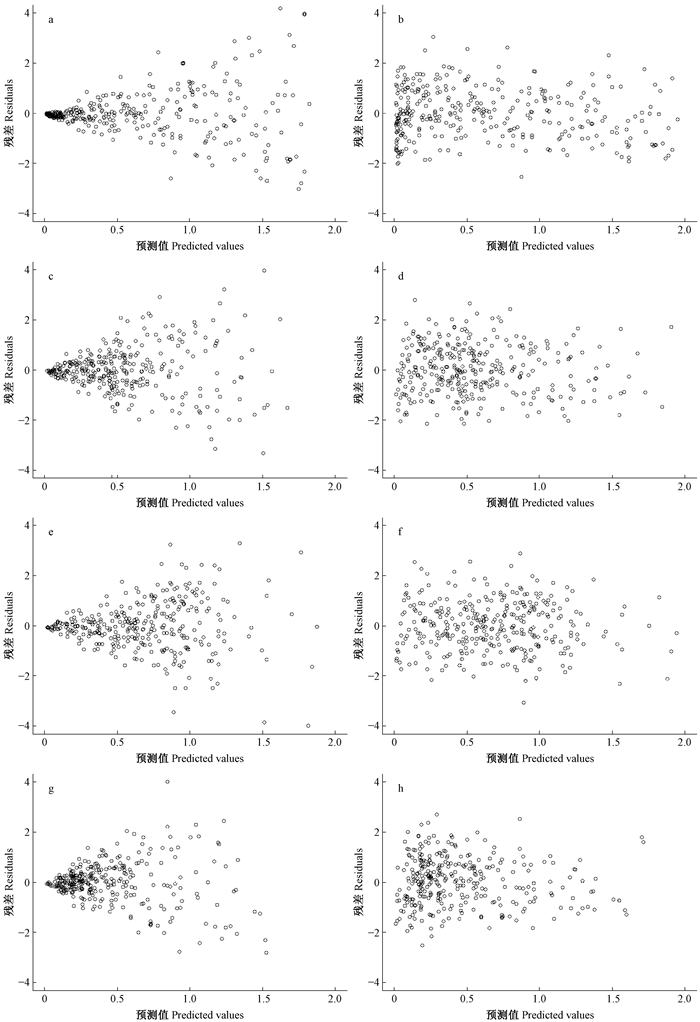
利用S-PLUS软件的广义非线性GNLS模块对模型(1)进行拟合。为了便于论述,将基于均匀、正态、右偏和左偏抽样数据拟合的模型分别称为均匀、正态、右偏和左偏模型。从残差分布(图 1a、c、e、g)可以看出,4种立木材积方程均呈现极为明显的喇叭状,即方差异质性。利用指数函数、幂函数和常数加幂函数对4种立木材积方程进行异方差校正,方差函数变量分别考虑材积观测值(V)、预测值(

|
图 1 基于最小二乘法和加权回归的残差 Figure 1 Residual plots of volume models based on least square a、c、e、g分别为均匀、正态、右偏、左偏分布未校正;b、d、f、h分别为均匀、正态、右偏、左偏分布校正。a,c,e,g indicate uniform, normal, right and left skewed distribution, respectively,and least square with power function;b,d,f,h indicate uniform, normal, right and left skewed distribution, respectively. |
|
|
表 4给出了基于最小二乘法和异方差校正后各模型参数估计值及其拟合统计量。可以看出,模型加权后参数估计的渐进标准误差均小于未加权。均匀抽样参数a和b的渐进标准误差分别下降85%和67%;正态抽样参数a和b的渐进标准误差分别下降56%和37%;右偏抽样参数a和b的渐进标准误差分别下降60%和41%;左偏抽样参数a和b的渐进标准误差分别下降56%和35%。各模型R2变化不大,相对于均匀模型,正态模型的RMSE下降31.6%,右偏模型的RMSE下降23.1%,左偏模型的RMSE下降33.7%。
|
|
利用总体检验数据,基于表 4中各模型的参数估计值,运用SAS软件分径阶计算各模型的平均误差绝对值(MAB)和相对误差绝对值(MPB),模型的MAB和MPB越小,精度越高。由表 5可以看出,在不同径阶,各模型表现不一致。径阶分布在4~8 cm时,均匀模型的MAB和MPB均小于正态、右偏和左偏模型;径阶分布在8~12 cm和40~44 cm时,正态模型的MAB和MPB均小于均匀、右偏和左偏模型;径阶分布在28~32 cm时,右偏模型的MAB和MPB均小于均匀、正态和左偏模型;径阶分布在12~28 cm、36~40 cm和44~48 cm时,左偏模型的MAB和MPB均小于均匀、正态和右偏模型,即左偏模型在11组径阶中有6组径阶的MAB和MPB均最小;径阶分布在12~32 cm和44~48 cm时,右偏模型的MAB和MPB均小于均匀和正态模型,即右偏模型在11组径阶中有6组径阶的MAB和MPB均最小;径阶分布在12~32 cm和40~44 cm时,正态模型的MAB和MPB均小于均匀模型,即正态模型在11组径阶中有6组径阶的MAB和MPB均最小。总体模型检验精度顺序为左偏模型>右偏模型>正态模型>均匀模型。
|
|
利用总体检验数据,基于表 4中各模型的参数估计值,分别计算各模型的材积预测值, 运用SAS软件分别对每2组进行T检验。由表 6可以看出,各分组间P均小于0.05,各抽样方法间具有显著差异。
|
|
到目前为止,国内外学者只是采用文中所提到的一种抽样方法收集数据,并没有研究不同抽样方法对立木材积方程预测精度的影响。本研究以兴安落叶松材积方程为例,对比了林业上常用的4种抽样方法,结果发现4种抽样方法得到的参数估计值不同,进而得到了不同的材积估计。根据各模型分径阶检验和总体检验结果,得出如下结论:左偏模型的预测精度比均匀、正态和右偏模型高,右偏模型的预测精度比均匀和正态模型高,正态模型的预测精度比均匀模型高。为了减小数据抽样的不确定性,本研究还将每种分布抽样过程重复了3次,3次抽样的拟合和检验数据都表现出基本相近的结果(限于篇幅原因,其他2次抽样结果未列出)。近年来,很多地方已经开始编制新的立木材积表,因此,为了避免资源浪费并提高工作效率,编制新的立木材积表时设计合理的抽样方法是十分必要的。根据以上结论,本研究针对数据抽样提出3点建议:1)根据样地或林分的实际分布抽样,如果林分真实分布是正态分布,那么就采取正态分布抽样;2)如果不知道林分的实际分布,建议采取左偏分布抽样;3)如果条件允许,在未知林分实际分布的前提下,可以抽取均匀分布和左偏分布2套样本分别建模,为了节约成本,这2套抽样样本可以有部分重叠,用均匀模型估计小径阶(4~12 cm)材积,用左偏模型估计其他径阶材积。但本研究所得结论只是基于现有数据,并未从理论上进行推导和探索,随着数据的积累,这方面有待进一步研究。
刘静婷, 姜立春. 2016. 大兴安岭不同区域落叶松相容性材积方程及异方差研究[J]. 林业科学研究, 29(3): 317-323. (Liu J T, Jiang L C. 2016. Compatible tree volume equations and heteroscedasticity for Dahurian Larch in different region of Daxing'anling[J]. Forest Research, 29(3): 317-323. [in Chinese]) |
Berger A, Gschwantner T, McRoberts R, et al. 2014. Effects of measurement errors on individual tree stem volume estimates for the Austrian national forest inventory[J]. Forest Science, 60(1): 14-24. DOI:10.5849/forsci.12-164 |
Brooks J R, Jiang L, Clark A. 2007. Compatible stem taper, volume and weight equations for young longleaf pine in southwest Georgia[J]. Southern Journal of Applied Forestry, 31(4): 187-191. |
Brooks J R, Wiant H. 2008. Ecoregion-based local volume equations for appalachian hardwoods[J]. Northern Journal of Applied Forestry, 25(2): 87-92. |
Gonzalez-Benecke C A, Gezan S, Samuelson L, et al. 2014. Estimating Pinus palustris tree diameter and stem volume from tree height, crown area and stand-level parameters[J]. Journal of Forestry Research, 25(1): 43-52. DOI:10.1007/s11676-014-0427-4 |
Green E, Bullock B. 2014. Assessing sampling and model error in standing green weight estimation for a Loblolly Pine plantation[J]. Forest Science, 60(4): 623-627. DOI:10.5849/forsci.13-007 |
Inoue A. 2006. A model for the relationship between form-factors for stem volume and those for stem surface area in coniferous species[J]. Journal of Forest Research, 11(4): 289-294. DOI:10.1007/s10310-006-0210-2 |
Jiang L, Brooks J R, Wang J. 2005. Compatible taper and volume equations for yellow-poplar in west Virginia[J]. Forest Ecology and Management, 213(1): 399-409. |
McRoberts R, Westfall J. 2014. Effects of uncertainty in model predictions of individual tree volume on large area volume estimates[J]. Forest Science, 60(1): 34-42. DOI:10.5849/forsci.12-141 |
Muukkonen P. 2007. Generalized allometric volume and biomass equations for some tree species in Europe[J]. European Journal of Forest Research, 126(2): 157-166. DOI:10.1007/s10342-007-0168-4 |
Nogueira E M, Nelson B W, Fearnside P M. 2006. Volume and biomass of trees in central Amazonia:influence of irregularly shaped and hollow trunks[J]. Forest Ecology and Management, 227(1/2): 14-21. |
Özçelik R, Diamantopoulou M, Wiant H, et al. 2008. Comparative study of standard and modern methods for estimating tree bole volume of three species in Turkey[J]. Forest Products Journal, 58(6): 73-81. |
Özçelik R, Mariaj D, Brooks J R, et al. 2010. Estimating tree bole volume using artificial neural network models for four species in Turkey[J]. Journal of Environmental Management, 91(3): 742-753. DOI:10.1016/j.jenvman.2009.10.002 |
Pinheiro J C, Bates DM. 2000. Mixed-effects models in S and S-Plus. Springer New York.
|
Salis S M, Assis M A, Mattos P P, et al. 2006. Estimating the aboveground biomass and wood volume of savanna woodlands in Brazil's Pantanal wetlands based on allometric correlations[J]. Forest Ecology and Management, 228(1/3): 61-68. |
Tabacchi G, Cosmo L D, Gasparini P. 2011. Aboveground tree volume and phytomass prediction equations for forest species in Italy[J]. European Journal of Forest Research, 130(6): 911-934. DOI:10.1007/s10342-011-0481-9 |
Uzoh F C C, Oliver W W. 2008. Individual tree diameter increment model for managed even-aged stands of ponderosa pine throughout the western United States using a multilevel linear mixed effects model[J]. Forest Ecology and Management, 256(3): 438-445. DOI:10.1016/j.foreco.2008.04.046 |
Wang C K. 2006. Biomass allometric equations for 10 co-occurring tree species in Chinese temperate forests[J]. Forest Ecology and Management, 222(1): 9-16. |
Westfall J. Patterson P. 2007. Measurement variability error for estimates of volume change[J]. Canadian Journal Forest Research, 37(11): 2201-2210. DOI:10.1139/X07-082 |
Westfall J A, Scott C T. 2010. Taper models for commercial tree species in the northeastern United States[J]. Forest Science, 56(6): 515-528. |
Yoon T K, Park C W, Sun J L, et al. 2013. Allometric equations for estimating the aboveground volume of five common urban street tree species in Daegu, Korea[J]. Urban Forestry and Urban Greening, 12(3): 344-349. DOI:10.1016/j.ufug.2013.03.006 |
 2018, Vol. 54

