文章信息
- 唐诚, 王春胜, 庞圣江, 黄日逸, 曾杰
- Tang Cheng, Wang Chunsheng, Pang Shengjiang, Huang Riyi, Zeng Jie
- 西南桦人工林树皮厚度模型模拟
- Simulating Bark Thickness for Betula alnoides Plantations
- 林业科学, 2017, 53(7): 85-93.
- Scientia Silvae Sinicae, 2017, 53(7): 85-93.
- DOI: 10.11707/j.1001-7488.20170709
-
文章历史
- 收稿日期:2016-07-11
- 修回日期:2017-03-28
-
作者相关文章
2. 石河子大学农学院 石河子 832003;
3. 中国林业科学研究院热带林业实验中心 凭祥 536000
2. Agricultural College, Shihezi University, the Xinjiang Uygur Autonomous Region Shihezi 832003;
3. Experimental Center of Tropical Forestry, CAF Pingxiang 536000
树皮不仅是生物能源、单宁提取的重要原料,亦是景观覆盖物等的优良材料,而且树皮作为药材也比较常见,其经济价值高(Marshall et al., 2006; Williams et al., 2007)。树皮是树木有机体的组成部分,估测树皮厚度对于树木材积、出材量以及树皮蓄积量的估计至关重要(Gordon, 1983)。
树皮厚度往往因树种而异,如希腊北部白冷杉(Abies concolor)的平均树皮厚度为10.2~17.8 cm,白云杉(Picea glauca)和黑云杉(Picea mariana)的平均树皮厚度仅0.6~1.3 cm(Kitikidou et al., 2014)。而且随着林木直径增大,树皮亦相应增厚,如Paine等(2010)在研究法国圭亚那热带低地雨林阔叶树种的树皮厚度时发现,其直径每增加10 cm,树皮厚度约增加1.2 mm;陈东来等(1994)对白桦(Betula platyphylla)、山杨(Populus davidiana)的研究也显示其树皮随着直径、树高的增大而增厚。Richardson等(2015)研究指出,针叶树种树皮厚度受直径的影响程度小于常绿阔叶树种。目前,有关阔叶树种树皮厚度的文献报道相对较少。
许多学者应用胸径、树高或年龄拟合模型估算胸高处树皮厚度(Laasasenaho et al., 2005;Sonmez et al., 2007;Williams et al., 2007;王晓林等, 2011),由于树皮厚度往往随着树干高度而变化,任意高度处树皮厚度的估计同样受到重视(Maguire et al., 1989; Laasasenaho et al., 2005; Brooks et al., 2009)。也有一些学者通过拟合相对树皮厚度(Johnson et al., 1987; Maguire et al., 1989; Laasasenaho et al., 2005)、树皮率(Cao et al., 1986; Li et al., 2010)以及去皮直径(Cole et al., 1972; Dolph, 1989; Li et al., 2010)的模型估计树皮厚度。
西南桦(Betula alnoides)是天然分布于东南亚以及我国南方的速生珍贵阔叶树种,其木材广泛应用于木地板、家具制作以及建筑装饰中(曾杰等, 2006),树皮除了可作燃料、提取栲胶外,其提取物还具有抗炎、减肥及降血脂等功效(Sur et al., 2002;Raj et al., 2015; Velavan, 2014)。近10多年来,西南桦木材及其产品的市场需求量巨大,我国西南桦种植业发展迅速,其人工林面积已超过15万hm2(王春胜等, 2013),预计未来10年内将有大量人工林进入成熟林阶段。西南桦树皮厚度估计无论对于树皮利用还是木材生产均至关重要,然而目前尚没有合适的模型估算其树皮厚度。鉴于此,本研究通过查阅文献收集及自建树皮模型,应用前期西南桦树干解析所获带皮直径、去皮直径、树皮厚度等数据进行模型拟合,比较分析不同模型的拟合效果,从而筛选出各类树皮因子估测的适宜模型,为估算西南桦材积、出材量以及树皮蓄积量奠定基础。
1 材料与方法 1.1 数据收集考虑不同年龄、海拔、坡向、坡位等因子,选取117株解析木,其中76株取自广西壮族自治区凭祥市中国林业科学研究院热带林业实验中心,41株取自广西壮族自治区百色市老山林场。解析木为西南桦人工林中的优势木或亚优势木,其所在样地基本信息见表 1。伐倒解析木之前,标明其南、北方向,伐根离地面0.2 m,用皮尺(精度为0.01 m)测量树高。去除枝丫后,以2 m为区分段,于树干上0.3、1.0、1.3、3.0、5.0 m等位置处依次截取圆盘,顶梢不足2 m时以1 m为区分段,圆盘厚度为2~3 cm。将圆盘带回实验室,分东、南、西、北4个方向应用游标卡尺(精度为0.01 cm)测量每个圆盘的树皮厚度、带皮及去皮直径。
|
|
考虑到模型拟合和验证,将117株解析木按照约75%和25%的比例随机分为2部分,一部分用于模型构建(解析木90株,圆盘1 128个),一部分用于模型检验(解析木27株,圆盘342个)。解析木数据的描述性统计结果如表 2。
|
|
通过查阅文献收集和自行建模共获得13个模型,其中包含2个自建模型(表 3),用于本研究的模型拟合。依据模型因变量将其归纳为以下几种:1) 胸高处树皮厚度(BBT);2) 任意高度处树皮厚度(BT);3) 相对树皮厚度(RBT);4) 去皮直径(dib)。
|
|
运用最小二乘法对13个模型进行拟合,并对模型参数进行显著性检验(显著性水平0.05)。针对所有参数均显著的模型,进一步应用偏差(B)、绝对偏差(AB)、均方误差(MSE)和决定系数(R2)4个统计指标进行综合评价,其计算公式如下:
| $B = \sum\limits_{i = 1}^n {\frac{{\left( {{d_i} - {{\hat d}_i}} \right)}}{n}} ;$ |
| ${\rm{AB}} = \sum\limits_{i = 1}^n {\frac{{\left| {{d_i} - {{\hat d}_i}} \right|}}{n}} ;$ |
| ${\rm{MSE}} = \frac{{\sum\limits_{i = 1}^n {{{\left( {{d_i} - {{\hat d}_i}} \right)}^2}} }}{{n - m}};$ |
| ${R^2} = 1 - \frac{{\sum\limits_{i = 1}^n {{{\left( {{d_i} - {{\hat d}_i}} \right)}^2}} }}{{\sum\limits_{i = 1}^n {{{\left( {{d_i} - \bar d} \right)}^2}} }}。$ |
式中:di为第i个实测值;
应用相对排序法(Poudel et al., 2013)分别计算各模型B、AB、MSE及R2的相对排序值,其计算公式为:
| ${\rm{Ran}}{{\rm{k}}_i} = 1 + \frac{{\left( {W - 1} \right)\left( {{S_i} - {S_{\min }}} \right)}}{{{S_{\max }} - {S_{\min }}}}。$ |
式中:Ranki为模型i的相对排序值(i=1, 2, …, w),其值越小说明模型拟合效果越好;w为参与排序的模型数目;Si为模型i的统计指标值(分别为B、AB、MSE和R2);Smin和Smax分别为Si的最小值和最大值。
由于偏差均值存在负值,故取其绝对值计算相对排序值;绝对偏差和均方误差越小,模型拟合效果越好;而R2则是值越大拟合效果越好,为了保证判断标准一致,取值1-R2,使之统一到值越小模型拟合效果越好。最后计算4个统计指标的平均相对排序值,通过比较其大小即可判断模型拟合的优劣。
应用配对t检验方法检验模型的有效性,若预估值和实测值之间存在显著差异(P<0.05),则说明此模型拟合效果不佳。进一步对预估值和实测值差异不显著(P≥0.05) 的模型进行共线性和异方差性诊断。应用条件指数评价共线性大小,条件指数是模型自变量相关矩阵最大特征根和最小特征根的比值,如果条件指数大于1 0000.5,则认为具有共线性(Myers, 1990)。通过图形检验(Cellini et al., 2012)、怀特检验等方法检验模型中是否存在异方差;若模型中存在异方差,通过变量变换予以修正(何晓群等, 2015)。
上述数据分析均采用R软件(Ver.3.2.2) 完成。
2 结果与分析 2.1 模型拟合及参数检验应用90株解析木的相关数据对13个模型进行拟合,其参数显著性检验结果(表 4)表明,模型(2) 和(5) 均有一个参数预估值与零差异不显著(P≥0.05),将不参与进一步分析。对照表 3和4可以看出,胸高处树皮厚度拟合模型(2) 和(5) 中不显著者为自变量树高(H)或lnH的参数,是因为胸高处树皮厚度与树高无明显相关性的缘故(图 1)。
|
|

|
图 1 树高与胸高处树皮厚度关系 Fig.1 The plot of tree height and bark thickness at breast height |
模型拟合效果直接影响其预测结果的准确性。由表 5可知,11个模型的偏差除了模型(10) 和(12) 约为-0.03外,其余9个模型均接近0。拟合胸高处树皮厚度的3个模型,模型(1) 的绝对偏差最大(0.27),模型(3) 和(4) 略小于0.20;拟合任意高度处树皮厚度的2个模型以及去皮直径的4个模型,其绝对偏差均约为0.24;拟合相对树皮厚度的2个模型,其绝对偏差约为0.14。所有模型均方误差(MSE)大小顺序与绝对偏差(AB)顺序基本一致。R2以模型(10)、(11) 和(12) 为最高,均接近1;而模型(1)、(3) 和(4) 的R2则在0.5以下。
|
|
综合4项统计指标的排序值可以看出,11个模型中,模型(8) 和(9) 的综合排序值最低(2.2~2.4),模型(1)、(10) 和(12) 排序值最大(7.0~8.2),其他模型居中(4.4~5.5)。同类模型比较,拟合BBT的3个模型,模型(1) 拟合度最低,模型(3) 和(4) 的拟合效果几乎相同;拟合BT的2个模型(6) 和(7),其效果差异不大;拟合RBT的模型(8) 略优于模型(9);模拟去皮直径的4个模型,模型(11) 和(13) 的拟合效果优于模型(10) 和(12)。
2.3 模型检验应用27株解析木的相关数据对11个模型的预估值和实测值进行配对t检验,其中模型(9)、(12) 和(13) 的预估值和实测值之间存在显著差异(表 6),因而予以剔除。对剩余的8个模型进行共线性和异方差性诊断。
|
|
在8个模型中,(1)、(3)、(6)、(10) 和(11)5个模型只有1个自变量,无需考虑共线性问题。模型(4) 的条件指数略大于1 0000.5(表 7),存在微弱共线性,模型(7) 和(8) 的条件指数小于1 0000.5,不存在共线性(Myers, 1990)。
|
|
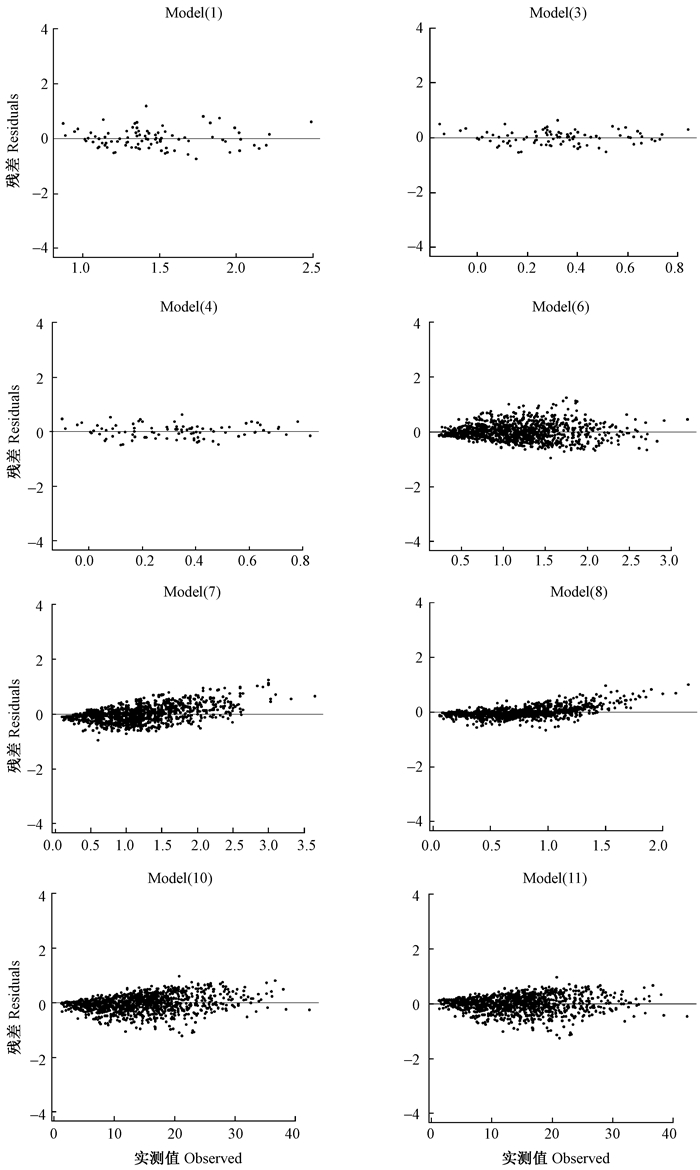
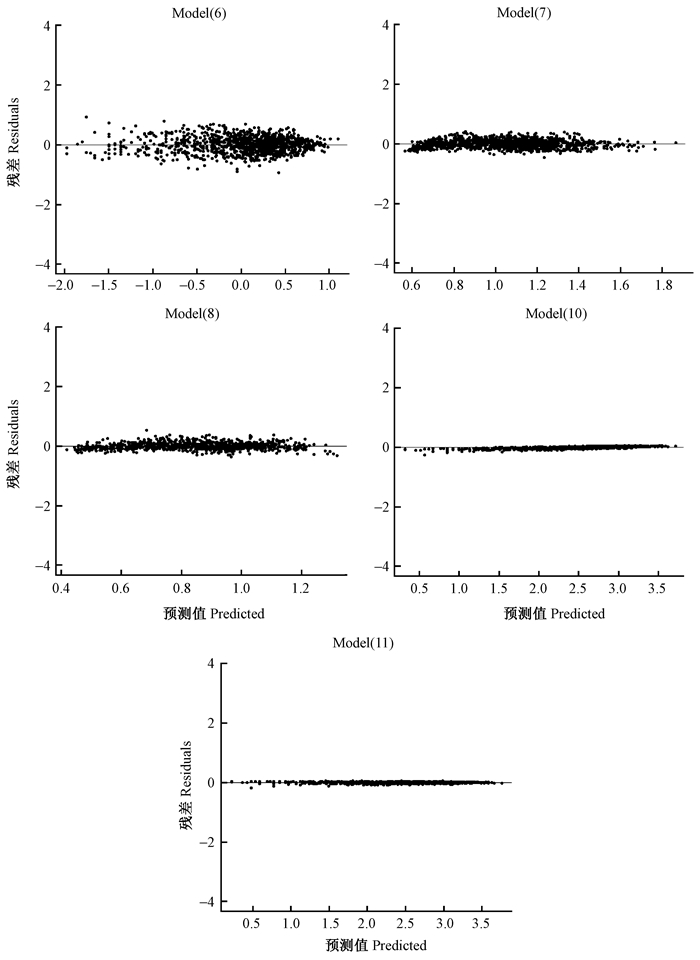
从8个模型的残差散点图(图 2)可以看出,模型(1)、(3) 和(4) 拟合胸高处树皮厚度(BBT)具有相似的残差分布,基本在零附近,经怀特检验表明不存在异方差性问题;其余5个模型均存在异方差性影响。模型(6)、(10) 和(11) 通过取对数后回归,模型(7) 和(8) 对因变量开方后回归,变换后模型的残差散点图(图 3)以及评价指标(表 8)均有明显改善。

|
图 2 8个模型残差 Fig.2 Plot of residuals against observed values for 8 selected models |
|
|

|
图 3 异方差修正后模型残差 Fig.3 Plot of residuals against fitted values for five models after correction of heteroskedasticity |
模型评价既要考虑其拟合性能,又要兼顾其应用上简单可行。一些学者在拟合胸高处树皮厚度时通过增加自变量,如树高(王晓林等, 2011)、年龄(Sonmez et al., 2007),或者通过自变量的对数转化(Laasasenaho et al., 2005; Sonmez et al., 2007)提高模型决定系数(R2)。本研究中,模型(4) 在模型(3) 的基础上增加年龄变量,提高了R2,模型(3) 对模型(1) 两边取对数却降低了R2;模型(1) 和(4) 增加树高项后分别转变为模型(2) 和(5),但参数检验时树高项却不显著;模型(3) 和(4) 的拟合效果优于模型(1),但模型(4) 存在微弱共线性。因此,选择模型(3) 预估西南桦胸高处树皮厚度。
对于同一株树而言,从基部到梢头,随着直径变小,其对应高度处树皮厚度亦减少(Laasasenaho et al., 2005),模型(6) 和(7) 均反映了这种变化趋势。模型(7) 拟合后年龄与任意高度处树皮厚度呈正相关,亦符合生物学规律。2个模型均获得了较好的拟合效果,模型的异方差性亦得到修正,但从二者综合排序来看,模型(7) 略优于模型(6)。
Li等(2010)对7个针叶树种相对树皮厚度(RBT)的研究发现,其与RH2、H以及RD这些变量显著相关,本研究中模型(8) 拟合结果与此相一致。采用模型(9) 拟合相对树皮厚度,有学者认为β2因树种而异,并不是固定的(Muhairwe, 2000;Li et al., 2010)。Johnson等(1987)对辐射松(Pinus radiata)的研究表明,β2赋值4.0时拟合效果良好。对于西南桦而言,β2约1.0时效果最好,但其预估值与实测值间差异显著。因此,选择模型(8) 用于西南桦相对树皮厚度的模拟,但从其残差散点图来看,当RBT>1时(多为胸径位置以下),其残差均表现为正值,说明过低估计相对树皮厚度,可能与胸径以下树皮多翘起而难于准确测量有关,若建立分段方程或许模拟效果更好。
任意高度处的去皮直径是木材加工企业最关注的问题,预估给定树干高度处的去皮直径对于材积计算至关重要(Kozak, 2004)。利用带皮直径拟合去皮直径的4个模型中,当β2等于1时,模型(13) 变为模型(10),模型(12) 经两边开方处理亦变为模型(10);模型(11) 是在模型(10) 的基础上增加了常数项。本研究中,模型(13) 中β2=1.011≈1,模型(12) 中自变量的系数值开方即0.857 ≈0.926。通过综合排序、配对t检验分析,从4个模型中选择模型(11) 估算任意高度处去皮直径。实际应用时,2 m以下任意高度处树皮厚度通常容易测定,如利用打孔器即可取样测定,但高于2 m后树皮厚度则难以直接测定,可使用林分速测镜快速获取任意高度处带皮直径,亦可利用削度方程获取任意高度处带皮直径,进而利用模型(11) 拟合任意高度处去皮直径。
树皮厚度除了受林木年龄、树高、胸径等因子影响外,还受立地因子的影响。如阴坡的东方云杉(Picea orientalis)其胸径可以解释50%胸高处2倍树皮厚度变异,而阳坡则可以解释68%的变异(Sonmez et al., 2007);生长于贫瘠山脊上的林木,树皮厚度往往大于生长在养分丰富山谷的林木(Jager et al., 2015)。本研究所选模型中未将立地因子作为解释变量,未来可考虑纳入立地因子,完善现有模型或新建模型,进一步研究树皮厚度变化规律。
4 结论本研究对胸高处树皮厚度、任意高度处树皮厚度、相对树皮厚度、去皮直径4个树皮厚度因子进行拟合,分别筛选出模型(3)、(7)、(8) 和(11),这些模型拟合精度高,不存在共线性问题,异方差性不存在或通过变量变换可得到较好修正;且模型拟合所需基础数据,如年龄、胸径、树高在生产实践中易获取,任意高度处带皮直径则可通过林分速测镜快速测定。因此,上述模型颇具应用前景。
| [] |
陈东来, 秦淑英. 1994. 树皮厚度、树皮材积与直径和树高相关关系的研究. 河北林学院学报, 9(3): 248–250.
( Chen D L, Qin S Y. 1994. Studies on correlation of thickness and volume of tree bark to trunk diameter and height. Journal of Hebei Forestry College, 9(3): 248–250. [in Chinese] ) |
| [] |
何晓群, 刘文卿. 2015. 应用回归分析. 北京, 中国人民大学出版社.
( He X Q, Liu W Q. 2015. Applied regression analysis. Beijing, China Renmin University Press. [in Chinese] ) |
| [] |
王春胜, 赵志刚, 曾冀, 等. 2013. 广西凭祥西南桦中幼林林木生长过程与造林密度的关系. 林业科学研究, 26(2): 257–262.
( Wang C S, Zhao Z G, Zeng J, et al. 2013. Relationship between planting density and tree growth process of Betula alnoides mid-young plantations in Pingxiang, Guangxi. Forest Research, 26(2): 257–262. [in Chinese] ) |
| [] |
王晓林, 蔡可旺, 姜立春. 2011. 落叶松树皮厚度变化规律的研究. 森林工程, 27(2): 8–11.
( Wang X L, Cai K W, Jiang L C. 2011. Study on bark thickness of Dahurian larch. Forest Engineering, 27(2): 8–11. [in Chinese] ) |
| [] |
曾杰, 郭文福, 赵志刚, 等. 2006. 我国西南桦研究的回顾与展望. 林业科学研究, 19(3): 379–384.
( Zeng J, Guo W F, Zhao Z G, et al. 2006. Domestication of Betula alnoides in China: current status and perspectives. Forest Research, 19(3): 379–384. [in Chinese] ) |
| [] | Brooks J R, Jiang L C. 2009. Comparison of prediction equations for estimating inside bark diameters foryellow-poplar, red maple, and red pine in West Virginia. Northern Journal of Applied Forestry, 26(1): 5–8. |
| [] | Cao Q V, Pepper W D. 1986. Predicting inside bark diameter for shortleaf, loblolly, and longleaf pines. Southern Journal of Applied Forestry, 10(4): 220–224. |
| [] | Cellini J M, Galarza M, Burns S L, et al. 2012. Equations of bark thickness and volume profiles at different heights with easy-measurement variables. Forest Systems, 21(1): 23–30. DOI:10.5424/fs/2112211-01963 |
| [] | Cole D M, Stage A R. 1972. Estimating future diameters of lodgepole pine. Research Paper INT-131, Ogden, UT: Intermountain Forest and Range Experiment Station, Forest Service, U. S. Department of Agriculture, 20. |
| [] | Dolph K L. 1989. Nonlinear equations for predicting diameter inside bark at breast height for young-growth red fir in California and southern Oregon. Research Note PSW-409, Berkeley, CA: Pacific Southwest Forest and Range Experiment Station, Forest Service, U. S. Department of Agriculture, 4. |
| [] | Gordon A D. 1983. Estimating bark thickness of Pinus radiata. New Zealand Journal of Forestry Science, 13(2): 340–345. |
| [] | Jager M M, Richardson S J, Bellingham P J, et al. 2015. Soil fertility induces coordinated responses of multiple independent functional traits. Journal of Ecology, 103(2): 374–385. DOI:10.1111/1365-2745.12366 |
| [] | Johnson T S, Wood G B. 1987. Simple linear model reliably predicts bark thickness of radiata pine in the Australian capital territory. Forest Ecology and Management, 22(3/4): 173–183. |
| [] | Kitikidou K, Papageorgiou A, Milios E, et al. 2014. A bark thickness model for Pinus halepensis in kassandra, Chalkidiki(northern Greece). Silva Balcanica, 15(1): 47–55. |
| [] | Kozak A. 2004. My last words on taper equations. Forestry Chronicle, 80(4): 507–515. DOI:10.5558/tfc80507-4 |
| [] | Laasasenaho J, Melkas T, Aldén S. 2005. Modelling bark thickness of Picea abies with taper curves. Forest Ecology and Management, 206(1/3): 35–47. |
| [] | Li R, Weiskittel A R. 2010. Estimating and predicting bark thickness for seven conifer species in the Acadian Region of North America using amixed-effects modeling approach: comparison of model forms and subsampling strategies. European Journal of Forest Research, 130(2): 219–233. |
| [] | Loetsch F, Zöhrer F, Haller K E. 1973. Forest Inventory, Vol. Ⅱ. BLV Verlagsgesellschaft, München, 469. |
| [] | Maguire D A, Hann D W. 1989. Bark thickness and bark volume in southwestern Oregon Douglas-fir. Western Journal of Applied Forestry, 5(1): 5–8. |
| [] | Marshall H D, Murphy H D, Lachenbruch B. 2006. Effects of bark thickness estimates on optimal log merchandising. Forest Products Journal, 56(11/12): 87–92. |
| [] | Myers R H. 1990. Classical and modern regression with applications.2nd ed. Duxbury Press, Belmont. |
| [] | Muhairwe C K. 2000. Bark thickness equations for five commercial tree species in regrowth forests of northern New South Wales. Australian Forestry, 63(1): 34–43. DOI:10.1080/00049158.2000.10674811 |
| [] | Paine C E T, Stahl C, Courtois E A, et al. 2010. Functional explanations for variation in bark thickness in tropical rain forest trees. Functional Ecology, 24(6): 1202–1210. DOI:10.1111/j.1365-2435.2010.01736.x |
| [] | Poudel K P, Cao Q V. 2013. Evaluation of methods to predict Weibull parameters for characterizing diameter distributions. Forest Science, 59(2): 243–252. DOI:10.5849/forsci.12-001 |
| [] | Raj A D A, Malarvili T, Velavan S. 2015. Restorative effect of Betula alnoides bark on hepatic metabolism in high fat diet fed wistar rats. International Journal of Pharmaceutical and BioSciences, 6(3): B1281–B1288. |
| [] | Richardson S J, Laughlin D C, Lawes M J, et al. 2015. Functional and environmental determinants of bark thickness in fire-free temperate rain forest communities. American Journal of Botany, 17(2): 196–199. |
| [] | Sonmez T, Keles S, Tilki F. 2007. Effect of aspect, tree age and tree diameter on bark thickness of Picea orientalis. Scandinavian Journal of Forest Research, 22(3): 193–197. DOI:10.1080/02827580701314716 |
| [] | Sur T K, Pandit S, Battacharyya D, et al. 2002. Studies on the antiinflammatory activity of Betula alnoides bark. Phytotherapy Research, 16(7): 669–671. DOI:10.1002/(ISSN)1099-1573 |
| [] | Velavan S. 2014. Antioxidant activity ofBetula alnoides bark extract in high fat diet fed wistar rats. International Journal of ChemTech Research, 7(5): 2391–2398. |
| [] | Williams V L, Witkowski E T F, Balkwill K. 2007. Relationship between bark thickness and diameter at breast height for six tree species used medicinally in South Africa. South African Journal of Botany, 73(3): 449–465. DOI:10.1016/j.sajb.2007.04.001 |
 2017, Vol. 53

